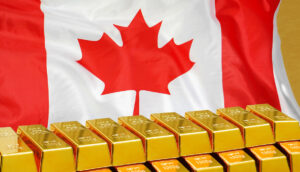
Canada Unearthed: TSX targets ASX companies for dual-listings in conviction mining juniors can prosper in Canada

Pic: Getty Images
- Toronto Stock Exchange owner TMX group is ramping up engagement in Australia in a bid to secure more dual listings
- Junior ASX companies with projects in the Americas are on the TSX’s wishlist
- Almost 75% of the C$4.3b in equity raised on the TSX and TSX-V in the past quarter was for mining companies
It’s become commonplace to hear in recent months that a dearth of liquidity for mining juniors on the TSX and TSX-V, especially in energy transition metals like lithium and rare earths, has them looking to Australia to chase funds and finance.
But the TSX has begun a renewed push into international markets, appointing an Australian BD head and laying down the welcome mat to international companies to dual list in Toronto.
With almost 75% of the C$4.3b in equity raised on the TSX and TSX-V in the March quarter concentrated in mining, along with 21 of their 55 new listings, the TSX’s top brass want to show the Canadian Dollar is warming to diggers and drillers.
There are almost 3500 companies listed on the Toronto exchange, the vast bulk located in Ontario and British Columbia. But there were 237 international companies with joint listings on the TSX as of March 31.
Of those 20 were in Australia, New Zealand and Papua New Guinea.
“If you look at all the mining capital raised around the world over the last five years the TSX and TSX Venture Exchange are about US$45 billion, Australia’s about $40 billion and the next biggest market for raising mining capital will be New York at US$10b,” TSX/TSX-V chief commercial officer Rob Peterman said.
“So between Australia and Canada, you’re getting access to the most amount of capital.
“As energy transition continues and critical minerals become part of supply chains, for more and more companies there’s going to be a greater need to finance and that ability for companies to tap into the strength of the Canadian market and the Australian market is something that we think will continue to grow.”
More to come
It is the first of two entreaties planned by bigwigs from Canada’s top stock exchange to liaise with Aussie companies and investors, with the TSX’s head of mining expected to return in around a month with Canadian investment bankers and lawyers in tow.
While anecdotally companies listed in Toronto have spoken of issues raising finance and maintaining liquidity, Peterman said numbers showed the amount of capital raised for mining equities on the TSX and ASX were similar last year.
“We definitely have heard from companies that in particular categories like lithium, there was a particularly high appetite in Australia. To me that’s just proof that the two markets can work well together,” Peterman said.
“If the Canadian market is a bit slower for raising capital, then you can look at Australia. But we know over time that pendulum will shift back and forth and that ability to access capital in both markets can benefit companies over the long term.
“We agree and we’ve heard that, particularly around lithium say over the last few years, there’s been a lot of appetite for Australian companies, but I think when you look at the numbers on paper the markets were about even in terms of finding capital raise, and if you look over a five-year period TSX raises slightly more capital than the ASX overall.”
Luke Allshorn, the head of BD for Australia and South-East Asia, said the TMX Group was especially keen to secure access for Canadian investors to junior ASX stocks with projects in the Americas, a cohort of around 100 companies on the ASX with a sub-$200 mil market cap.
“There’s about 50 of those companies in Canada and there are more companies sub-$200m listed on the ASX with their major projects in Canada than in Queensland,” Allshorn said.
“Clearly lithium around James Bay in Quebec and in Ontario is a big point. So they’re the kind of dialogues we’re starting to have. Traditionally South American companies in mining also list their companies on the TSX and TSX-V.
“There’s clearly a universe of companies who have their projects in the Americas who arguably will get a better hearing from North American investors because not only do they understand the commodity but they understand the geography better than maybe someone in Australia.”
Uranium run shifts investors’ focus to mining
Uranium’s recent run to US$90/lb has been a positive for the TSX as well, given the historic strength of the exchange in the yellowcake market.
The world’s richest uranium province is the Athabasca Basin in Saskatchewan, and Canadian based C$29 billion listed Cameco (TSX:CCO) is the world’s largest Western producer.
Precious metals is also a big focus area, with gold prices near record highs and silver bullion at levels not seen in around a decade.
“Definitely uranium has been the commodity that’s getting the most interest right now in the marketplace,” Peterman said.
“We have a traditional strength in precious metals, and I know a lot of the mining companies would like to see their stock prices moving with the gold price.
“Uranium has been active with financing and listings in the market, for sure. We haven’t seen as much on the precious metals side. Hopefully we’ll see some more financings picking up to go along with the higher gold prices.”
But Peterman says market awareness in energy transition metals is growing in Canada as well.
“We think it’s the driving theme in the markets right now. We’re … hosting lithium investor conferences with investment banks trying to build interest in the category,” he said.
“We also worked with S&P last year to launch an energy transition materials index.
“BlackRock has built an ETF on that index in Canada (iShares S&P/TSX Energy Transition Materials Index ETF (TSX:XETM)) but we’re also trying to bring investors index products as well.
“So investors can go both for directly investing in lithium companies or companies that are involved in the energy transition space, but also invest in tools like the energy transition index where they can get access to a larger portfolio of companies in the energy transition space — passive as well as active investment opportunities.”
TSX & TSXV Resources Winners & Losers
Here’s how Toronto-listed mining and exploration stocks performed last week:
Scroll or swipe to reveal tables. Click headings to sort. Best viewed on a laptop.
Stocks missing from these lists? Email [email protected]
TSX
| CODE | COMPANY | PRICE | WEEK RETURN % | MONTH RETURN % | 6 MONTH RETURN % | YEAR RETURN % | MARKET CAP |
|---|---|---|---|---|---|---|---|
| ARA | Aclara Resources Inc. | 0.485 | -3% | 9% | 20% | 13% | $ 78,389,490.72 |
| AEM | Agnico Eagle Mines Limited | 85.96 | 1% | 13% | 27% | 13% | $ 42,530,937,321.70 |
| AGI | Alamos Gold Inc. | 20.64 | 0% | 12% | 17% | 19% | $ 8,049,589,281.79 |
| AMM | Almaden Minerals Ltd. | 0.155 | -9% | -16% | -14% | -30% | $ 23,327,639.36 |
| ALS | Altius Minerals Corporation | 20.99 | -2% | 2% | 3% | -3% | $ 979,652,812.30 |
| USA | Americas Gold and Silver Corporation | 0.365 | 0% | 26% | -22% | -49% | $ 91,622,274.45 |
| ARG | Amerigo Resources Ltd. | 1.71 | -1% | 16% | 53% | -1% | $ 282,809,085.30 |
| AR | Argonaut Gold Inc. | 0.41 | 1% | 34% | -21% | -31% | $ 507,633,382.40 |
| AAUC | Allied Gold Corporation | 3.73 | -3% | 17% | -7% | 0% | $ 905,114,553.33 |
| ARIS | Aris Mining Corporation | 5.43 | 11% | 22% | 62% | 37% | $ 785,374,765.40 |
| AMC | Arizona Metals Corp. | 2.22 | 5% | 19% | -22% | -47% | $ 251,810,714.68 |
| ASCU | Arizona Sonoran Copper Company Inc. | 1.34 | -7% | 0% | -14% | -32% | $ 149,643,449.15 |
| ASND | Ascendant Resources Inc. | 0.06 | -14% | 9% | -37% | -73% | $ 10,800,980.64 |
| AOT | Ascot Resources Ltd. | 0.77 | -4% | 8% | 103% | 26% | $ 480,367,954.99 |
| G | Augusta Gold Corp. | 0.97 | -15% | -1% | 24% | -27% | $ 88,507,645.59 |
| ORA | Aura Minerals Inc. | 10.43 | -6% | 7% | 17% | -5% | $ 775,103,042.19 |
| AVL | Avalon Advanced Materials Inc. | 0.075 | 0% | -12% | -35% | -35% | $ 45,186,965.92 |
| ASM | Avino Silver & Gold Mines Ltd. | 0.97 | -6% | 26% | 47% | -18% | $ 124,801,275.84 |
| AYA | Aya Gold & Silver Inc. | 13.83 | 4% | 13% | 87% | 30% | $ 1,746,525,878.29 |
| BTO | B2Gold Corp. | 3.5 | -4% | 3% | -23% | -37% | $ 4,520,891,401.56 |
| ABX | Barrick Gold Corporation | 22.8 | 0% | 8% | 1% | -12% | $ 39,519,368,633.51 |
| BSX | Belo Sun Mining Corp. | 0.045 | 0% | 0% | -25% | -36% | $ 20,477,486.16 |
| BKI | Black Iron Inc. | 0.05 | 0% | 0% | -9% | -29% | $ 16,726,624.09 |
| CXB | Calibre Mining Corp. | 1.86 | 4% | 14% | 27% | 20% | $ 1,429,997,399.74 |
| CCO | Cameco Corporation | 66.48 | 0% | 13% | 27% | 93% | $ 28,140,874,787.12 |
| CCM | Canagold Resources Ltd. | 0.24 | 4% | 9% | 9% | -6% | $ 41,661,454.56 |
| ATCU | Alta Copper Corp. | 0.485 | 5% | 9% | 37% | -16% | $ 41,253,256.80 |
| CS | Capstone Copper Corp. | 8.97 | -6% | 14% | 89% | 35% | $ 6,938,860,740.75 |
| CEE | Centamin plc | 2.1 | -4% | 14% | 57% | 22% | $ 2,455,877,313.40 |
| CG | Centerra Gold Inc. | 8.65 | 5% | 12% | 23% | -10% | $ 1,783,364,584.90 |
| CNT | Century Global Commodities Corporation | 0.03 | 0% | -40% | 0% | -71% | $ 4,137,191.98 |
| CIA | Champion Iron Limited | 5.97 | 3% | -6% | 11% | -3% | $ 3,072,162,370.18 |
| CGG | China Gold International Resources Corp. Ltd. | 8.08 | -5% | -3% | 40% | 19% | $ 3,290,234,149.90 |
| COG | Condor Gold plc | 0.49 | -6% | 23% | 51% | -8% | $ 101,935,817.52 |
| DML | Denison Mines Corp. | 2.72 | -3% | 3% | 31% | 99% | $ 2,453,122,652.75 |
| DSV | Discovery Silver Corp. | 0.95 | 4% | 38% | 48% | -17% | $ 368,874,934.95 |
| DPM | Dundee Precious Metals Inc. | 10.57 | 0% | 8% | 21% | 4% | $ 1,886,718,870.40 |
| DNG | Dynacor Group Inc. | 5.09 | 6% | 27% | 57% | 66% | $ 186,634,349.16 |
| ELR | Eastern Platinum Limited | 0.165 | 10% | 74% | 94% | 27% | $ 29,275,706.77 |
| ECOR | Ecora Resources plc | 1.42 | -3% | 8% | -11% | -38% | $ 367,951,013.43 |
| ELD | Eldorado Gold Corporation | 19.72 | -5% | 8% | 41% | 36% | $ 3,995,652,272.07 |
| ELO | Eloro Resources Ltd. | 1.75 | 17% | 37% | -8% | -52% | $ 122,175,877.95 |
| EDV | Endeavour Mining plc | 28.86 | -1% | 15% | -1% | -18% | $ 6,958,743,731.94 |
| EDR | Endeavour Silver Corp. | 3.7 | 5% | 24% | 14% | -32% | $ 843,584,547.78 |
| EFR | Energy Fuels Inc. | 7.17 | -11% | -15% | -33% | 5% | $ 1,169,224,660.75 |
| ETG | Entree Resources Ltd. | 1.59 | 0% | 17% | 24% | 16% | $ 323,318,476.86 |
| EQX | Equinox Gold Corp. | 7.82 | -3% | 7% | 25% | 15% | $ 2,559,272,405.20 |
| ERD | Erdene Resource Development Corporation | 0.4 | 4% | 3% | 21% | 4% | $ 138,135,270.40 |
| ERO | Ero Copper Corp. | 26.27 | -5% | 3% | 41% | 0% | $ 2,733,667,210.40 |
| ESM | Euro Sun Mining Inc. | 0.055 | -8% | 38% | 22% | 22% | $ 19,088,819.88 |
| EXN | Excellon Resources Inc. | 0.175 | -8% | -3% | 67% | -55% | $ 16,438,116.09 |
| MIN | Excelsior Mining Corp. | 0.195 | 3% | 56% | 44% | -24% | $ 61,506,092.31 |
| FDY | Faraday Copper Corp. | 0.73 | 11% | 18% | 16% | -33% | $ 135,970,892.75 |
| FIL | Filo Corp | 24.48 | 5% | 7% | 35% | 4% | $ 3,227,801,893.23 |
| FR | First Majestic Silver Corp. | 9.31 | -1% | 28% | 24% | -4% | $ 2,585,215,665.00 |
| FF | First Mining Gold Corp. | 0.14 | -13% | 17% | 12% | -24% | $ 137,764,310.25 |
| FM | First Quantum Minerals Ltd. | 15.52 | 0% | 14% | -47% | -51% | $ 13,278,151,601.82 |
| FCU | Fission Uranium Corp. | 1.08 | 0% | 7% | 26% | 93% | $ 876,245,258.70 |
| FSY | Forsys Metals Corp. | 0.89 | -4% | -9% | 35% | 102% | $ 171,749,130.96 |
| FVI | Fortuna Silver Mines Inc. | 6.37 | 1% | 38% | 57% | 28% | $ 1,874,210,959.07 |
| FT | Fortune Minerals Limited | 0.035 | -13% | 0% | -13% | -30% | $ 17,487,535.17 |
| FNV | Franco-Nevada Corporation | 163.08 | 1% | 5% | -14% | -21% | $ 31,153,811,274.00 |
| FVL | Freegold Ventures Limited | 0.455 | -9% | 14% | 17% | -3% | $ 207,696,444.77 |
| FURY | Fury Gold Mines Limited | 0.68 | -4% | 24% | 46% | -12% | $ 99,332,430.04 |
| GAU | Galiano Gold Inc. | 2.04 | 3% | 27% | 162% | 139% | $ 499,677,604.38 |
| GATO | Gatos Silver, Inc. | 13.84 | 4% | 27% | 103% | 63% | $ 888,284,643.48 |
| GENM | Generation Mining Limited | 0.255 | -2% | -6% | -14% | -57% | $ 59,013,352.00 |
| GLO | Global Atomic Corporation | 1.88 | -12% | -21% | -11% | -28% | $ 383,589,707.46 |
| GMX | Globex Mining Enterprises Inc. | 1 | 5% | 16% | 25% | 23% | $ 55,231,836.00 |
| GGD | GoGold Resources Inc. | 1.33 | -5% | 15% | -1% | -27% | $ 423,909,891.51 |
| GMTN | Gold Mountain Mining Corp. | 0.035 | 0% | 75% | -61% | -83% | $ 27,471,805.84 |
| GRC | Gold Springs Resource Corp. | 0.055 | -31% | -27% | -31% | -50% | $ 22,510,412.64 |
| AUMN | Golden Minerals Company | 0.79 | -16% | 103% | -74% | -90% | $ 11,074,860.60 |
| GGA | Goldgroup Mining Inc. | 0 | -100% | -100% | -100% | -100% | $ 2,482,294.68 |
| GOLD | Goldmining Inc. | 1.13 | -3% | -1% | 8% | -21% | $ 205,477,486.83 |
| HZM | Horizonte Minerals Plc. | 0.01 | 100% | -85% | -97% | -100% | $ 2,697,789.06 |
| HBM | HudBay Minerals Inc. | 10.55 | 1% | 13% | 80% | 53% | $ 3,688,990,325.28 |
| IAU | i-80 Gold Corp. | 1.67 | -3% | -5% | -20% | -50% | $ 480,956,056.00 |
| IMG | Iamgold Corporation | 5.05 | 3% | 25% | 55% | 31% | $ 2,378,876,931.85 |
| III | Imperial Metals Corporation | 2.47 | 1% | 14% | 17% | 39% | $ 385,253,791.58 |
| ITH | International Tower Hill Mines Ltd. | 0.84 | -3% | 4% | 45% | 18% | $ 175,730,228.96 |
| IE | Ivanhoe Electric Inc. | 13.25 | -5% | 10% | -12% | -14% | $ 1,596,466,113.78 |
| IVN | Ivanhoe Mines Ltd. | 18.14 | -4% | 13% | 73% | 51% | $ 24,161,502,946.02 |
| JAG | Jaguar Mining Inc. | 2.9 | -3% | 24% | 110% | 15% | $ 221,386,662.00 |
| KNT | K92 Mining Inc. | 7.46 | -1% | 21% | 32% | 8% | $ 1,719,926,871.08 |
| KRN | Karnalyte Resources Inc. | 0.18 | -3% | 13% | -25% | -27% | $ 9,857,536.67 |
| KRR | Karora Resources Inc. | 5.57 | 8% | 22% | 35% | 23% | $ 983,763,901.93 |
| K | Kinross Gold Corporation | 8.97 | 3% | 17% | 22% | 33% | $ 10,915,479,588.86 |
| LIF | Labrador Iron Ore Royalty Corporation | 29.89 | 1% | 2% | -1% | -4% | $ 1,927,040,000.00 |
| LAM | Laramide Resources Ltd. | 0.69 | -3% | -1% | 13% | 92% | $ 174,201,787.20 |
| LGO | Largo Inc. | 2.03 | 4% | -6% | -45% | -69% | $ 128,102,724.00 |
| LGD | Liberty Gold Corp. | 0.35 | 9% | 27% | 25% | -38% | $ 117,334,521.22 |
| LAAC | Lithium Americas (Argentina) Corp. | 6.9 | -1% | 1% | -12% | -73% | $ 1,072,354,495.96 |
| LIRC | Lithium Royalty Corp. | 6.8 | -3% | -4% | -31% | -56% | $ 172,817,421.20 |
| LN | Loncor Gold Inc. | 0.375 | 1% | 0% | 12% | 1% | $ 55,374,902.64 |
| LUC | Lucara Diamond Corp. | 0.31 | 0% | -6% | -16% | -35% | $ 139,713,604.87 |
| LUG | Lundin Gold Inc. | 19 | 1% | 4% | 6% | 12% | $ 4,516,132,548.41 |
| LUN | Lundin Mining Corporation | 15.25 | 0% | 15% | 77% | 49% | $ 12,227,769,541.89 |
| MAG | MAG Silver Corp. | 16.62 | 2% | 33% | 12% | -4% | $ 1,674,447,564.30 |
| MND | Mandalay Resources Corporation | 2.39 | 7% | 63% | 54% | -4% | $ 219,300,463.00 |
| MOZ | Marathon Gold Corporation | 0 | -100% | -100% | -100% | -100% | $ 380,022,058.35 |
| MARI | Marimaca Copper Corp. | 3.65 | -1% | 4% | 0% | -11% | $ 341,354,910.54 |
| MUX | McEwen Mining Inc. | 15.2 | 0% | 27% | 49% | 33% | $ 736,163,029.44 |
| MGA | Mega Uranium Ltd. | 0.375 | -1% | 0% | 9% | 114% | $ 139,359,541.68 |
| MNO | Meridian Mining UK Societas | 0.405 | 1% | 9% | 25% | -21% | $ 124,530,173.82 |
| MSV | Minco Silver Corporation | 0.21 | 0% | 45% | 2% | -16% | $ 13,730,643.68 |
| MSA | Mineros S.A. | 1.16 | 4% | 20% | 97% | 71% | $ 353,690,134.36 |
| STLR | STLLR Gold Inc. | 1.45 | -5% | 29% | -14% | -39% | $ 152,839,383.92 |
| MPVD | Mountain Province Diamonds Inc. | 0.175 | -8% | -31% | -41% | -65% | $ 34,907,332.02 |
| NCU | Nevada Copper Corp. | 0.1 | -9% | -13% | -31% | -73% | $ 135,808,885.33 |
| NGD | New Gold Inc. | 2.35 | -2% | 7% | 60% | 34% | $ 1,606,767,543.32 |
| NUAG | New Pacific Metals Corp. | 2.5 | -8% | 50% | 11% | -28% | $ 429,840,722.84 |
| NGT | Newmont Corporation | 51.58 | -2% | 12% | -2% | -20% | $ 59,272,875,730.46 |
| NXE | NexGen Energy Ltd. | 10.66 | -2% | 1% | 38% | 120% | $ 5,699,897,163.84 |
| NEXT | NextSource Materials Inc. | 0.68 | -6% | -14% | -55% | -68% | $ 109,048,454.90 |
| NCP | Nickel Creek Platinum Corp. | 0.02 | 33% | 33% | 0% | -56% | $ 7,626,929.27 |
| NHK | Nighthawk Gold Corp. | 0 | -100% | -100% | -100% | -100% | $ 38,243,467.92 |
| NB | NioCorp Developments Ltd. | 3.37 | -11% | 2% | -40% | -60% | $ 116,534,316.85 |
| NCF | Northcliff Resources Ltd. | 0.025 | 0% | -17% | 0% | -38% | $ 11,782,240.00 |
| NDM | Northern Dynasty Minerals Ltd. | 0.42 | -10% | -3% | -9% | 38% | $ 215,089,712.40 |
| NG | NovaGold Resources Inc. | 4 | -7% | 10% | -21% | -47% | $ 1,277,298,071.86 |
| NVO | Novo Resources Corp. | 0.15 | -9% | 30% | -6% | -52% | $ 54,967,693.25 |
| NTR | Nutrien Ltd. | 71.42 | 0% | 0% | -8% | -25% | $ 35,457,080,320.01 |
| OGC | OceanaGold Corporation | 3.05 | -8% | 9% | 22% | -3% | $ 2,129,203,075.37 |
| OREA | Orea Mining Corp. | 0 | -100% | -100% | -100% | -100% | $ 3,407,923.62 |
| ORE | Orezone Gold Corporation | 0.81 | -1% | -5% | -5% | -48% | $ 306,316,905.79 |
| OLA | Orla Mining Ltd | 5.47 | 1% | 12% | 14% | -14% | $ 1,663,590,693.60 |
| ORV | Orvana Minerals Corp. | 0.19 | -16% | 19% | 31% | -7% | $ 27,324,634.20 |
| OR | Osisko Gold Royalties Ltd | 21.55 | -1% | 2% | 26% | -1% | $ 3,930,017,789.88 |
| OSK | Osisko Mining Inc. | 3.17 | 7% | 17% | 9% | -19% | $ 1,181,421,648.66 |
| PAAS | Pan American Silver Corp. | 25.42 | -2% | 35% | 22% | 10% | $ 9,073,835,194.94 |
| PPTA | Perpetua Resources Corp. | 8.53 | -1% | 53% | 71% | 38% | $ 555,309,128.96 |
| PRU | Perseus Mining Limited | 1.95 | -2% | 9% | 33% | -6% | $ 2,664,714,074.64 |
| PTM | Platinum Group Metals Ltd. | 1.79 | 2% | 15% | 17% | -23% | $ 190,613,075.28 |
| PRB | Probe Gold Inc. | 1.55 | 1% | 2% | 7% | -7% | $ 263,288,211.34 |
| RTG | RTG Mining Inc. | 0.03 | 0% | 20% | -14% | -40% | $ 33,859,549.95 |
| RUP | Rupert Resources Ltd. | 3.99 | 6% | 15% | 15% | -12% | $ 803,324,326.62 |
| SGLD | Sabre Gold Mines Corp. | 0.17 | -6% | 62% | 42% | -8% | $ 13,540,592.31 |
| SSL | Sandstorm Gold Ltd. | 7.35 | 1% | 9% | 13% | -5% | $ 2,142,095,640.49 |
| SCY | Scandium International Mining Corp. | 0.025 | 0% | 25% | -17% | -58% | $ 8,896,520.33 |
| SEA | Seabridge Gold Inc. | 19.98 | -6% | 11% | 30% | 17% | $ 1,716,717,178.80 |
| SBI | Serabi Gold plc | 1.14 | 6% | 1% | 63% | 119% | $ 86,337,388.14 |
| S | Sherritt International Corporation | 0.33 | 0% | 10% | -22% | -43% | $ 133,091,707.80 |
| SMT | Sierra Metals Inc. | 0.81 | -1% | 13% | 119% | 108% | $ 170,038,461.87 |
| SGNL | Signal Gold Inc. | 0.115 | 5% | 28% | -36% | -66% | $ 28,969,229.45 |
| SBR | Silver Bear Resources plc | 0.05 | 0% | 0% | 0% | 0% | $ 33,916,480.55 |
| SVB | Silver Bull Resources, Inc. | 0.17 | 0% | -8% | 55% | -29% | $ 8,288,989.10 |
| ELEF | Silver Elephant Mining Corp. | 0.325 | -8% | 23% | 2% | -40% | $ 10,673,623.35 |
| SVM | Silvercorp Metals Inc. | 4.84 | -4% | 15% | 53% | -1% | $ 831,591,854.24 |
| SIL | SilverCrest Metals Inc. | 10.69 | 11% | 19% | 55% | 19% | $ 1,514,755,646.50 |
| SKE | Skeena Resources Limited | 6.49 | 0% | 10% | 9% | -26% | $ 553,939,049.93 |
| SLS | Solaris Resources Inc. | 4.53 | -3% | 6% | -19% | -37% | $ 663,587,588.40 |
| SOLG | SolGold plc | 0.155 | -11% | 0% | 0% | -50% | $ 480,177,116.00 |
| SLR | Solitario Resources Corp. | 0.93 | -6% | 16% | 27% | 4% | $ 74,061,812.94 |
| SGQ | SouthGobi Resources Ltd | 0.94 | 11% | 54% | 755% | 292% | $ 268,687,308.89 |
| SSRM | SSR Mining Inc. | 7.33 | 5% | 33% | -63% | -64% | $ 1,437,532,677.84 |
| SAU | St. Augustine Gold and Copper Limited | 0.075 | 0% | 0% | -12% | 36% | $ 75,855,357.53 |
| DIAM | Star Diamond Corporation | 0.08 | -6% | -11% | 0% | -11% | $ 50,963,788.39 |
| SAM | Starcore International Mines Ltd. | 0.09 | -18% | 0% | -31% | -50% | $ 6,858,700.85 |
| STGO | Steppe Gold Ltd. | 0.62 | -9% | -19% | -22% | -42% | $ 63,918,367.80 |
| SMC | Sulliden Mining Capital Inc. | 0.025 | 0% | 0% | -17% | -55% | $ 2,565,519.58 |
| TSK | Talisker Resources Ltd. | 0.54 | -2% | 66% | 77% | -20% | $ 46,704,707.70 |
| TLO | Talon Metals Corp. | 0.15 | 20% | 11% | -38% | -61% | $ 144,881,439.89 |
| TKO | Taseko Mines Limited | 3.25 | -5% | 20% | 123% | 44% | $ 947,701,328.54 |
| TI | Titan Mining Corporation | 0.35 | -1% | 17% | -25% | -33% | $ 46,364,643.66 |
| TXG | Torex Gold Resources Inc. | 19.6 | 1% | 8% | 43% | -12% | $ 1,683,264,835.56 |
| TML | Treasury Metals Inc. | 0.2 | -5% | 25% | 43% | -35% | $ 40,220,343.48 |
| TMQ | Trilogy Metals Inc. | 0.54 | -23% | -19% | -14% | -31% | $ 91,268,557.89 |
| TFPM | Triple Flag Precious Metals Corp. | 21.52 | 1% | 17% | 24% | -2% | $ 4,160,156,134.78 |
| TLG | Troilus Gold Corp. | 0.65 | -7% | 25% | 65% | -11% | $ 180,448,999.90 |
| TRX | TRX Gold Corporation | 0.61 | -5% | 17% | 7% | -15% | $ 175,719,505.50 |
| URE | Ur-Energy Inc. | 2.34 | 1% | 9% | 9% | 97% | $ 642,108,018.72 |
| NPK | Verde Agritech Ltd. | 0.87 | -7% | -27% | -38% | -63% | $ 45,295,962.64 |
| VGCX | Victoria Gold Corp. | 6.97 | 4% | 15% | 18% | -30% | $ 461,787,997.00 |
| VGZ | Vista Gold Corp. | 0.69 | -9% | 3% | 33% | -15% | $ 83,551,060.86 |
| WM | Wallbridge Mining Company Limited | 0.1 | 5% | 33% | -5% | -39% | $ 106,706,201.49 |
| WDO | Wesdome Gold Mines Ltd. | 10.62 | 0% | 11% | 36% | 28% | $ 1,536,496,175.80 |
| WRN | Western Copper and Gold Corporation | 1.95 | 1% | -5% | 15% | -16% | $ 336,089,513.97 |
| WRX | Western Resources Corp. | 0.13 | 0% | 0% | -10% | -54% | $ 53,159,012.14 |
| WPM | Wheaton Precious Metals Corp. | 71.66 | 1% | 17% | 20% | 8% | $ 31,998,141,980.61 |
| XAM | Xanadu Mines Ltd | 7 | -3% | 11% | 4% | 52% | $ 118,404,414.62 |
| XTG | Xtra-Gold Resources Corp. | 1.21 | 0% | 1% | 34% | 33% | $ 55,803,889.57 |
| YRB | Yorbeau Resources Inc. | 0.035 | -13% | -22% | -22% | -30% | $ 15,455,591.55 |
| AII | Almonty Industries Inc. | 0.62 | 5% | 0% | 19% | -5% | $ 153,940,879.78 |
| TECK.B | Teck Resources Limited - Teck Res Cl B SV | 62.2 | -4% | 5% | 17% | 0% | $ 32,073,812,258.56 |
| TECK.A | Teck Resources Limited - Teck Res Cl A MV | 62.13 | -4% | 5% | 16% | -38% | $ 479,811,798.76 |
| FOM | Foran Mining Corporation | 4.02 | -2% | -2% | -2% | 1% | $ 1,255,249,406.91 |
| PRYM | Prime Mining Corp. | 2.27 | 0% | 4% | 52% | -6% | $ 332,026,861.50 |
| GMIN | G Mining Ventures Corp. | 2.15 | -6% | 12% | 89% | 115% | $ 913,013,432.16 |
TSXV
| CODE | COMPANY | PRICE | WEEK RETURN % | MONTH RETURN % | 6 MONTH RETURN % | YEAR RETURN % | MARKET CAP |
|---|---|---|---|---|---|---|---|
| ARA | Aclara Resources Inc. | 0.485 | -3% | 9% | 20% | 13% | $ 78,389,490.72 |
| AEM | Agnico Eagle Mines Limited | 85.96 | 1% | 13% | 27% | 13% | $ 42,530,937,321.70 |
| AGI | Alamos Gold Inc. | 20.64 | 0% | 12% | 17% | 19% | $ 8,049,589,281.79 |
| AMM | Almaden Minerals Ltd. | 0.155 | -9% | -16% | -14% | -30% | $ 23,327,639.36 |
| ALS | Altius Minerals Corporation | 20.99 | -2% | 2% | 3% | -3% | $ 979,652,812.30 |
| USA | Americas Gold and Silver Corporation | 0.365 | 0% | 26% | -22% | -49% | $ 91,622,274.45 |
| ARG | Amerigo Resources Ltd. | 1.71 | -1% | 16% | 53% | -1% | $ 282,809,085.30 |
| AR | Argonaut Gold Inc. | 0.41 | 1% | 34% | -21% | -31% | $ 507,633,382.40 |
| AAUC | Allied Gold Corporation | 3.73 | -3% | 17% | -7% | 0% | $ 905,114,553.33 |
| ARIS | Aris Mining Corporation | 5.43 | 11% | 22% | 62% | 37% | $ 785,374,765.40 |
| AMC | Arizona Metals Corp. | 2.22 | 5% | 19% | -22% | -47% | $ 251,810,714.68 |
| ASCU | Arizona Sonoran Copper Company Inc. | 1.34 | -7% | 0% | -14% | -32% | $ 149,643,449.15 |
| ASND | Ascendant Resources Inc. | 0.06 | -14% | 9% | -37% | -73% | $ 10,800,980.64 |
| AOT | Ascot Resources Ltd. | 0.77 | -4% | 8% | 103% | 26% | $ 480,367,954.99 |
| G | Augusta Gold Corp. | 0.97 | -15% | -1% | 24% | -27% | $ 88,507,645.59 |
| ORA | Aura Minerals Inc. | 10.43 | -6% | 7% | 17% | -5% | $ 775,103,042.19 |
| AVL | Avalon Advanced Materials Inc. | 0.075 | 0% | -12% | -35% | -35% | $ 45,186,965.92 |
| ASM | Avino Silver & Gold Mines Ltd. | 0.97 | -6% | 26% | 47% | -18% | $ 124,801,275.84 |
| AYA | Aya Gold & Silver Inc. | 13.83 | 4% | 13% | 87% | 30% | $ 1,746,525,878.29 |
| BTO | B2Gold Corp. | 3.5 | -4% | 3% | -23% | -37% | $ 4,520,891,401.56 |
| ABX | Barrick Gold Corporation | 22.8 | 0% | 8% | 1% | -12% | $ 39,519,368,633.51 |
| BSX | Belo Sun Mining Corp. | 0.045 | 0% | 0% | -25% | -36% | $ 20,477,486.16 |
| BKI | Black Iron Inc. | 0.05 | 0% | 0% | -9% | -29% | $ 16,726,624.09 |
| CXB | Calibre Mining Corp. | 1.86 | 4% | 14% | 27% | 20% | $ 1,429,997,399.74 |
| CCO | Cameco Corporation | 66.48 | 0% | 13% | 27% | 93% | $ 28,140,874,787.12 |
| CCM | Canagold Resources Ltd. | 0.24 | 4% | 9% | 9% | -6% | $ 41,661,454.56 |
| ATCU | Alta Copper Corp. | 0.485 | 5% | 9% | 37% | -16% | $ 41,253,256.80 |
| CS | Capstone Copper Corp. | 8.97 | -6% | 14% | 89% | 35% | $ 6,938,860,740.75 |
| CEE | Centamin plc | 2.1 | -4% | 14% | 57% | 22% | $ 2,455,877,313.40 |
| CG | Centerra Gold Inc. | 8.65 | 5% | 12% | 23% | -10% | $ 1,783,364,584.90 |
| CNT | Century Global Commodities Corporation | 0.03 | 0% | -40% | 0% | -71% | $ 4,137,191.98 |
| CIA | Champion Iron Limited | 5.97 | 3% | -6% | 11% | -3% | $ 3,072,162,370.18 |
| CGG | China Gold International Resources Corp. Ltd. | 8.08 | -5% | -3% | 40% | 19% | $ 3,290,234,149.90 |
| COG | Condor Gold plc | 0.49 | -6% | 23% | 51% | -8% | $ 101,935,817.52 |
| DML | Denison Mines Corp. | 2.72 | -3% | 3% | 31% | 99% | $ 2,453,122,652.75 |
| DSV | Discovery Silver Corp. | 0.95 | 4% | 38% | 48% | -17% | $ 368,874,934.95 |
| DPM | Dundee Precious Metals Inc. | 10.57 | 0% | 8% | 21% | 4% | $ 1,886,718,870.40 |
| DNG | Dynacor Group Inc. | 5.09 | 6% | 27% | 57% | 66% | $ 186,634,349.16 |
| ELR | Eastern Platinum Limited | 0.165 | 10% | 74% | 94% | 27% | $ 29,275,706.77 |
| ECOR | Ecora Resources plc | 1.42 | -3% | 8% | -11% | -38% | $ 367,951,013.43 |
| ELD | Eldorado Gold Corporation | 19.72 | -5% | 8% | 41% | 36% | $ 3,995,652,272.07 |
| ELO | Eloro Resources Ltd. | 1.75 | 17% | 37% | -8% | -52% | $ 122,175,877.95 |
| EDV | Endeavour Mining plc | 28.86 | -1% | 15% | -1% | -18% | $ 6,958,743,731.94 |
| EDR | Endeavour Silver Corp. | 3.7 | 5% | 24% | 14% | -32% | $ 843,584,547.78 |
| EFR | Energy Fuels Inc. | 7.17 | -11% | -15% | -33% | 5% | $ 1,169,224,660.75 |
| ETG | Entree Resources Ltd. | 1.59 | 0% | 17% | 24% | 16% | $ 323,318,476.86 |
| EQX | Equinox Gold Corp. | 7.82 | -3% | 7% | 25% | 15% | $ 2,559,272,405.20 |
| ERD | Erdene Resource Development Corporation | 0.4 | 4% | 3% | 21% | 4% | $ 138,135,270.40 |
| ERO | Ero Copper Corp. | 26.27 | -5% | 3% | 41% | 0% | $ 2,733,667,210.40 |
| ESM | Euro Sun Mining Inc. | 0.055 | -8% | 38% | 22% | 22% | $ 19,088,819.88 |
| EXN | Excellon Resources Inc. | 0.175 | -8% | -3% | 67% | -55% | $ 16,438,116.09 |
| MIN | Excelsior Mining Corp. | 0.195 | 3% | 56% | 44% | -24% | $ 61,506,092.31 |
| FDY | Faraday Copper Corp. | 0.73 | 11% | 18% | 16% | -33% | $ 135,970,892.75 |
| FIL | Filo Corp | 24.48 | 5% | 7% | 35% | 4% | $ 3,227,801,893.23 |
| FR | First Majestic Silver Corp. | 9.31 | -1% | 28% | 24% | -4% | $ 2,585,215,665.00 |
| FF | First Mining Gold Corp. | 0.14 | -13% | 17% | 12% | -24% | $ 137,764,310.25 |
| FM | First Quantum Minerals Ltd. | 15.52 | 0% | 14% | -47% | -51% | $ 13,278,151,601.82 |
| FCU | Fission Uranium Corp. | 1.08 | 0% | 7% | 26% | 93% | $ 876,245,258.70 |
| FSY | Forsys Metals Corp. | 0.89 | -4% | -9% | 35% | 102% | $ 171,749,130.96 |
| FVI | Fortuna Silver Mines Inc. | 6.37 | 1% | 38% | 57% | 28% | $ 1,874,210,959.07 |
| FT | Fortune Minerals Limited | 0.035 | -13% | 0% | -13% | -30% | $ 17,487,535.17 |
| FNV | Franco-Nevada Corporation | 163.08 | 1% | 5% | -14% | -21% | $ 31,153,811,274.00 |
| FVL | Freegold Ventures Limited | 0.455 | -9% | 14% | 17% | -3% | $ 207,696,444.77 |
| FURY | Fury Gold Mines Limited | 0.68 | -4% | 24% | 46% | -12% | $ 99,332,430.04 |
| GAU | Galiano Gold Inc. | 2.04 | 3% | 27% | 162% | 139% | $ 499,677,604.38 |
| GATO | Gatos Silver, Inc. | 13.84 | 4% | 27% | 103% | 63% | $ 888,284,643.48 |
| GENM | Generation Mining Limited | 0.255 | -2% | -6% | -14% | -57% | $ 59,013,352.00 |
| GLO | Global Atomic Corporation | 1.88 | -12% | -21% | -11% | -28% | $ 383,589,707.46 |
| GMX | Globex Mining Enterprises Inc. | 1 | 5% | 16% | 25% | 23% | $ 55,231,836.00 |
| GGD | GoGold Resources Inc. | 1.33 | -5% | 15% | -1% | -27% | $ 423,909,891.51 |
| GMTN | Gold Mountain Mining Corp. | 0.035 | 0% | 75% | -61% | -83% | $ 27,471,805.84 |
| GRC | Gold Springs Resource Corp. | 0.055 | -31% | -27% | -31% | -50% | $ 22,510,412.64 |
| AUMN | Golden Minerals Company | 0.79 | -16% | 103% | -74% | -90% | $ 11,074,860.60 |
| GGA | Goldgroup Mining Inc. | 0 | -100% | -100% | -100% | -100% | $ 2,482,294.68 |
| GOLD | Goldmining Inc. | 1.13 | -3% | -1% | 8% | -21% | $ 205,477,486.83 |
| HZM | Horizonte Minerals Plc. | 0.01 | 100% | -85% | -97% | -100% | $ 2,697,789.06 |
| HBM | HudBay Minerals Inc. | 10.55 | 1% | 13% | 80% | 53% | $ 3,688,990,325.28 |
| IAU | i-80 Gold Corp. | 1.67 | -3% | -5% | -20% | -50% | $ 480,956,056.00 |
| IMG | Iamgold Corporation | 5.05 | 3% | 25% | 55% | 31% | $ 2,378,876,931.85 |
| III | Imperial Metals Corporation | 2.47 | 1% | 14% | 17% | 39% | $ 385,253,791.58 |
| ITH | International Tower Hill Mines Ltd. | 0.84 | -3% | 4% | 45% | 18% | $ 175,730,228.96 |
| IE | Ivanhoe Electric Inc. | 13.25 | -5% | 10% | -12% | -14% | $ 1,596,466,113.78 |
| IVN | Ivanhoe Mines Ltd. | 18.14 | -4% | 13% | 73% | 51% | $ 24,161,502,946.02 |
| JAG | Jaguar Mining Inc. | 2.9 | -3% | 24% | 110% | 15% | $ 221,386,662.00 |
| KNT | K92 Mining Inc. | 7.46 | -1% | 21% | 32% | 8% | $ 1,719,926,871.08 |
| KRN | Karnalyte Resources Inc. | 0.18 | -3% | 13% | -25% | -27% | $ 9,857,536.67 |
| KRR | Karora Resources Inc. | 5.57 | 8% | 22% | 35% | 23% | $ 983,763,901.93 |
| K | Kinross Gold Corporation | 8.97 | 3% | 17% | 22% | 33% | $ 10,915,479,588.86 |
| LIF | Labrador Iron Ore Royalty Corporation | 29.89 | 1% | 2% | -1% | -4% | $ 1,927,040,000.00 |
| LAM | Laramide Resources Ltd. | 0.69 | -3% | -1% | 13% | 92% | $ 174,201,787.20 |
| LGO | Largo Inc. | 2.03 | 4% | -6% | -45% | -69% | $ 128,102,724.00 |
| LGD | Liberty Gold Corp. | 0.35 | 9% | 27% | 25% | -38% | $ 117,334,521.22 |
| LAAC | Lithium Americas (Argentina) Corp. | 6.9 | -1% | 1% | -12% | -73% | $ 1,072,354,495.96 |
| LIRC | Lithium Royalty Corp. | 6.8 | -3% | -4% | -31% | -56% | $ 172,817,421.20 |
| LN | Loncor Gold Inc. | 0.375 | 1% | 0% | 12% | 1% | $ 55,374,902.64 |
| LUC | Lucara Diamond Corp. | 0.31 | 0% | -6% | -16% | -35% | $ 139,713,604.87 |
| LUG | Lundin Gold Inc. | 19 | 1% | 4% | 6% | 12% | $ 4,516,132,548.41 |
| LUN | Lundin Mining Corporation | 15.25 | 0% | 15% | 77% | 49% | $ 12,227,769,541.89 |
| MAG | MAG Silver Corp. | 16.62 | 2% | 33% | 12% | -4% | $ 1,674,447,564.30 |
| MND | Mandalay Resources Corporation | 2.39 | 7% | 63% | 54% | -4% | $ 219,300,463.00 |
| MOZ | Marathon Gold Corporation | 0 | -100% | -100% | -100% | -100% | $ 380,022,058.35 |
| MARI | Marimaca Copper Corp. | 3.65 | -1% | 4% | 0% | -11% | $ 341,354,910.54 |
| MUX | McEwen Mining Inc. | 15.2 | 0% | 27% | 49% | 33% | $ 736,163,029.44 |
| MGA | Mega Uranium Ltd. | 0.375 | -1% | 0% | 9% | 114% | $ 139,359,541.68 |
| MNO | Meridian Mining UK Societas | 0.405 | 1% | 9% | 25% | -21% | $ 124,530,173.82 |
| MSV | Minco Silver Corporation | 0.21 | 0% | 45% | 2% | -16% | $ 13,730,643.68 |
| MSA | Mineros S.A. | 1.16 | 4% | 20% | 97% | 71% | $ 353,690,134.36 |
| STLR | STLLR Gold Inc. | 1.45 | -5% | 29% | -14% | -39% | $ 152,839,383.92 |
| MPVD | Mountain Province Diamonds Inc. | 0.175 | -8% | -31% | -41% | -65% | $ 34,907,332.02 |
| NCU | Nevada Copper Corp. | 0.1 | -9% | -13% | -31% | -73% | $ 135,808,885.33 |
| NGD | New Gold Inc. | 2.35 | -2% | 7% | 60% | 34% | $ 1,606,767,543.32 |
| NUAG | New Pacific Metals Corp. | 2.5 | -8% | 50% | 11% | -28% | $ 429,840,722.84 |
| NGT | Newmont Corporation | 51.58 | -2% | 12% | -2% | -20% | $ 59,272,875,730.46 |
| NXE | NexGen Energy Ltd. | 10.66 | -2% | 1% | 38% | 120% | $ 5,699,897,163.84 |
| NEXT | NextSource Materials Inc. | 0.68 | -6% | -14% | -55% | -68% | $ 109,048,454.90 |
| NCP | Nickel Creek Platinum Corp. | 0.02 | 33% | 33% | 0% | -56% | $ 7,626,929.27 |
| NHK | Nighthawk Gold Corp. | 0 | -100% | -100% | -100% | -100% | $ 38,243,467.92 |
| NB | NioCorp Developments Ltd. | 3.37 | -11% | 2% | -40% | -60% | $ 116,534,316.85 |
| NCF | Northcliff Resources Ltd. | 0.025 | 0% | -17% | 0% | -38% | $ 11,782,240.00 |
| NDM | Northern Dynasty Minerals Ltd. | 0.42 | -10% | -3% | -9% | 38% | $ 215,089,712.40 |
| NG | NovaGold Resources Inc. | 4 | -7% | 10% | -21% | -47% | $ 1,277,298,071.86 |
| NVO | Novo Resources Corp. | 0.15 | -9% | 30% | -6% | -52% | $ 54,967,693.25 |
| NTR | Nutrien Ltd. | 71.42 | 0% | 0% | -8% | -25% | $ 35,457,080,320.01 |
| OGC | OceanaGold Corporation | 3.05 | -8% | 9% | 22% | -3% | $ 2,129,203,075.37 |
| OREA | Orea Mining Corp. | 0 | -100% | -100% | -100% | -100% | $ 3,407,923.62 |
| ORE | Orezone Gold Corporation | 0.81 | -1% | -5% | -5% | -48% | $ 306,316,905.79 |
| OLA | Orla Mining Ltd | 5.47 | 1% | 12% | 14% | -14% | $ 1,663,590,693.60 |
| ORV | Orvana Minerals Corp. | 0.19 | -16% | 19% | 31% | -7% | $ 27,324,634.20 |
| OR | Osisko Gold Royalties Ltd | 21.55 | -1% | 2% | 26% | -1% | $ 3,930,017,789.88 |
| OSK | Osisko Mining Inc. | 3.17 | 7% | 17% | 9% | -19% | $ 1,181,421,648.66 |
| PAAS | Pan American Silver Corp. | 25.42 | -2% | 35% | 22% | 10% | $ 9,073,835,194.94 |
| PPTA | Perpetua Resources Corp. | 8.53 | -1% | 53% | 71% | 38% | $ 555,309,128.96 |
| PRU | Perseus Mining Limited | 1.95 | -2% | 9% | 33% | -6% | $ 2,664,714,074.64 |
| PTM | Platinum Group Metals Ltd. | 1.79 | 2% | 15% | 17% | -23% | $ 190,613,075.28 |
| PRB | Probe Gold Inc. | 1.55 | 1% | 2% | 7% | -7% | $ 263,288,211.34 |
| RTG | RTG Mining Inc. | 0.03 | 0% | 20% | -14% | -40% | $ 33,859,549.95 |
| RUP | Rupert Resources Ltd. | 3.99 | 6% | 15% | 15% | -12% | $ 803,324,326.62 |
| SGLD | Sabre Gold Mines Corp. | 0.17 | -6% | 62% | 42% | -8% | $ 13,540,592.31 |
| SSL | Sandstorm Gold Ltd. | 7.35 | 1% | 9% | 13% | -5% | $ 2,142,095,640.49 |
| SCY | Scandium International Mining Corp. | 0.025 | 0% | 25% | -17% | -58% | $ 8,896,520.33 |
| SEA | Seabridge Gold Inc. | 19.98 | -6% | 11% | 30% | 17% | $ 1,716,717,178.80 |
| SBI | Serabi Gold plc | 1.14 | 6% | 1% | 63% | 119% | $ 86,337,388.14 |
| S | Sherritt International Corporation | 0.33 | 0% | 10% | -22% | -43% | $ 133,091,707.80 |
| SMT | Sierra Metals Inc. | 0.81 | -1% | 13% | 119% | 108% | $ 170,038,461.87 |
| SGNL | Signal Gold Inc. | 0.115 | 5% | 28% | -36% | -66% | $ 28,969,229.45 |
| SBR | Silver Bear Resources plc | 0.05 | 0% | 0% | 0% | 0% | $ 33,916,480.55 |
| SVB | Silver Bull Resources, Inc. | 0.17 | 0% | -8% | 55% | -29% | $ 8,288,989.10 |
| ELEF | Silver Elephant Mining Corp. | 0.325 | -8% | 23% | 2% | -40% | $ 10,673,623.35 |
| SVM | Silvercorp Metals Inc. | 4.84 | -4% | 15% | 53% | -1% | $ 831,591,854.24 |
| SIL | SilverCrest Metals Inc. | 10.69 | 11% | 19% | 55% | 19% | $ 1,514,755,646.50 |
| SKE | Skeena Resources Limited | 6.49 | 0% | 10% | 9% | -26% | $ 553,939,049.93 |
| SLS | Solaris Resources Inc. | 4.53 | -3% | 6% | -19% | -37% | $ 663,587,588.40 |
| SOLG | SolGold plc | 0.155 | -11% | 0% | 0% | -50% | $ 480,177,116.00 |
| SLR | Solitario Resources Corp. | 0.93 | -6% | 16% | 27% | 4% | $ 74,061,812.94 |
| SGQ | SouthGobi Resources Ltd | 0.94 | 11% | 54% | 755% | 292% | $ 268,687,308.89 |
| SSRM | SSR Mining Inc. | 7.33 | 5% | 33% | -63% | -64% | $ 1,437,532,677.84 |
| SAU | St. Augustine Gold and Copper Limited | 0.075 | 0% | 0% | -12% | 36% | $ 75,855,357.53 |
| DIAM | Star Diamond Corporation | 0.08 | -6% | -11% | 0% | -11% | $ 50,963,788.39 |
| SAM | Starcore International Mines Ltd. | 0.09 | -18% | 0% | -31% | -50% | $ 6,858,700.85 |
| STGO | Steppe Gold Ltd. | 0.62 | -9% | -19% | -22% | -42% | $ 63,918,367.80 |
| SMC | Sulliden Mining Capital Inc. | 0.025 | 0% | 0% | -17% | -55% | $ 2,565,519.58 |
| TSK | Talisker Resources Ltd. | 0.54 | -2% | 66% | 77% | -20% | $ 46,704,707.70 |
| TLO | Talon Metals Corp. | 0.15 | 20% | 11% | -38% | -61% | $ 144,881,439.89 |
| TKO | Taseko Mines Limited | 3.25 | -5% | 20% | 123% | 44% | $ 947,701,328.54 |
| TI | Titan Mining Corporation | 0.35 | -1% | 17% | -25% | -33% | $ 46,364,643.66 |
| TXG | Torex Gold Resources Inc. | 19.6 | 1% | 8% | 43% | -12% | $ 1,683,264,835.56 |
| TML | Treasury Metals Inc. | 0.2 | -5% | 25% | 43% | -35% | $ 40,220,343.48 |
| TMQ | Trilogy Metals Inc. | 0.54 | -23% | -19% | -14% | -31% | $ 91,268,557.89 |
| TFPM | Triple Flag Precious Metals Corp. | 21.52 | 1% | 17% | 24% | -2% | $ 4,160,156,134.78 |
| TLG | Troilus Gold Corp. | 0.65 | -7% | 25% | 65% | -11% | $ 180,448,999.90 |
| TRX | TRX Gold Corporation | 0.61 | -5% | 17% | 7% | -15% | $ 175,719,505.50 |
| URE | Ur-Energy Inc. | 2.34 | 1% | 9% | 9% | 97% | $ 642,108,018.72 |
| NPK | Verde Agritech Ltd. | 0.87 | -7% | -27% | -38% | -63% | $ 45,295,962.64 |
| VGCX | Victoria Gold Corp. | 6.97 | 4% | 15% | 18% | -30% | $ 461,787,997.00 |
| VGZ | Vista Gold Corp. | 0.69 | -9% | 3% | 33% | -15% | $ 83,551,060.86 |
| WM | Wallbridge Mining Company Limited | 0.1 | 5% | 33% | -5% | -39% | $ 106,706,201.49 |
| WDO | Wesdome Gold Mines Ltd. | 10.62 | 0% | 11% | 36% | 28% | $ 1,536,496,175.80 |
| WRN | Western Copper and Gold Corporation | 1.95 | 1% | -5% | 15% | -16% | $ 336,089,513.97 |
| WRX | Western Resources Corp. | 0.13 | 0% | 0% | -10% | -54% | $ 53,159,012.14 |
| WPM | Wheaton Precious Metals Corp. | 71.66 | 1% | 17% | 20% | 8% | $ 31,998,141,980.61 |
| XAM | Xanadu Mines Ltd | 7 | -3% | 11% | 4% | 52% | $ 118,404,414.62 |
| XTG | Xtra-Gold Resources Corp. | 1.21 | 0% | 1% | 34% | 33% | $ 55,803,889.57 |
| YRB | Yorbeau Resources Inc. | 0.035 | -13% | -22% | -22% | -30% | $ 15,455,591.55 |
| AII | Almonty Industries Inc. | 0.62 | 5% | 0% | 19% | -5% | $ 153,940,879.78 |
| TECK.B | Teck Resources Limited - Teck Res Cl B SV | 62.2 | -4% | 5% | 17% | 0% | $ 32,073,812,258.56 |
| TECK.A | Teck Resources Limited - Teck Res Cl A MV | 62.13 | -4% | 5% | 16% | -38% | $ 479,811,798.76 |
| FOM | Foran Mining Corporation | 4.02 | -2% | -2% | -2% | 1% | $ 1,255,249,406.91 |
| PRYM | Prime Mining Corp. | 2.27 | 0% | 4% | 52% | -6% | $ 332,026,861.50 |
| GMIN | G Mining Ventures Corp. | 2.15 | -6% | 12% | 89% | 115% | $ 913,013,432.16 |

Related Stories

UNLOCK INSIGHTS
Discover the untold stories of emerging ASX stocks.
Daily news and expert analysis, it's free to subscribe.
By proceeding, you confirm you understand that we handle personal information in accordance with our Privacy Policy.


