Canada Unearthed: The men who made Yamana are back targeting Africa’s golden riches
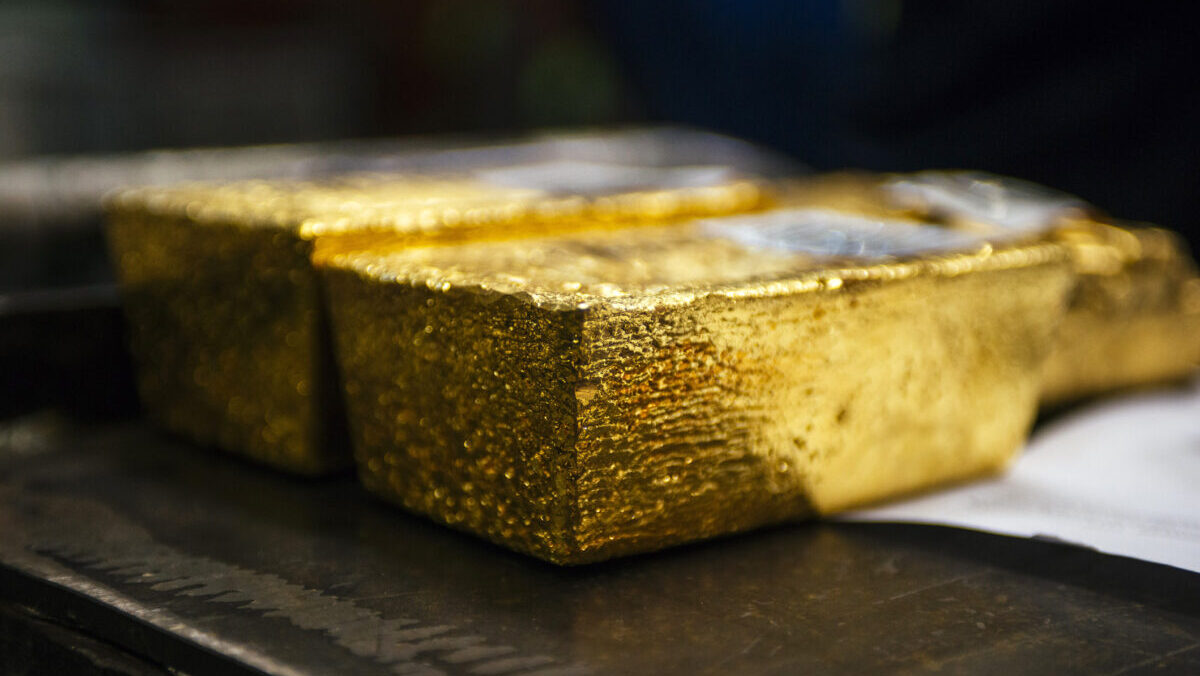
Pic: Waldo Swiegers/Bloomberg via Getty Images
- Yamana Gold’s former top brass have endured a tough start to life at the helm of African gold miner Allied Gold
- The Toronto listed producer is looking to expand beyond West Africa with the US$500 million development of the Kurmuk project in Ethiopia
- B2Gold faces impact of new mining code on Mali expansion
Few companies have engineered a turnaround quite like the former Yamana Gold.
Launched onto the TSX in the mid-1990s, the miner was treading water 20 years ago after an ill-fated silver development.
Then it picked up a famous garimpeiro gold reserve in Brazil’s Carajas region and Peter Marrone came in as the president and CEO.
It quickly turned from a C$200 million tiddler to a multi-billion dollar player, exiting the market this year with a split US$4.8 billion deal to sell off the business’ assets to Agnico Eagle (TSX:AEM) and Pan American Silver (TSX:PAAS) after battle for control between the TSX players and South Africa’s Gold Fields and a history of returns to shareholders.
Having built up an enviable base of gold and silver mines in Canada and South America, Marrone’s latest play has a different flavour.
In September the former Yamana exec chair and the other principals of the former gold major took privately owned Allied Gold (TSX:AAUC) public in Toronto.
They just released their first set of quarterlies giving the market a taste of the growth plans to come from a portfolio of Pan African assets stretching from the familiar West African gold region to Ethiopia in the east.
It’s a portfolio Marrone thinks can push from an initial level of 350,000-360,000oz on an annual basis to over 800,000oz by the end of the decade.
Chasing growth in West Africa
Allied is down around 25% since its listing in September. But Marrone and Co. have highlighted an approved growth profile backed by a commitment to drilling and a transition from cheap oxide production at their mainstay Sadiola mine in Mali to fresh rock as it expands.
A first phase expansion will modify the processing plant to take in an increased amount of fresh ore, with a phase 2 expansion to build a new mill entirely dedicated to processing fresh rock.
Until that point though, Allied wants as much cheap oxide ore as it can to keep costs low and bolster cash flows.
To do that the miner has picked up the small scale Diba project 15km from Sadiola off Elemental Altus Royalties Corp (TSX-V:ELE). That will lift the asset’s production rate from 175,000-180,000oz in 2023 to over 230,000ozpa in 2024 and 2025, providing more ammunition to fund the development of the Kurmuk project in Ethiopia.
“Moving into 2024-2025, we’re gearing up for an increase in production driven by additional oxide ore sources and the Sadiola Phase 1 expansion with better grades, more oxide ore, lower costs,” Marrone told analysts on a conference call last week.
“This will enhance our EBITDA and cash flow. More detailed insights will follow once our inaugural budget process, which is in progress now, is completed and guidance is issued early next year.
“Kurmuk, as I mentioned, will materially increase production over the intermediate term, surpassing 600,000 ounces on an annualised basis from 2026 onward and looking further into the horizon, then the Sadiola Phase Two will take that production platform at least to 700,000 ounces per year and likely exceeding 800,000 ounces per year.”
Allied’s plan is to get all in sustaining costs below US$1000/oz, but it has a way to go to get there, producing 84,473oz of gold and selling 91,164oz at an all in sustaining cost of US$1546/oz in the September quarter. Allied absorbed a net loss of US$194.6m in the quarter, heavily impacted by transactions costs and exploration write offs.
The firm expects to lift output to over 100,000oz in the fourth quarter however, with its mines expected to deliver 375,000ozpa until those growth initiatives really kick off. Its board has already approved the US$500m Kurmuk development, which will eventually churn out 240,000ozpa over a decade at US$950/oz from its first gold pour in the June quarter of 2026.
US$61.6m has been committed to the first phase of the Sadiola expansion, with US$12m approved for the development of the Diba satellite pit.
Sadiola will ramp up from 230,000ozpa after its initial fresh rock expansion to 400,000ozpa for the first four years of its Phase 2 expansion and 300,000ozpa over a 19-year mine life.
Sadiola (ex-IAMGOLD and AngloGold Ashanti) produced 43,525oz in the September quarter, while the Bonikro mine (former Newmont) in Cote d’Ivoire was a strong performer, delivering 23,628oz at US$1220/oz. The Agbaou mine, also in Cote d’Ivoire and once owned by Endeavour Mining (TSX:EDV), produced 17,320oz at US$2051/oz.
Gold is currently fetching in the order of US$1940/oz.
Opened in 1996, the Sadiola gold field has produced 10Moz, while Bonikro and Agbaou sit in a 32km greenstone belt where around 5Moz has been found and mined historically.
But Australian exploration director Greg Winch said there was plenty more to be drilled.
“During Q3 we drilled circa 50,000m of drilling, which is a large number but is typical for the group to be drilling with 13 rigs, 24 hours a day for a quarter,” he said.
“That’s borne out by 128,000m we’ve already drilled.”
At 2.6Moz Kurmuk — “a brand new gold province” — Winch said there was as much as 1500km2 of exploration land surrounding the main 100km2 mining licence.
I prepared this one for you earlier
If Canadian investors want a sense of how Africa can deliver for gold miners, look no further than B2Gold (TSX:BTO).
BTO is trading at less than half its 2020 highs, an all time bull run in gold equities more generally.
But the C$5.4 billion miner is still up 78% since its founding in 2007.
It produced 242,838oz at an AISC of US$1272/oz in the September quarter, with gold production forecast to be between 1-1.08Moz in 2023 at the low end of guidance of US$1195-1255/oz. So far this year that key metric is tracking below guidance at US$1182/oz, with BTO also tipping a C$0.04 per share dividend in the direction of shareholders as well.
The flagship Fekola mine in Mali is expected to produce at the lower end of its 580,000-610,000oz guidance range for 2023, having sold 460,139oz at US$1125/oz so far this year.
B2 also owns the 170,000-190,000oz Masbate mine in the Philippines and 190,000-210,000oz Otjikoto mine in Namibia, and is planning to start production from the C$890m Goose project in the Back River gold district of Canada’s Nunavut province in 2025.
Its golden goose of course remains Fekola, though there are concerns around how the new Mining Code in Junta-led Mali, designed to capture more of the benefits from mining operations for the State, will impact its planned regional expansions.
“Receipt of an exploitation licence for the Bantako North permit area remains outstanding pending finalisation of an implementation decree for the new 2023 Mining Code by the State of Mali,” B2 said last week.
“As a result, no production is forecast from Fekola Regional in 2023 (budgeted production was 18,000 ounces).”
It does not expect the new mining code to impact the existing Fekola convention, which was signed under the old 2012 Mining Code.
B2Gold boss Clive Johnson told analysts “everyone knows that Mali is looking for increased revenue”, especially related to expansion areas to the north of Fekola.
But he said the Malian Government “should be highly motivated to get permits in our hands and get mining as soon as possible.”
Mali was subject to military coups in 2020 and 2021, eight and nine years respectively after the ousting in a separate coup of Amadou Toumani Toure.
While the Malian Government currently has the right to take stakes of up to 20% in local projects, the 2023 code ups the ante, with the State able to take 10% with an option to acquire another 20% during the first two years of commercial production.
Another 5% can be ceded to private local interests, with some tax exemptions also out the door.
TSX and TSX.V Winners & Losers
Here’s how TSX and TSX.V-listed mining and exploration stocks performed last week:
Scroll or swipe to reveal table. Click headings to sort. Best viewed on a laptop.
Stocks missing from this list? Email [email protected]
| CODE | COMPANY | PRICE | WEEK RETURN % | MONTH RETURN % | 6 MONTH RETURN % | YEAR RETURN % | MARKET CAP |
|---|---|---|---|---|---|---|---|
| ARA | Aclara Resources Inc. | 0.41 | 1% | -5% | -10% | 46% | $ 66,921,502.57 |
| AEM | Agnico Eagle Mines Limited | 64.9 | -4% | 2% | -18% | 2% | $ 32,207,686,504.40 |
| AGI | Alamos Gold Inc. | 17.63 | -4% | 10% | -3% | 49% | $ 6,987,080,945.22 |
| AKE | Allkem Limited | 7.84 | -9% | -21% | -41% | -46% | $ 4,998,200,594.24 |
| AMM | Almaden Minerals Ltd. | 0.195 | -3% | 3% | 22% | -44% | $ 26,758,174.56 |
| ALS | Altius Minerals Corporation | 19.05 | -4% | -9% | -11% | -10% | $ 899,691,552.15 |
| USA | Americas Gold and Silver Corporation | 0.34 | -6% | -28% | -51% | -54% | $ 73,806,397.94 |
| ARG | Amerigo Resources Ltd. | 1.22 | -2% | -4% | -21% | 1% | $ 201,092,315.74 |
| AR | Argonaut Gold Inc. | 0.455 | -14% | -16% | -25% | 10% | $ 393,479,095.56 |
| AAUC | Allied Gold Corporation | 3.95 | -7% | -6% | 0% | 0% | $ 990,360,799.35 |
| ARIS | Aris Mining Corporation | 3.35 | -8% | 3% | -15% | 4% | $ 459,617,480.80 |
| AMC | Arizona Metals Corp. | 2.17 | -10% | -27% | -45% | -47% | $ 251,810,714.68 |
| ASCU | Arizona Sonoran Copper Company Inc. | 1.33 | -9% | -17% | -22% | -22% | $ 145,059,556.88 |
| ASND | Ascendant Resources Inc. | 0.095 | -5% | 6% | -58% | -27% | $ 12,570,856.38 |
| AOT | Ascot Resources Ltd. | 0.415 | -3% | 19% | -37% | -9% | $ 236,277,624.60 |
| G | Augusta Gold Corp. | 0.7 | -1% | 6% | -43% | -63% | $ 60,150,827.10 |
| ORA | Aura Minerals Inc. | 9.23 | -1% | 6% | -12% | -1% | $ 645,791,851.98 |
| AVL | Avalon Advanced Materials Inc. | 0.115 | 0% | 5% | 5% | -4% | $ 64,442,964.35 |
| ASM | Avino Silver & Gold Mines Ltd. | 0.59 | -11% | -12% | -47% | -37% | $ 74,193,484.12 |
| AYA | Aya Gold & Silver Inc. | 7.3 | -8% | 3% | -29% | -14% | $ 853,731,116.40 |
| BTO | B2Gold Corp. | 4.14 | -9% | 0% | -27% | -12% | $ 5,383,571,655.78 |
| ABX | Barrick Gold Corporation | 20.98 | -7% | 3% | -21% | -4% | $ 36,830,870,106.32 |
| BSX | Belo Sun Mining Corp. | 0.06 | 0% | 9% | -14% | -76% | $ 27,303,314.88 |
| BKI | Black Iron Inc. | 0.06 | 20% | -8% | -25% | -25% | $ 18,247,226.28 |
| CXB | Calibre Mining Corp. | 1.37 | -5% | -1% | -16% | 80% | $ 628,594,757.30 |
| CCO | Cameco Corporation | 58.68 | 2% | 14% | 53% | 83% | $ 25,428,853,262.57 |
| CCM | Canagold Resources Ltd. | 0.22 | 0% | 0% | -14% | -4% | $ 35,073,862.78 |
| ATCU | Alta Copper Corp. | 0.3 | -17% | -17% | -44% | -61% | $ 23,369,063.40 |
| CS | Capstone Copper Corp. | 4.5 | -10% | -19% | -29% | -2% | $ 3,125,544,889.50 |
| CEE | Centamin plc | 1.42 | -2% | 2% | -22% | -12% | $ 1,644,974,426.90 |
| CG | Centerra Gold Inc. | 7.62 | -8% | 19% | -19% | 8% | $ 1,644,007,372.38 |
| CNT | Century Global Commodities Corporation | 0.03 | 0% | -14% | -73% | -67% | $ 3,546,164.55 |
| CIA | Champion Iron Limited | 6.79 | -2% | 28% | 14% | 46% | $ 3,502,092,125.95 |
| CGG | China Gold International Resources Corp. Ltd. | 5.44 | 0% | -11% | -22% | 50% | $ 2,156,490,816.32 |
| COG | Condor Gold plc | 0.22 | -19% | -33% | -58% | -45% | $ 41,240,648.02 |
| CMMC | Copper Mountain Mining Corporation | 0 | -100% | -100% | -100% | -100% | $ 533,814,847.77 |
| DML | Denison Mines Corp. | 2.17 | -2% | -2% | 44% | 34% | $ 1,928,265,337.46 |
| DSV | Discovery Silver Corp. | 0.59 | -6% | -13% | -44% | -54% | $ 237,432,138.00 |
| DPM | Dundee Precious Metals Inc. | 9.42 | -5% | 11% | -9% | 27% | $ 1,726,482,433.80 |
| DNG | Dynacor Group Inc. | 3.25 | -3% | 1% | 7% | 19% | $ 124,434,531.00 |
| ELR | Eastern Platinum Limited | 0.095 | 12% | 12% | -24% | -44% | $ 19,180,635.47 |
| ECOR | Ecora Resources plc | 1.48 | -6% | -14% | -39% | -39% | $ 381,686,312.36 |
| ELD | Eldorado Gold Corporation | 14.41 | -6% | 16% | -8% | 55% | $ 2,945,794,755.97 |
| ELO | Eloro Resources Ltd. | 1.48 | -5% | -24% | -57% | -53% | $ 112,974,667.05 |
| EDV | Endeavour Mining plc | 28.33 | -4% | 8% | -19% | 5% | $ 7,018,471,055.37 |
| EDR | Endeavour Silver Corp. | 2.66 | -14% | -19% | -45% | -43% | $ 549,368,794.52 |
| EFR | Energy Fuels Inc. | 10.92 | 1% | 3% | 26% | 11% | $ 1,752,468,474.12 |
| ETG | Entree Resources Ltd. | 1.24 | -4% | -5% | -5% | 20% | $ 251,256,086.24 |
| EQX | Equinox Gold Corp. | 6.31 | -5% | 9% | -16% | 31% | $ 1,974,909,687.23 |
| ERD | Erdene Resource Development Corporation | 0.28 | -8% | -15% | -21% | 4% | $ 96,479,037.20 |
| ERO | Ero Copper Corp. | 16.18 | -13% | -27% | -35% | -7% | $ 1,511,819,963.50 |
| ESM | Euro Sun Mining Inc. | 0.04 | 33% | -20% | -20% | -38% | $ 12,725,879.92 |
| EOX | Euromax Resources Ltd. | 0.05 | -9% | -23% | -38% | 25% | $ 24,500,666.00 |
| EXN | Excellon Resources Inc. | 0.09 | 0% | -10% | -77% | -82% | $ 4,416,487.47 |
| MIN | Excelsior Mining Corp. | 0.14 | 0% | -10% | -43% | -13% | $ 38,808,611.10 |
| FDY | Faraday Copper Corp. | 0.55 | -14% | -15% | -39% | 28% | $ 96,750,440.05 |
| FIL | Filo Corp | 17.48 | -9% | -13% | -22% | -2% | $ 2,284,787,499.16 |
| FR | First Majestic Silver Corp. | 6.32 | -5% | -9% | -30% | -51% | $ 1,813,417,261.52 |
| FF | First Mining Gold Corp. | 0.125 | -4% | -17% | -32% | -40% | $ 103,531,688.88 |
| FM | First Quantum Minerals Ltd. | 16.28 | -7% | -47% | -51% | -49% | $ 11,270,986,577.50 |
| FCU | Fission Uranium Corp. | 0.91 | 2% | 3% | 40% | 26% | $ 679,341,586.56 |
| FSY | Forsys Metals Corp. | 0.6 | -9% | -13% | 30% | 5% | $ 115,149,985.53 |
| FVI | Fortuna Silver Mines Inc. | 4.12 | 0% | 7% | -13% | -10% | $ 1,262,616,353.60 |
| FT | Fortune Minerals Limited | 0.04 | 14% | -11% | -20% | -53% | $ 19,105,754.48 |
| FNV | Franco-Nevada Corporation | 164.69 | -3% | -10% | -23% | -11% | $ 31,640,146,291.66 |
| FVL | Freegold Ventures Limited | 0.345 | -1% | -1% | -50% | -32% | $ 145,472,362.25 |
| FURY | Fury Gold Mines Limited | 0.45 | -1% | -4% | -37% | -13% | $ 65,496,352.50 |
| GAU | Galiano Gold Inc. | 0.74 | 0% | -6% | -22% | 0% | $ 164,208,720.69 |
| GATO | Gatos Silver, Inc. | 6.37 | -6% | -4% | -23% | 31% | $ 442,638,227.20 |
| GENM | Generation Mining Limited | 0.225 | -13% | -29% | -56% | -63% | $ 41,291,416.80 |
| GLO | Global Atomic Corporation | 2.13 | 8% | 9% | -27% | -48% | $ 430,799,639.76 |
| GMX | Globex Mining Enterprises Inc. | 0.82 | -1% | 5% | 3% | 26% | $ 45,361,445.52 |
| GGD | GoGold Resources Inc. | 1.13 | -14% | -8% | -38% | -39% | $ 368,720,142.43 |
| GMTN | Gold Mountain Mining Corp. | 0.09 | -5% | 0% | -50% | -42% | $ 7,910,407.89 |
| GRC | Gold Springs Resource Corp. | 0.09 | -5% | 0% | -22% | -44% | $ 25,324,214.22 |
| AUMN | Golden Minerals Company | 0.67 | -44% | -25% | -90% | -92% | $ 5,726,404.24 |
| GGA | Goldgroup Mining Inc. | 0.035 | 0% | 17% | -56% | -68% | $ 2,896,010.46 |
| GOLD | Goldmining Inc. | 1.07 | -1% | -1% | -26% | -14% | $ 191,715,306.88 |
| HZM | Horizonte Minerals Plc. | 0.31 | -11% | -10% | -87% | -78% | $ 83,631,460.86 |
| HBM | HudBay Minerals Inc. | 5.69 | -11% | -11% | -15% | -19% | $ 1,985,269,489.83 |
| IAU | i-80 Gold Corp. | 1.77 | -11% | -13% | -43% | -38% | $ 527,726,092.95 |
| IMG | Iamgold Corporation | 3.15 | -11% | 6% | -29% | 29% | $ 1,515,633,789.60 |
| III | Imperial Metals Corporation | 1.94 | -5% | -8% | 8% | -16% | $ 314,030,401.54 |
| ITH | International Tower Hill Mines Ltd. | 0.51 | 0% | 10% | -28% | -24% | $ 103,819,331.43 |
| IE | Ivanhoe Electric Inc. | 13.8 | -7% | -8% | -11% | -11% | $ 1,634,388,513.45 |
| IVN | Ivanhoe Mines Ltd. | 10 | -8% | -12% | -13% | -8% | $ 12,205,637,000.00 |
| JAG | Jaguar Mining Inc. | 1.42 | 15% | 11% | -45% | -50% | $ 112,274,664.30 |
| KNT | K92 Mining Inc. | 4.75 | -12% | -14% | -27% | -37% | $ 1,113,031,694.50 |
| KRN | Karnalyte Resources Inc. | 0.22 | -15% | -19% | -8% | -27% | $ 11,722,476.04 |
| KRR | Karora Resources Inc. | 3.96 | -9% | -1% | -26% | 3% | $ 703,845,568.80 |
| K | Kinross Gold Corporation | 7.15 | -6% | 9% | -4% | 26% | $ 8,778,050,474.05 |
| LIF | Labrador Iron Ore Royalty Corporation | 30.54 | 0% | -4% | 5% | -3% | $ 1,954,560,000.00 |
| LAM | Laramide Resources Ltd. | 0.62 | -2% | -3% | 53% | 9% | $ 141,883,711.52 |
| LGO | Largo Inc. | 2.75 | -16% | -29% | -60% | -58% | $ 178,702,521.57 |
| LGD | Liberty Gold Corp. | 0.26 | -7% | 0% | -48% | -36% | $ 89,089,866.84 |
| LAAC | Lithium Americas (Argentina) Corp. | 7.95 | 1% | -24% | -73% | -79% | $ 1,272,378,984.45 |
| LIRC | Lithium Royalty Corp. | 10.68 | -5% | 1% | -30% | 0% | $ 265,217,678.88 |
| LN | Loncor Gold Inc. | 0.345 | -8% | 3% | -15% | 8% | $ 52,834,740.03 |
| LUC | Lucara Diamond Corp. | 0.345 | 5% | -8% | -35% | -34% | $ 159,260,105.55 |
| LUG | Lundin Gold Inc. | 15.11 | -12% | 0% | -21% | 26% | $ 3,590,156,171.85 |
| LUN | Lundin Mining Corporation | 8.36 | -6% | -16% | -22% | 3% | $ 6,465,625,128.60 |
| MAG | MAG Silver Corp. | 13.66 | -8% | -5% | -17% | -35% | $ 1,406,278,053.58 |
| MND | Mandalay Resources Corporation | 1.7 | 0% | -17% | -31% | -7% | $ 157,902,672.50 |
| MOZ | Marathon Gold Corporation | 0.64 | -3% | 16% | -30% | -26% | $ 257,597,674.24 |
| MARI | Marimaca Copper Corp. | 3.48 | -9% | -11% | -18% | 10% | $ 323,228,142.00 |
| MAW | Mawson Gold Limited | 0.335 | -6% | 12% | 68% | 131% | $ 101,051,678.80 |
| MUX | McEwen Mining Inc. | 9.38 | -4% | 5% | -14% | 38% | $ 445,307,226.84 |
| MGA | Mega Uranium Ltd. | 0.35 | -3% | -1% | 84% | 49% | $ 127,149,972.60 |
| MNO | Meridian Mining UK Societas | 0.32 | -9% | -4% | -37% | -9% | $ 77,623,266.56 |
| MSV | Minco Silver Corporation | 0.19 | 9% | 12% | -22% | 15% | $ 10,374,264.11 |
| MSA | Mineros S.A. | 0.57 | -2% | -2% | -12% | -26% | $ 173,847,693.16 |
| GBAR | Monarch Mining Corporation | 0.005 | 0% | -75% | -92% | -93% | $ 1,219,192.63 |
| ME | Moneta Gold Inc. | 0.83 | -5% | 1% | -30% | -50% | $ 101,280,191.41 |
| MPVD | Mountain Province Diamonds Inc. | 0.23 | -4% | -28% | -51% | -66% | $ 48,658,705.24 |
| NCU | Nevada Copper Corp. | 0.15 | -3% | -9% | -46% | -51% | $ 216,742,694.89 |
| NGD | New Gold Inc. | 1.57 | -10% | 8% | -20% | 7% | $ 1,074,676,781.28 |
| NUAG | New Pacific Metals Corp. | 2.05 | -11% | -6% | -39% | -36% | $ 353,772,070.74 |
| NCM | Newcrest Mining Limited | 20.65 | 0% | -6% | -22% | 30% | $ 18,465,864,615.80 |
| NGT | Newmont Corporation | 47.18 | -12% | -10% | -26% | -24% | $ 54,485,362,412.41 |
| NXE | NexGen Energy Ltd. | 8.26 | 1% | 5% | 48% | 43% | $ 4,313,978,184.88 |
| NEXT | NextSource Materials Inc. | 1.43 | -5% | 11% | -28% | -52% | $ 222,471,545.01 |
| NCP | Nickel Creek Platinum Corp. | 0.02 | 0% | -20% | -50% | -56% | $ 9,322,572.34 |
| NHK | Nighthawk Gold Corp. | 0.375 | -4% | 17% | -46% | 4% | $ 56,201,019.00 |
| NB | NioCorp Developments Ltd. | 5.32 | -4% | 12% | -34% | -51% | $ 163,037,358.40 |
| NCF | Northcliff Resources Ltd. | 0.03 | 0% | 0% | -14% | -14% | $ 7,695,465.27 |
| NDM | Northern Dynasty Minerals Ltd. | 0.45 | 3% | 3% | 43% | 27% | $ 238,465,354.50 |
| NG | NovaGold Resources Inc. | 4.95 | -5% | -1% | -33% | -35% | $ 1,654,196,687.55 |
| NVO | Novo Resources Corp. | 0.15 | -3% | -12% | -44% | -69% | $ 53,001,545.53 |
| NTR | Nutrien Ltd. | 73.85 | -4% | -12% | -13% | -30% | $ 36,522,321,059.00 |
| OGC | OceanaGold Corporation | 2.25 | -5% | -12% | -34% | -9% | $ 1,591,596,983.25 |
| OREA | Orea Mining Corp. | 0.02 | -20% | 0% | -80% | -71% | $ 4,543,898.16 |
| ORE | Orezone Gold Corporation | 0.77 | -13% | -16% | -52% | -38% | $ 280,487,990.86 |
| OLA | Orla Mining Ltd | 4.06 | -9% | -9% | -35% | -18% | $ 1,276,548,232.82 |
| ORV | Orvana Minerals Corp. | 0.185 | 23% | 16% | -5% | 3% | $ 22,542,823.22 |
| OR | Osisko Gold Royalties Ltd | 17.55 | 0% | 8% | -24% | 4% | $ 3,249,662,668.20 |
| OSK | Osisko Mining Inc. | 2.55 | -10% | -6% | -25% | -31% | $ 956,925,928.50 |
| PAAS | Pan American Silver Corp. | 18.38 | -12% | -5% | -22% | -5% | $ 6,698,390,915.32 |
| PPTA | Perpetua Resources Corp. | 4.55 | -6% | -12% | -35% | 42% | $ 287,546,045.15 |
| PRU | Perseus Mining Limited | 1.52 | -1% | 9% | -20% | -20% | $ 2,087,817,213.12 |
| PTM | Platinum Group Metals Ltd. | 1.38 | -6% | -7% | -37% | -41% | $ 141,279,811.50 |
| POM | Polymet Mining Corp. | 2.86 | -1% | 0% | 28% | -31% | $ 556,156,317.86 |
| PRB | Probe Gold Inc. | 1.29 | -4% | -2% | -22% | 0% | $ 209,190,423.51 |
| RTG | RTG Mining Inc. | 0.025 | -29% | -29% | -50% | -55% | $ 20,968,036.38 |
| RUP | Rupert Resources Ltd. | 2.97 | -2% | -12% | -34% | -26% | $ 605,235,132.81 |
| SGLD | Sabre Gold Mines Corp. | 0.115 | 0% | -12% | -32% | -50% | $ 9,159,812.45 |
| SSL | Sandstorm Gold Ltd. | 6.29 | -6% | 0% | -21% | -11% | $ 1,862,987,428.09 |
| SCY | Scandium International Mining Corp. | 0.03 | 0% | -14% | -45% | -50% | $ 10,675,824.39 |
| SEA | Seabridge Gold Inc. | 14.97 | -7% | 1% | -29% | -10% | $ 1,256,233,777.44 |
| SBI | Serabi Gold plc | 0.56 | -5% | 27% | 8% | 60% | $ 42,411,348.56 |
| S | Sherritt International Corporation | 0.395 | -1% | -2% | -27% | -21% | $ 158,915,472.00 |
| SMT | Sierra Metals Inc. | 0.66 | 50% | 74% | 69% | 154% | $ 106,985,492.90 |
| SGNL | Signal Gold Inc. | 0.15 | -6% | -23% | -49% | -54% | $ 31,852,554.26 |
| SBR | Silver Bear Resources plc | 0.05 | 0% | 0% | 0% | 0% | $ 33,916,480.55 |
| SVB | Silver Bull Resources, Inc. | 0.105 | -9% | -5% | -50% | -46% | $ 4,973,393.46 |
| ELEF | Silver Elephant Mining Corp. | 0.325 | 0% | 3% | -23% | -38% | $ 10,673,623.35 |
| SVM | Silvercorp Metals Inc. | 2.95 | -7% | -6% | -40% | -21% | $ 521,618,967.55 |
| SIL | SilverCrest Metals Inc. | 7.13 | -1% | 15% | -23% | -18% | $ 1,039,613,635.32 |
| SKE | Skeena Resources Limited | 4.67 | 1% | -22% | -51% | -38% | $ 415,221,790.63 |
| SLS | Solaris Resources Inc. | 4.84 | -5% | -19% | -26% | -15% | $ 717,035,981.20 |
| SOLG | SolGold plc | 0.15 | -14% | -19% | -52% | -45% | $ 450,166,046.25 |
| SLR | Solitario Resources Corp. | 0.7 | -3% | -13% | -15% | -1% | $ 54,456,400.60 |
| SGQ | SouthGobi Resources Ltd | 0.22 | 42% | 91% | 0% | 52% | $ 54,623,244.12 |
| SSRM | SSR Mining Inc. | 16.11 | -4% | -9% | -28% | -20% | $ 3,284,635,567.23 |
| SAU | St. Augustine Gold and Copper Limited | 0.085 | 6% | 21% | 55% | 55% | $ 85,969,405.20 |
| DIAM | Star Diamond Corporation | 0.08 | -6% | 0% | -6% | -6% | $ 38,112,077.60 |
| SAM | Starcore International Mines Ltd. | 0.11 | -4% | -8% | -37% | -27% | $ 6,121,153.61 |
| STGO | Steppe Gold Ltd. | 0.68 | -8% | 8% | -33% | -41% | $ 72,126,122.97 |
| SMC | Sulliden Mining Capital Inc. | 0.035 | 17% | 0% | -22% | -30% | $ 4,489,659.27 |
| TSK | Talisker Resources Ltd. | 0.26 | -4% | -21% | -60% | -61% | $ 22,811,743.50 |
| TLO | Talon Metals Corp. | 0.225 | -10% | -8% | -31% | -52% | $ 214,430,432.44 |
| TKO | Taseko Mines Limited | 1.62 | -10% | -4% | -20% | -6% | $ 467,737,976.52 |
| TI | Titan Mining Corporation | 0.41 | 4% | 4% | -18% | -18% | $ 55,910,305.59 |
| TXG | Torex Gold Resources Inc. | 12.93 | -7% | -9% | -46% | 11% | $ 1,110,498,907.29 |
| TML | Treasury Metals Inc. | 0.13 | -13% | -21% | -58% | -60% | $ 19,323,982.73 |
| TMQ | Trilogy Metals Inc. | 0.64 | 2% | -7% | -18% | -17% | $ 99,765,659.52 |
| TFPM | Triple Flag Precious Metals Corp. | 16.49 | -9% | -8% | -24% | 10% | $ 3,323,885,375.38 |
| TLG | Troilus Gold Corp. | 0.33 | -8% | -16% | -45% | -28% | $ 77,811,616.08 |
| TNX | TRX Gold Corporation | 0.52 | -4% | -2% | -32% | 4% | $ 143,982,784.40 |
| URE | Ur-Energy Inc. | 2.13 | -2% | 1% | 61% | 20% | $ 566,525,050.26 |
| NPK | Verde Agritech Ltd. | 1.26 | -10% | -26% | -45% | -82% | $ 66,363,852.24 |
| VGCX | Victoria Gold Corp. | 5.45 | -10% | -9% | -47% | -32% | $ 362,612,207.50 |
| VGZ | Vista Gold Corp. | 0.425 | -17% | -15% | -54% | -49% | $ 50,653,467.48 |
| WM | Wallbridge Mining Company Limited | 0.09 | -5% | -28% | -45% | -61% | $ 91,462,458.42 |
| WDO | Wesdome Gold Mines Ltd. | 7.22 | -8% | -2% | -22% | -24% | $ 1,075,431,613.34 |
| WRN | Western Copper and Gold Corporation | 1.68 | -3% | -3% | -26% | -15% | $ 273,011,371.92 |
| WRX | Western Resources Corp. | 0.14 | -7% | -35% | -56% | -38% | $ 61,302,071.70 |
| WPM | Wheaton Precious Metals Corp. | 59.31 | -3% | 7% | -14% | 17% | $ 26,867,201,122.71 |
| XAM | Xanadu Mines Ltd | 6.7 | 0% | -1% | 43% | 123% | $ 114,647,693.37 |
| XTG | Xtra-Gold Resources Corp. | 0.94 | -8% | 9% | 11% | 8% | $ 43,505,753.98 |
| YRB | Yorbeau Resources Inc. | 0.04 | -11% | 0% | -20% | -38% | $ 17,663,533.20 |
| AII | Almonty Industries Inc. | 0.53 | -4% | 0% | -18% | -21% | $ 121,102,107.36 |
| TECK.B | Teck Resources Limited - Teck Res Cl B SV | 48.79 | -4% | -13% | -19% | 7% | $ 24,992,262,345.89 |
| TECK.A | Teck Resources Limited - Teck Res Cl A MV | 48.78 | -5% | -14% | -52% | 4% | $ 378,801,236.34 |
| FOM | Foran Mining Corporation | 3.91 | -6% | 10% | 11% | 49% | $ 1,003,757,526.80 |
| EFF | 1844 Resources Inc. | 0.02 | 0% | -38% | -50% | -60% | $ 1,593,665.16 |
| AUMB | 1911 Gold Corporation | 0.07 | -7% | -7% | -36% | -30% | $ 4,434,050.08 |
| AIS | A.I.S. Resources Limited | 0.005 | -50% | 0% | -67% | -83% | $ 1,021,077.05 |
| AME | Abacus Mining & Exploration Corporation | 0.035 | -22% | -13% | 0% | -13% | $ 4,229,551.94 |
| ABA | Abasca Resources Inc. | 0.2 | 0% | 5% | 18% | 100% | $ 10,627,473.80 |
| ABI | Abcourt Mines Inc. | 0.035 | -13% | 0% | -46% | -13% | $ 16,839,803.86 |
| ABM | Aben Minerals Ltd. | 0.075 | -6% | -12% | -32% | -75% | $ 1,403,980.20 |
| ABRA | AbraSilver Resource Corp. | 0.27 | -10% | -11% | -26% | -30% | $ 152,531,738.28 |
| ADZ | Adamera Minerals Corp. | 0.04 | 0% | 33% | 14% | -43% | $ 9,425,317.12 |
| ADE | Adex Mining Inc. | 0.005 | 0% | 0% | -50% | -50% | $ 3,386,057.21 |
| AALI | Advance Lithium Corp. | 0.025 | 0% | 0% | -38% | 67% | $ 2,087,911.80 |
| ADZN | Adventus Mining Corporation | 0.345 | 38% | 19% | -4% | -20% | $ 61,972,388.64 |
| ADY | Adyton Resources Corporation | 0.005 | -50% | -50% | -50% | -67% | $ 863,379.16 |
| AFR | AFR NuVenture Resources Inc. | 0.015 | -25% | 0% | -67% | -50% | $ 270,580.22 |
| CUCO | African Energy Metals Inc. | 0.02 | 0% | -43% | -75% | -90% | $ 401,359.04 |
| AAG | Aftermath Silver Ltd. | 0.2 | 0% | 14% | -26% | -23% | $ 41,456,602.20 |
| AML | Akwaaba Mining Ltd. | 0.14 | 0% | -30% | -53% | -30% | $ 1,436,312.50 |
| AEMC | Alaska Energy Metals Corporation | 0.55 | -8% | 15% | 57% | 22% | $ 20,514,439.08 |
| ALDE | Aldebaran Resources Inc. | 0.8 | -1% | 1% | 7% | 7% | $ 130,760,722.40 |
| SNAG | Silver North Resources Ltd. | 0.19 | -5% | -16% | 27% | 27% | $ 6,831,068.86 |
| AUAU | Allegiant Gold Ltd. | 0.115 | -4% | -4% | -34% | -48% | $ 11,895,522.95 |
| ALM | Alliance Mining Corp. | 0.085 | 0% | -19% | -61% | -39% | $ 743,266.86 |
| DEX | Almadex Minerals Ltd. | 0.22 | -8% | -10% | -29% | -34% | $ 13,421,747.68 |
| AORO | Aloro Mining Corp. | 0.01 | 0% | 0% | -82% | -60% | $ 577,292.63 |
| ALEX | Alpha Exploration Ltd. | 0.66 | -1% | -3% | -13% | 27% | $ 43,288,287.24 |
| AFM | Alphamin Resources Corp. | 0.89 | 1% | 5% | 0% | 33% | $ 1,135,055,993.57 |
| ATI | Altai Resources Inc. | 0.055 | 0% | 10% | -15% | -21% | $ 3,081,845.36 |
| AVX | Altair Resources Inc. | 0.01 | 0% | 0% | -33% | 0% | $ 572,666.24 |
| ALTA | Altamira Gold Corp. | 0.14 | 0% | 12% | -20% | -26% | $ 22,959,704.04 |
| HHH | Helius Minerals Limited | 0.07 | -18% | 17% | 56% | -30% | $ 2,375,036.65 |
| GHML | Golden Horse Minerals Limited | 0.1 | 43% | 11% | 54% | 100% | $ 15,954,728.50 |
| APN | Altiplano Metals Inc. | 0.075 | -12% | -6% | -29% | -57% | $ 9,325,029.08 |
| ALT | Alturas Minerals Corp. | 0.02 | 0% | 0% | 0% | 0% | $ 2,912,642.86 |
| AL | ALX Resources Corp. | 0.025 | -17% | -17% | -17% | -38% | $ 5,859,598.90 |
| AMR | AM Resources Corp. | 0.02 | 0% | -20% | -20% | -43% | $ 3,142,581.44 |
| AHR | Amarc Resources Ltd. | 0.09 | -10% | 0% | -31% | -33% | $ 16,803,260.46 |
| AMRQ | Amaroq Minerals Ltd. | 1.01 | -4% | 6% | 46% | 84% | $ 266,306,751.51 |
| AMK | American Creek Resources Ltd. | 0.11 | -4% | -12% | -39% | -24% | $ 41,725,961.45 |
| AE | American Eagle Gold Corp. | 0.215 | 8% | 19% | 39% | -4% | $ 20,697,026.17 |
| LI | American Lithium Corp. | 1.5 | -11% | -18% | -50% | -30% | $ 321,983,721.00 |
| AMX | Amex Exploration Inc. | 1.15 | 14% | 4% | -38% | -39% | $ 116,664,591.13 |
| XYZ | Anacortes Mining Corp. | 0 | -100% | -100% | -100% | -100% | $ 15,329,562.48 |
| APM | Andean Precious Metals Corp. | 0.59 | -8% | 2% | -33% | -14% | $ 93,999,499.80 |
| AEC | Anfield Energy Inc. | 0.065 | -13% | -24% | 0% | 0% | $ 66,278,560.88 |
| AWM | Angel Wing Metals Inc. | 0.13 | -10% | -4% | -58% | -28% | $ 8,742,837.22 |
| ANK | Angkor Resources Corp. | 0.1 | 25% | 0% | 25% | 25% | $ 18,445,880.50 |
| AAU | Angold Resources Ltd. | 0.085 | -15% | 70% | -43% | -79% | $ 1,229,994.71 |
| GUS | Angus Gold Inc. | 0.5 | 0% | 0% | -40% | -26% | $ 24,550,525.00 |
| AGD | Antioquia Gold Inc. | 0.01 | 0% | 100% | 0% | -60% | $ 9,493,981.38 |
| ANTL | Antler Gold Inc. | 0.07 | 27% | 8% | -36% | -42% | $ 5,658,165.45 |
| APX | Apex Resources Inc. | 0.065 | -7% | -24% | -7% | 44% | $ 2,350,558.93 |
| APMI | Apogee Minerals Ltd. | 0.05 | -29% | -9% | -17% | -47% | $ 1,064,000.05 |
| APGO | Apollo Silver Corp. | 0.08 | -6% | -11% | -54% | -38% | $ 13,956,831.60 |
| ARJN | Aranjin Resources Ltd. | 0.015 | 50% | 0% | -25% | -25% | $ 5,813,901.66 |
| ABR | Arbor Metals Corp. | 1.43 | -7% | -21% | -53% | -46% | $ 90,282,959.58 |
| ACS | Archon Minerals Limited | 0.14 | 0% | -35% | -30% | -48% | $ 7,618,346.12 |
| ADD | Arctic Star Exploration Corp. | 0.015 | 0% | 50% | -25% | -70% | $ 3,046,005.54 |
| AWX | Arcwest Exploration Inc. | 0.06 | 9% | 33% | 20% | 9% | $ 4,978,677.42 |
| LIT | Argentina Lithium & Energy Corp. | 0.37 | -12% | -33% | 48% | 30% | $ 48,528,700.13 |
| ASL | Argentum Silver Corp. | 0.04 | 0% | -20% | 0% | -20% | $ 2,063,941.72 |
| DAN | Arianne Phosphate Inc. | 0.19 | -10% | -34% | -43% | -51% | $ 37,393,761.49 |
| AZS | Arizona Gold & Silver Inc. | 0.4 | -2% | 14% | -25% | 48% | $ 28,978,035.53 |
| ARK | Arras Minerals Corp. | 0.13 | -10% | -13% | -63% | -73% | $ 9,248,094.00 |
| ARTG | Artemis Gold Inc. | 5.44 | -5% | 3% | 9% | 26% | $ 1,077,172,773.44 |
| RBZ | Arya Resources Ltd. | 0.08 | 0% | -11% | -33% | 45% | $ 2,032,799.60 |
| ABZ | AsiaBaseMetals Inc. | 0.12 | 0% | -20% | -20% | -8% | $ 5,928,344.52 |
| BAY | Aston Bay Holdings Ltd. | 0.06 | -8% | -20% | 50% | 100% | $ 12,182,608.30 |
| ASTR | Astra Exploration Inc. | 0.12 | 0% | 0% | -20% | 4% | $ 5,718,344.52 |
| ATC | ATAC Resources Ltd. | 0 | -100% | -100% | -100% | -100% | $ 27,687,617.88 |
| ACOP | Atacama Copper Corporation | 0.21 | 0% | 11% | 17% | 40% | $ 7,547,502.48 |
| ATX | ATEX Resources Inc. | 0.66 | -14% | -10% | -52% | 47% | $ 114,711,286.14 |
| AMI | Athabasca Minerals Inc. | 0.135 | 4% | -4% | 35% | -46% | $ 10,608,662.61 |
| ATY | Atico Mining Corporation | 0.12 | -8% | 0% | -35% | -59% | $ 14,554,342.20 |
| SALT | Atlas Salt Inc. | 0.85 | 8% | -9% | -39% | -54% | $ 81,415,155.10 |
| ATOM | Atomic Minerals Corporation | 0.135 | 50% | -10% | 8% | 8% | $ 1,843,414.20 |
| AAN | Aton Resources Inc. | 0.2 | 0% | 0% | 5% | -5% | $ 15,750,870.00 |
| AUGC | Au Gold Corp. | 0.015 | 0% | 0% | -40% | -73% | $ 504,837.36 |
| AUQ | AuQ Gold Mining Inc. | 0.055 | 0% | -15% | -69% | -8% | $ 962,607.91 |
| ARU | Aurania Resources Ltd. | 0.39 | -5% | 70% | 28% | -19% | $ 26,313,981.33 |
| AUN.H | Aurcana Svr | 0.015 | 0% | 0% | 0% | 50% | $ 4,636,972.64 |
| AUL | Aurelius Minerals Inc. | 0.02 | 0% | 0% | 0% | -76% | $ 1,075,056.26 |
| AU | Aurion Resources Ltd. | 0.425 | 1% | -13% | -43% | -11% | $ 56,295,210.15 |
| AGLD | Austral Gold Limited | 0.025 | -17% | 0% | -38% | -44% | $ 15,307,783.83 |
| AVG | Avidian Gold Corp. | 0.01 | -33% | 0% | -67% | -71% | $ 2,781,168.11 |
| AVU | Avrupa Minerals Ltd. | 0.04 | 0% | 33% | -20% | 33% | $ 2,128,190.16 |
| ARIC | Awale Resources Limited | 0.1 | -9% | -26% | -17% | -38% | $ 5,620,300.90 |
| AXM | AXMIN Inc. | 0.02 | -33% | -33% | -60% | -50% | $ 2,993,747.62 |
| AZR | Azarga Metals Corp. | 0.1 | 18% | 18% | -33% | -50% | $ 3,350,527.30 |
| AZM | Azimut Exploration Inc. | 0.83 | -9% | -12% | -31% | 46% | $ 70,723,174.52 |
| AAZ | Azincourt Energy Corp. | 0.03 | -14% | -33% | -25% | -40% | $ 8,293,860.72 |
| AZT | Aztec Minerals Corp. | 0.16 | -6% | -11% | -48% | -46% | $ 16,259,136.16 |
| AMZ | Azucar Minerals Ltd. | 0.045 | 0% | -40% | -47% | -25% | $ 3,322,306.13 |
| BYN | Banyan Gold Corp. | 0.275 | 2% | -7% | -35% | -31% | $ 76,915,885.23 |
| BRO | Barksdale Resources Corp. | 0.56 | -5% | -3% | -29% | -19% | $ 45,566,148.32 |
| BGS | Baroyeca Gold & Silver Inc. | 0.02 | 33% | 33% | -56% | -75% | $ 1,329,695.00 |
| BME | Barsele Minerals Corp. | 0.16 | 7% | -18% | -41% | -53% | $ 24,077,053.00 |
| BARU | Baru Gold Corp. | 0.03 | -14% | 0% | 20% | 20% | $ 6,805,055.85 |
| FIND | Baselode Energy Corp. | 0.365 | 4% | -17% | -19% | -41% | $ 37,750,864.86 |
| BAT | Batero Gold Corp. | 0.02 | 0% | -20% | -43% | -43% | $ 2,303,647.66 |
| BMV | Bathurst Metals Corp. | 0.08 | 0% | -20% | -50% | -20% | $ 2,045,428.80 |
| BMR | Battery Mineral Resources Corp. | 0.105 | -19% | -13% | -50% | -43% | $ 18,640,331.12 |
| BHS | Bayhorse Silver Inc. | 0.035 | 40% | 133% | 17% | -13% | $ 8,941,775.15 |
| BM | BC Moly Ltd. | 0.075 | -17% | -17% | -50% | -53% | $ 2,597,855.03 |
| B | BCM Resources Corporation | 0.105 | 40% | 17% | -16% | 11% | $ 19,903,080.23 |
| BCM | Bear Creek Mining Corporation | 0.195 | -7% | -17% | -70% | -65% | $ 40,705,904.13 |
| BGF | Beauce Gold Fields Inc. | 0.035 | -13% | -13% | -36% | -13% | $ 2,987,221.72 |
| BFM | Bedford Metals Corp. | 0.81 | -5% | 131% | 268% | 913% | $ 5,232,659.13 |
| BCU | Bell Copper Corporation | 0.11 | 0% | -12% | -21% | -24% | $ 14,349,708.34 |
| BEA | Belmont Resources Inc. | 0.05 | 0% | 150% | 67% | 0% | $ 3,934,163.60 |
| BMET | Bemetals Corp. | 0.09 | -10% | -31% | -25% | -18% | $ 15,961,729.05 |
| TAU | Thesis Gold Inc | 0.415 | -3% | -32% | -61% | -61% | $ 70,075,384.73 |
| BEX | Benton Resources Inc. | 0.145 | 38% | 222% | 93% | 61% | $ 23,964,046.62 |
| BZ | Benz Mining Corp. | 0.285 | -14% | -5% | -12% | -32% | $ 47,851,949.73 |
| BRAU | Big Ridge Gold Corp. | 0.04 | -20% | -20% | -67% | -60% | $ 8,471,062.22 |
| BIGT | Big Tree Carbon Inc. | 0.055 | 10% | 0% | 0% | -48% | $ 6,232,592.08 |
| BTT | Bitterroot Resources Ltd. | 0.025 | -17% | -17% | -38% | -50% | $ 2,342,088.90 |
| BMM | Black Mammoth Metals Corporation | 0.085 | 0% | 6% | -23% | -11% | $ 1,349,534.04 |
| BRC | Blackrock Silver Corp. | 0.275 | -10% | 6% | -15% | -42% | $ 52,115,209.65 |
| BWCG | Blackwolf Copper and Gold Ltd. | 0.22 | -4% | -4% | -41% | -8% | $ 27,675,000.00 |
| BAG | Blende Silver Corp. | 0.025 | 0% | 67% | 0% | 25% | $ 1,773,778.00 |
| MOON | Blue Moon Metals Inc. | 0.055 | 0% | -8% | -35% | -63% | $ 1,584,245.16 |
| BXR | Blue River Resources Ltd. | 0.005 | 0% | 0% | 0% | -75% | $ 1,252,926.16 |
| BSK | Blue Sky Uranium Corp. | 0.055 | -8% | -21% | -42% | -58% | $ 15,579,288.36 |
| BAU | Blue Star Gold Corp. | 0.385 | -1% | -3% | -3% | 54% | $ 29,698,727.52 |
| BLUE | Blue Thunder Mining Inc. | 0.05 | 0% | 0% | 0% | 6% | $ 1,849,781.75 |
| BSR | Bluestone Resources Inc. | 0.2 | -22% | -29% | -64% | -72% | $ 29,553,623.78 |
| BMEX | BMEX Gold Inc. | 0.03 | 0% | 50% | -50% | -54% | $ 2,281,902.96 |
| BOCA | Bocana Resources Corp. | 0.03 | -14% | -25% | -40% | -80% | $ 3,036,830.61 |
| BOL | Bold Ventures Inc. | 0.065 | 0% | 0% | 0% | -24% | $ 3,412,885.78 |
| BNZ | Bonanza Mining Corporation | 0.025 | -17% | -17% | -67% | -55% | $ 1,253,555.05 |
| BTR | BonTerra Resources Inc. | 0.175 | -10% | -8% | -47% | -51% | $ 22,084,212.50 |
| BONE | Boron One Holdings Inc. | 0.04 | -11% | 0% | -43% | 0% | $ 9,770,667.15 |
| BDGC | Boundary Gold and Copper Mining Ltd. | 0.3 | 0% | 0% | 0% | -40% | $ 473,502.00 |
| BHLI | Bradda Head Lithium Limited | 0.05 | 0% | 25% | -52% | -64% | $ 19,530,471.95 |
| BVA | Bravada Gold Corporation | 0.04 | 0% | 14% | -33% | 14% | $ 4,607,347.57 |
| BRVO | Bravo Mining Corp. | 2.89 | 1% | 5% | -8% | 70% | $ 313,672,247.90 |
| BRG | Brigadier Gold Limited | 0.01 | -33% | -50% | -89% | -33% | $ 1,277,642.02 |
| BBB | Brixton Metals Corporation | 0.145 | -3% | -12% | -15% | -31% | $ 55,414,222.98 |
| BRW | Brunswick Exploration Inc. | 0.9 | -6% | 11% | 17% | 140% | $ 169,871,373.00 |
| BTU | BTU Metals Corp. | 0.025 | 0% | 0% | -50% | 25% | $ 3,578,025.35 |
| AMMO | Bullet Exploration Inc. | 0.06 | 0% | 0% | -43% | -33% | $ 1,580,329.26 |
| BGD | Bullion Gold Resources Corp. | 0.025 | 0% | 25% | 0% | -38% | $ 1,337,704.70 |
| INFM | Infinico Metals Corp. | 0.06 | -25% | -25% | 20% | -14% | $ 2,488,509.30 |
| BWR | BWR Exploration Inc. | 0.025 | 25% | -17% | -38% | 0% | $ 2,650,261.53 |
| CCCM | C3 Metals Inc. | 0.07 | -7% | 0% | 56% | 8% | $ 48,265,296.45 |
| CBR | Cabral Gold Inc. | 0.12 | -4% | 0% | -11% | -41% | $ 22,381,863.24 |
| CNX | Callinex Mines Inc. | 1.96 | -6% | -18% | -34% | -19% | $ 34,268,168.15 |
| COR | Camino Minerals Corporation | 0.055 | 22% | 10% | -42% | 83% | $ 9,533,153.69 |
| CCB | Canada Carbon Inc. | 0.025 | -17% | -38% | -17% | -50% | $ 4,250,092.53 |
| CNC | Canada Nickel Company Inc. | 0.99 | -10% | -19% | -37% | -27% | $ 140,403,922.56 |
| CONE | Canada One Mining Corp. | 0.05 | -9% | -41% | -58% | -58% | $ 1,678,839.30 |
| LL | Canada Rare Earth Corp. | 0.025 | 0% | -17% | -50% | -29% | $ 5,247,692.40 |
| CCW | Canada Silver Cobalt Works Inc. | 0.04 | 0% | -11% | -38% | -53% | $ 10,469,798.52 |
| CCMI | Canadian Critical Minerals Inc. | 0.03 | 0% | -14% | -25% | -63% | $ 7,715,580.51 |
| CNRI | Canadian North Resources Inc. | 2.3 | -15% | -32% | -4% | -2% | $ 234,690,047.30 |
| CPS | Canadian Premium Sand Inc. | 0.32 | 7% | -14% | -38% | -23% | $ 23,703,276.30 |
| CAF | Canaf Investments Inc. | 0.175 | 3% | -3% | 30% | 75% | $ 8,536,715.10 |
| CVV | CanAlaska Uranium Ltd. | 0.39 | -11% | -28% | 22% | 0% | $ 46,419,812.67 |
| CLZ | Canasil Resources Inc. | 0.015 | 50% | 0% | -40% | -67% | $ 1,438,142.80 |
| CAND | Candelaria Mining Corp. | 0.015 | -25% | -25% | -57% | -80% | $ 2,248,119.39 |
| CANX | Canex Metals Inc | 0.035 | 0% | 17% | -42% | -53% | $ 3,692,029.85 |
| CML | CaNickel Mining Limited | 0.08 | 0% | 0% | -20% | 7% | $ 3,001,629.52 |
| CLV | Canoe Mining Ventures Corp. | 0.035 | 0% | 0% | -63% | -13% | $ 724,209.48 |
| ROX | Canstar Resources Inc. | 0.035 | 40% | 0% | -46% | -50% | $ 3,984,489.39 |
| CTM | Canterra Minerals Corporation | 0.05 | 0% | -17% | -38% | 11% | $ 5,011,718.60 |
| CD | Cantex Mine Development Corp. | 0.22 | -4% | 5% | 7% | -17% | $ 19,881,050.64 |
| CDA | Canuc Resources Corporation | 0.12 | -14% | -8% | 60% | 60% | $ 19,104,738.00 |
| CXG | Canxgold Mining Corp. | 0.005 | 0% | 0% | -50% | -83% | $ 378,499.18 |
| CMIL | Capella Minerals Limited | 0.025 | -17% | 0% | -17% | -58% | $ 3,904,203.90 |
| CAPT | Capitan Silver Corp. | 0.12 | 0% | -14% | -43% | -52% | $ 8,470,892.52 |
| CRB | Cariboo Rose Resources Ltd. | 0.035 | 0% | -13% | -22% | 0% | $ 1,661,166.08 |
| CGD | Carlin Gold Corporation | 0.16 | -3% | -6% | 7% | -20% | $ 2,967,034.24 |
| RUSH | Carolina Rush Corporation | 0.11 | 0% | 5% | -31% | -27% | $ 4,715,163.42 |
| ECR | Cartier Resources Inc. | 0.075 | -12% | -12% | -38% | -17% | $ 24,472,055.78 |
| CASA | CASA Minerals Inc. | 0.075 | 7% | -17% | -21% | -25% | $ 4,955,500.13 |
| CCD | Cascadero Copper Corporation | 0.01 | 0% | 0% | 0% | 0% | $ 3,001,298.74 |
| GLDC | Cassiar Gold Corp. | 0.265 | 2% | -17% | -44% | -52% | $ 26,154,641.88 |
| CBLT | CBLT Inc. | 0.03 | 0% | 0% | -25% | -14% | $ 1,904,426.83 |
| CIO | Central Iron Ore Limited | 0.055 | -8% | -8% | -15% | -15% | $ 1,333,048.64 |
| CTN | Centurion Minerals Ltd. | 0.015 | 0% | 50% | -25% | 0% | $ 472,036.04 |
| LCE | Century Lithium Corp. | 0.65 | -7% | -10% | -35% | -38% | $ 96,030,706.20 |
| CERT | Cerrado Gold Inc. | 0.51 | -15% | -27% | -45% | -36% | $ 50,110,171.38 |
| CYL | Ceylon Graphite Corp. | 0.04 | -11% | 0% | -47% | -50% | $ 6,654,554.00 |
| PERU | Chakana Copper Corp. | 0.04 | 0% | -11% | -38% | -53% | $ 6,781,170.32 |
| CBA | Champion Bear Resources Ltd. | 0.095 | -5% | -14% | 0% | -32% | $ 5,440,481.82 |
| NZP | Chatham Rock Phosphate Limited | 0.09 | 6% | 20% | -18% | -45% | $ 7,679,635.83 |
| CKG | Chesapeake Gold Corp. | 1.6 | -10% | -14% | -4% | -28% | $ 107,113,316.94 |
| CBG | Chibougamau Independent Mines Inc. | 0.11 | 5% | 5% | -8% | 22% | $ 6,717,208.96 |
| CRI | Churchill Resources Inc. | 0.065 | 44% | 44% | -24% | -59% | $ 6,626,248.72 |
| AIR | Clean Air Metals Inc. | 0.04 | -11% | 0% | -43% | -67% | $ 8,954,444.92 |
| CZZ | Cleghorn Minerals Ltd. | 0.075 | 0% | 0% | 25% | 15% | $ 2,362,789.05 |
| CMB | CMC Metals Ltd. | 0.05 | -23% | -38% | -63% | -78% | $ 7,131,808.20 |
| COCO | Coast Copper Corp. | 0.045 | 0% | -10% | -18% | -25% | $ 2,916,076.05 |
| CBI | Colibri Resource Corporation | 0.04 | 14% | 33% | -50% | -11% | $ 3,869,065.00 |
| CAD | Colonial Coal International Corp. | 1.39 | -4% | 4% | -9% | -10% | $ 248,084,073.89 |
| CLUS | Colossus Resources Corp. | 0.15 | -12% | 0% | -35% | -25% | $ 2,037,465.00 |
| CMU | Comet Industries Ltd. | 4.5 | 0% | 0% | 27% | -5% | $ 23,112,427.50 |
| CMD | Commander Resources Ltd. | 0.05 | 0% | -17% | -33% | -44% | $ 2,184,162.05 |
| CCE | Commerce Resources Corp. | 0.135 | 17% | 29% | 17% | -7% | $ 13,479,318.68 |
| CVB | Compass Gold Corporation | 0.105 | 0% | 5% | 31% | 17% | $ 10,916,896.83 |
| CSL.H | Comstock Mtl | 0.025 | 67% | -17% | -17% | 0% | $ 741,799.63 |
| CN | Condor Resources Inc. | 0.43 | 2% | 10% | 110% | 353% | $ 60,675,067.44 |
| CQR | Conquest Resources Limited | 0.015 | 0% | 0% | -40% | -25% | $ 2,029,156.59 |
| CUR | Consolidated Uranium Inc. | 1.64 | -11% | -10% | 21% | -14% | $ 170,106,802.40 |
| C | Contact Gold Corp. | 0.015 | 0% | 0% | -25% | -40% | $ 5,284,599.56 |
| CPAU | Copaur Minerals Inc. | 0.44 | -1% | -11% | -4% | -20% | $ 26,718,299.96 |
| CUU | Copper Fox Metals Inc. | 0.16 | 3% | -14% | -33% | -3% | $ 90,568,856.90 |
| CPL | Copper Lake Resources Ltd. | 0.025 | 0% | 0% | -50% | -67% | $ 4,732,715.40 |
| CRD | Copper Road Resources Inc. | 0.1 | 0% | 0% | 18% | -17% | $ 5,521,495.10 |
| CPER | CopperCorp Resources Inc. | 0.075 | -12% | -42% | -53% | -42% | $ 4,966,902.38 |
| CDB | Cordoba Minerals Corp. | 0.305 | -12% | -3% | -36% | -20% | $ 27,367,442.30 |
| CUSN | Cornish Metals Inc. | 0.175 | -8% | 6% | -20% | -26% | $ 93,672,374.60 |
| CSO | Corsa Coal Corp. | 0.44 | -7% | -39% | 22% | 69% | $ 47,214,676.60 |
| CRTS | Cortus Metals Inc. | 0.005 | 0% | -50% | -50% | -67% | $ 475,226.69 |
| CRE | Critical Elements Lithium Corporation | 1.32 | -8% | -19% | -43% | -43% | $ 287,476,596.00 |
| VLX | Velox Energy Materials Inc. | 0.045 | -25% | -31% | -10% | 80% | $ 10,103,635.40 |
| DMR | Damara Gold Corp. | 0.02 | 0% | 0% | -43% | -33% | $ 1,470,307.78 |
| DEC | Decade Resources Ltd. | 0.14 | -22% | -10% | 47% | 47% | $ 12,400,181.36 |
| KRY | Koryx Copper Inc. | 0.045 | -10% | 0% | -40% | -40% | $ 9,087,808.32 |
| DEFN | Defense Metals Corp. | 0.17 | -8% | -13% | -36% | -26% | $ 44,761,424.93 |
| DEF | Defiance Silver Corp. | 0.09 | -5% | -22% | -50% | -50% | $ 20,610,199.62 |
| DLTA | Delta Resources Limited | 0.105 | 0% | -25% | -78% | 11% | $ 10,163,848.80 |
| DSLV | Denarius Metals Corp. | 0.45 | 30% | 20% | -13% | -40% | $ 28,425,613.50 |
| DAU | Desert Gold Ventures Inc. | 0.04 | 0% | 14% | -47% | -50% | $ 7,818,655.44 |
| DFR | DFR Gold Inc. | 0.06 | -8% | -8% | -25% | -56% | $ 10,900,251.12 |
| DMI | Diamcor Mining Inc. | 0.08 | 0% | -16% | -33% | -58% | $ 10,281,034.96 |
| DNO | Dinero Ventures Ltd. | 0.15 | 0% | 0% | 25% | 0% | $ 3,330,000.00 |
| DOS | Dios Exploration Inc. | 0.06 | -14% | -20% | 0% | 0% | $ 7,276,923.96 |
| DHR | Discovery Harbour Resources Corp. | 0.06 | 0% | 20% | -40% | 20% | $ 519,802.91 |
| DCY | Discovery-Corp Enterprises Inc. | 0.07 | 0% | 0% | 0% | 0% | $ 855,196.72 |
| DCOP | District Copper Corp. | 0.05 | -23% | -50% | -29% | -9% | $ 912,208.05 |
| DMX | District Metals Corp. | 0.18 | 0% | -10% | 71% | 227% | $ 18,721,623.73 |
| DG | Dixie Gold Inc. | 0.18 | -20% | 177% | 100% | 227% | $ 4,632,693.84 |
| DLP | DLP Resources Inc. | 0.42 | -1% | -6% | -19% | 79% | $ 42,696,550.68 |
| DV | Dolly Varden Silver Corporation | 0.8 | 0% | 5% | -14% | 33% | $ 206,292,244.23 |
| DCMC | Dore Copper Mining Corp. | 0.15 | -9% | -25% | -25% | -54% | $ 14,681,114.85 |
| DBG | Doubleview Gold Corp. | 0.5 | -12% | -19% | 16% | -7% | $ 94,362,593.43 |
| DGO | Durango Resources Inc. | 0.015 | -25% | -25% | -73% | -73% | $ 1,884,137.44 |
| DYG | Dynasty Gold Corp. | 0.18 | -10% | 0% | -39% | 140% | $ 11,002,393.98 |
| ETU | E2Gold Inc. | 0.02 | 0% | 0% | -33% | -33% | $ 4,629,129.98 |
| ETL | E3 Lithium Ltd. | 2.87 | 6% | -7% | 6% | 37% | $ 214,767,544.39 |
| EPL | Eagle Plains Resources Ltd. | 0.13 | 8% | 18% | -61% | -30% | $ 14,360,544.51 |
| EAM | East Africa Metals Inc. | 0.095 | -10% | -5% | -21% | -34% | $ 19,406,622.42 |
| ETF | Eastfield Resources Ltd. | 0.025 | -17% | 0% | -38% | -50% | $ 1,389,039.63 |
| EDDY | Edison Lithium Corp. | 0.2 | -17% | -9% | -44% | -55% | $ 2,910,783.20 |
| EDM | EDM Resources Inc. | 0.14 | 8% | -10% | -69% | -72% | $ 3,675,160.02 |
| EGR | EGR Exploration Ltd. | 0.035 | -13% | -30% | -71% | -50% | $ 1,406,972.07 |
| ERA | Elcora Advanced Materials Corp. | 0.035 | 17% | 0% | -56% | -13% | $ 5,893,195.46 |
| ELBM | Electra Battery Materials Corporation | 0.73 | 6% | 11% | -71% | -79% | $ 25,921,957.63 |
| ELEC | Electric Royalties Ltd. | 0.185 | -26% | -5% | -42% | -29% | $ 17,388,271.62 |
| ECU | Element 29 Resources Inc. | 0.12 | 4% | -23% | -40% | -45% | $ 12,749,833.56 |
| ELE | Elemental Altus Royalties Corp. | 1.13 | -3% | 0% | -16% | -13% | $ 223,429,046.88 |
| ELVT | Elevation Gold Mining Corporation | 0.085 | -19% | 0% | -45% | -47% | $ 9,398,700.58 |
| EMR | Emergent Metals Corp. | 0.09 | 6% | -5% | -40% | -68% | $ 2,628,780.30 |
| EMO | Emerita Resources Corp. | 0.315 | 0% | -5% | -61% | -62% | $ 71,606,104.92 |
| EMNT | Eminent Gold Corp. | 0.19 | -17% | -49% | -53% | -62% | $ 9,438,427.08 |
| EP | Empire Metals Corp. | 0.1 | -9% | -9% | 0% | 5% | $ 9,829,892.50 |
| EMPR | Empress Royalty Corp. | 0.26 | -4% | -7% | -19% | -24% | $ 31,324,435.77 |
| EMX | EMX Royalty Corporation | 2.25 | -5% | -9% | -16% | -13% | $ 252,000,000.00 |
| EU | Encore Energy Corp. | 4.53 | 3% | 7% | 43% | 39% | $ 729,330,000.00 |
| EDG | Endurance Gold Corporation | 0.18 | -5% | -12% | -39% | -54% | $ 27,024,487.56 |
| ENDR | Enduro Metals Corporation | 0.045 | 0% | -10% | -47% | -71% | $ 10,844,772.44 |
| ENEV | Enerev5 Metals Inc. | 0.015 | 50% | 50% | 0% | -25% | $ 3,616,240.77 |
| EAU | Engineer Gold Mines Ltd. | 0.04 | 0% | 0% | -33% | -60% | $ 1,044,061.32 |
| EGM | Engold Mines Ltd. | 0.035 | 17% | -13% | -42% | -56% | $ 1,301,354.11 |
| EON | EON Lithium Corp. | 0.045 | -10% | -10% | -47% | -73% | $ 782,003.57 |
| EQTY | Equity Metals Corporation | 0.085 | -11% | -19% | -47% | 21% | $ 13,320,491.22 |
| ERC | Eros Resources Corp. | 0.035 | 0% | -13% | -36% | -30% | $ 3,426,280.94 |
| ESK | Eskay Mining Corp. | 0.365 | 0% | -39% | -38% | -71% | $ 65,065,721.67 |
| OPTG | Optegra Ventures Inc. | 0.035 | -13% | -71% | -77% | -77% | $ 308,625.80 |
| REE | E-Tech Resources Inc. | 0.035 | 17% | -30% | -50% | -65% | $ 3,312,336.90 |
| EMN | Euro Manganese Inc. | 0.1 | -5% | -13% | -52% | -63% | $ 38,253,576.57 |
| EUP | Europacific Metals Inc. | 0.03 | 0% | 20% | 0% | 100% | $ 1,580,014.89 |
| EVX | European Electric Metals Inc. | 0.48 | 0% | 0% | 0% | 129% | $ 24,145,325.76 |
| EVNI | EV Nickel Inc. | 0.13 | 24% | 136% | -10% | 8% | $ 12,133,928.39 |
| EVER | Evergold Corp. | 0.055 | 10% | 10% | 0% | 0% | $ 6,838,514.98 |
| EXG | ExGen Resources Inc. | 0.09 | 6% | 6% | -10% | -28% | $ 5,750,371.26 |
| FUU | F3 Uranium Corp. | 0.31 | -15% | -24% | -14% | 313% | $ 128,692,611.67 |
| FCO | Fabled Silver Gold Corp. | 0.07 | 0% | 0% | 0% | -65% | $ 3,016,253.10 |
| FAIR | Fairchild Gold Corp. | 0.04 | 0% | 0% | -33% | -43% | $ 1,103,093.44 |
| FPC | Falco Resources Ltd. | 0.13 | 0% | 8% | 13% | -28% | $ 35,305,124.27 |
| FG | Falcon Gold Corp. | 0.035 | -13% | 40% | -42% | -68% | $ 4,531,264.29 |
| FNC | Fancamp Exploration Ltd. | 0.085 | 0% | 6% | -23% | 0% | $ 15,004,055.16 |
| FMN | Fidelity Minerals Corp. | 0.06 | 33% | 9% | -37% | -14% | $ 5,147,712.54 |
| FYL | Finlay Minerals Ltd. | 0.025 | -38% | 25% | -29% | -69% | $ 3,452,780.80 |
| FFOX | Firefox Gold Corp. | 0.04 | -11% | -20% | -50% | -53% | $ 5,263,337.03 |
| FWZ | Fireweed Metals Corp. | 0.94 | -14% | -24% | 8% | 45% | $ 137,612,801.00 |
| FEX | Fjordland Exploration Inc. | 0.025 | 25% | -17% | -17% | -17% | $ 2,073,388.28 |
| FLYN | Flying Nickel Mining Corp. | 0.095 | 6% | 6% | -30% | -30% | $ 7,946,035.79 |
| FMS | Focus Graphite Inc. | 0.19 | -12% | -5% | -39% | 52% | $ 10,716,051.37 |
| FKM | Fokus Mining Corporation | 0.045 | 13% | 13% | -50% | -31% | $ 4,997,675.70 |
| FTJ | Fort St. James Nickel Corp. | 0.07 | 0% | -26% | -53% | 40% | $ 1,837,378.34 |
| FOR | Fortune Bay Corp. | 0.175 | -3% | -33% | -24% | -42% | $ 7,509,909.58 |
| FMC | Forum Energy Metals Corp. | 0.12 | -14% | -20% | 41% | 14% | $ 26,925,494.28 |
| GPAC | Great Pacific Gold Corp. | 0.54 | 1% | 66% | -4% | 74% | $ 44,732,436.72 |
| FDR | Founders Metals Inc. | 0.87 | -16% | 7% | 142% | 335% | $ 43,087,947.12 |
| FPX | FPX Nickel Corp. | 0.31 | -3% | -15% | -33% | -23% | $ 84,903,186.26 |
| FRED | Fredonia Mining Inc. | 0.05 | -9% | -23% | -57% | -17% | $ 8,857,772.20 |
| FMAN | Freeman Gold Corp. | 0.11 | -12% | -19% | -48% | -42% | $ 14,492,663.24 |
| FRI | Freeport Resources Inc. | 0.02 | 0% | -33% | -50% | -33% | $ 3,146,536.44 |
| FRE | Fremont Gold Ltd. | 0.065 | -32% | -32% | -50% | -68% | $ 1,999,471.31 |
| FL | Frontier Lithium Inc. | 0.89 | 19% | -14% | -56% | -56% | $ 202,588,066.49 |
| FGC | Frontline Gold Corporation | 0.02 | 0% | 0% | 0% | 33% | $ 2,617,073.46 |
| FMM | Full Metal Minerals Ltd. | 0.035 | 0% | -42% | -30% | -30% | $ 2,075,935.96 |
| FUSE | Fuse Battery Metals Inc. | 0.04 | 0% | -11% | -20% | -43% | $ 7,517,952.04 |
| GMIN | G Mining Ventures Corp. | 1.2 | -2% | 5% | 4% | 82% | $ 537,020,472.00 |
| GETT | G.E.T.T. Gold Inc. | 0.005 | 0% | 0% | -50% | -67% | $ 1,070,231.55 |
| GTWO | G2 Goldfields Inc. | 0.83 | 2% | -2% | -8% | 28% | $ 136,713,549.60 |
| GBU | Gabriel Resources Ltd. | 0.38 | -14% | -14% | 31% | 83% | $ 406,850,000.00 |
| GAL | Galantas Gold Corporation | 0.225 | 13% | 13% | -32% | -62% | $ 23,789,677.56 |
| GGO | Galleon Gold Corp. | 0.11 | -12% | -8% | -56% | -31% | $ 6,986,614.25 |
| GRI | Galore Resources Inc. | 0.01 | -33% | -33% | -50% | -50% | $ 3,314,628.60 |
| MTK | Montauk Metals Inc. | 0.035 | 17% | 75% | -50% | -59% | $ 1,456,979.27 |
| GWM | Galway Metals Inc. | 0.245 | -9% | -2% | -55% | -74% | $ 18,726,540.00 |
| GGI | Garibaldi Resources Corp. | 0.095 | -10% | -14% | -32% | -63% | $ 13,730,285.30 |
| GEN | Generation Gold Corp. | 0.06 | 33% | -25% | -25% | -52% | $ 697,459.92 |
| GENI | Genius Metals Inc. | 0.045 | -10% | -18% | -25% | -25% | $ 4,395,885.44 |
| GSP | Gensource Potash Corporation | 0.09 | -5% | -22% | -28% | -45% | $ 40,480,574.76 |
| GMA | Geomega Resources Inc. | 0.14 | 4% | 0% | -26% | -10% | $ 19,960,712.94 |
| GTC | Getty Copper Inc. | 0.05 | 0% | -9% | 67% | 43% | $ 6,094,560.25 |
| GFG | GFG Resources Inc. | 0.08 | 7% | 0% | -30% | -20% | $ 17,036,094.80 |
| GGL | GGL Resources Corp. | 0.04 | -11% | -20% | -27% | -60% | $ 3,194,299.00 |
| GGX | GGX Gold Corp. | 0.04 | -11% | -20% | -33% | 14% | $ 1,442,149.24 |
| GIGA | Giga Metals Corporation | 0.2 | -15% | -20% | -29% | -34% | $ 19,580,825.60 |
| GIT | Gitennes Exploration Inc. | 0.015 | 0% | -25% | -40% | -25% | $ 967,156.83 |
| EMM | Giyani Metals Corp. | 0.125 | -14% | -19% | -11% | -46% | $ 26,337,371.40 |
| NIKL | GK Resources Ltd. | 0.07 | 0% | -30% | -52% | -30% | $ 1,218,714.77 |
| GLI | Glacier Lake Resources Inc. | 0.075 | 0% | 0% | -6% | 7% | $ 1,623,941.55 |
| GLAD | Gladiator Metals Corp. | 0.3 | -14% | -12% | -48% | 50% | $ 12,252,443.10 |
| GER | Glen Eagle Resources Inc. | 0.01 | 0% | -33% | -33% | -67% | $ 1,458,019.85 |
| GBML | Global Battery Metals Ltd. | 0.115 | -4% | 0% | -18% | 21% | $ 8,639,320.80 |
| GEMC | Global Energy Metals Corporation | 0.05 | 0% | 0% | -33% | -41% | $ 2,296,106.35 |
| GMV | GMV Minerals Inc. | 0.2 | 11% | 8% | 38% | 111% | $ 16,839,230.66 |
| GG | Golconda Gold Ltd. | 0.11 | -4% | 10% | -57% | -72% | $ 7,840,063.88 |
| GXX | Gold Basin Resources Corporation | 0.13 | 8% | -16% | -42% | -16% | $ 14,938,323.79 |
| GBRC | Gold Bull Resources Corp. | 0.365 | -8% | 33% | -54% | -19% | $ 3,737,180.68 |
| GLDL | Gold Line Resources Ltd. | 0.095 | -10% | 0% | -14% | -59% | $ 4,491,041.88 |
| GRZ | Gold Reserve Inc. | 3.07 | 1% | -13% | 83% | 98% | $ 305,611,469.70 |
| YGT | Gold Terra Resource Corp. | 0.07 | 27% | 17% | -33% | -60% | $ 19,684,173.88 |
| AUU | Gold79 Mines Ltd. | 0.015 | -25% | -40% | -57% | -57% | $ 2,869,478.69 |
| GLB | Goldbank Mining Corporation | 0.1 | 5% | 54% | 11% | 67% | $ 14,317,265.50 |
| GCN | Goldcliff Resource Corporation | 0.025 | 0% | -17% | -44% | -44% | $ 1,681,447.68 |
| GRG | Golden Arrow Resources Corporation | 0.06 | -8% | -14% | -50% | -57% | $ 7,612,595.76 |
| GCC | Golden Cariboo Resources Ltd. | 0.03 | 0% | -14% | -63% | -50% | $ 1,306,020.39 |
| GNG | Golden Goliath Resources Ltd. | 0.07 | 0% | -18% | -50% | -67% | $ 1,908,609.30 |
| GHR.H | Glden Harp | 0.09 | 0% | -25% | 13% | -10% | $ 2,697,073.74 |
| GDP | Golden Pursuit Resources Ltd. | 0.12 | 0% | -4% | -43% | -4% | $ 4,679,136.00 |
| GLDN | Golden Ridge Resources Ltd. | 0.06 | 20% | -14% | -8% | 0% | $ 3,506,479.20 |
| GSH | Golden Share Resources Corporation | 0.045 | 0% | 0% | 0% | -31% | $ 2,168,385.53 |
| AUEN | Golden Sky Minerals Corp. | 0.12 | 4% | 9% | -38% | -33% | $ 2,360,953.56 |
| SVRS | Silver Storm Mining Ltd. | 0.095 | -5% | -5% | -44% | -42% | $ 35,742,677.40 |
| GDX | Goldex Resources Corporation | 0.08 | 0% | 7% | 0% | 45% | $ 1,568,283.12 |
| GOFL | Goldflare Exploration Inc. | 0.025 | 25% | 25% | -44% | -50% | $ 2,019,785.82 |
| GHL | Goldhills Holding Ltd. | 0.04 | 0% | 0% | 14% | -38% | $ 926,746.92 |
| GLD | GoldON Resources Ltd. | 0.035 | -30% | -13% | -65% | -68% | $ 1,086,608.60 |
| GQC | GoldQuest Mining Corp. | 0.08 | 7% | 14% | -33% | -52% | $ 19,458,178.80 |
| GSHR | Goldshore Resources Inc. | 0.1 | 11% | -17% | -62% | -68% | $ 20,865,991.80 |
| GXS | Goldsource Mines Inc. | 0.23 | -30% | -8% | -36% | -38% | $ 13,753,236.40 |
| GMI | Green Mining Innovation Inc. | 0.14 | 27% | 65% | 75% | 180% | $ 8,510,894.00 |
| GSTM | Goldstorm Metals Corp. | 0.18 | -5% | 0% | -25% | 0% | $ 11,565,122.22 |
| GOT | Goliath Resources Limited | 0.78 | -3% | -3% | 18% | -49% | $ 78,772,370.82 |
| GSS | Gossan Resources Limited | 0.03 | -33% | -25% | -45% | -45% | $ 2,004,044.13 |
| GXU | GoviEx Uranium Inc. | 0.175 | 6% | 9% | 3% | -20% | $ 127,119,252.40 |
| GWA | Gowest Gold Ltd. | 0.06 | -33% | -29% | -65% | -8% | $ 29,693,048.40 |
| GPM | GPM Metals Inc. | 0.04 | 0% | 0% | -43% | -33% | $ 3,351,162.32 |
| GRSL | GR Silver Mining Ltd. | 0.055 | 0% | 38% | -39% | -59% | $ 14,914,751.83 |
| GGM | Granada Gold Mine Inc. | 0.015 | 0% | -40% | -63% | -50% | $ 1,588,308.35 |
| GPG | Grande Portage Resources Ltd. | 0.215 | -9% | 26% | -4% | 0% | $ 23,308,761.58 |
| GCX | Granite Creek Copper Ltd. | 0.035 | 0% | 0% | -42% | -42% | $ 5,626,871.18 |
| GEL | Graphano Energy Ltd. | 0.1 | -9% | 11% | -39% | -59% | $ 1,794,268.14 |
| GPH | Graphite One Inc. | 0.99 | 0% | -12% | -32% | -13% | $ 126,576,937.92 |
| GRAT | Gratomic Inc. | 0.175 | -10% | -3% | -39% | -56% | $ 35,866,047.06 |
| GR | Great Atlantic Resources Corp. | 0.03 | 0% | 0% | -14% | -25% | $ 1,503,769.98 |
| GQ | Great Quest Fertilizer Ltd. | 0.01 | 0% | 0% | 0% | 0% | $ 848,460.82 |
| GEM | Green Battery Minerals Inc. | 0.05 | -17% | 11% | -33% | 11% | $ 4,304,432.20 |
| GCOM | Green Shift Commodities Ltd. | 0.08 | 7% | -27% | -24% | -43% | $ 6,226,273.17 |
| VGN | Greencastle Resources Ltd. | 0.055 | 0% | -8% | -8% | -27% | $ 2,201,246.91 |
| GRDM | Grid Metals Corp. | 0.115 | -4% | 0% | -18% | -41% | $ 21,049,885.68 |
| GZD | Grizzly Discoveries Inc. | 0.045 | -18% | -40% | -55% | -59% | $ 7,482,205.95 |
| GVR | Grosvenor Resource Corporation | 0.07 | 0% | 0% | -18% | 8% | $ 1,883,048.72 |
| GRD | Grounded Lithium Corp. | 0.1 | 0% | -29% | -62% | -71% | $ 7,278,317.94 |
| ZNG | Group Eleven Resources Corp. | 0.09 | -10% | -14% | 0% | 38% | $ 16,621,975.96 |
| GSPR | GSP Resource Corp. | 0.13 | 8% | -24% | -10% | 63% | $ 2,986,610.55 |
| GSVR | Guanajuato Silver Company Ltd. | 0.28 | -5% | -3% | -45% | -40% | $ 94,524,091.23 |
| GUG | Gungnir Resources Inc. | 0.035 | 17% | -13% | -46% | -61% | $ 4,187,042.51 |
| GUN | Gunpoint Exploration Ltd. | 0.47 | 0% | -6% | -16% | -10% | $ 23,920,618.51 |
| GYA | Guyana Goldstrike Inc. | 0.125 | 0% | 0% | 0% | 0% | $ 4,850,332.00 |
| HPM | Halcones Precious Metals Corp. | 0.06 | -29% | -8% | 33% | -33% | $ 9,073,202.16 |
| HCC | Hanna Capital Corp. | 0.015 | 0% | 0% | 0% | -25% | $ 851,592.26 |
| HAN | Hannan Metals Ltd. | 0.185 | 12% | -3% | -36% | -40% | $ 20,788,198.11 |
| HANS | Hanstone Gold Corp. | 0.035 | -22% | -50% | -63% | -36% | $ 1,786,509.38 |
| HPY | Happy Creek Minerals Ltd. | 0.065 | 18% | 63% | 86% | 86% | $ 8,621,727.08 |
| HAR | Harfang Exploration inc. | 0.14 | -3% | 0% | -39% | -28% | $ 8,215,945.56 |
| HVG | Harvest Gold Corp. | 0.025 | 25% | 25% | 0% | -17% | $ 979,140.70 |
| HAWK | Hawkeye Gold & Diamond Inc. | 0.045 | 13% | 0% | -18% | -70% | $ 441,897.89 |
| HSTR | Heliostar Metals Ltd. | 0.275 | 4% | 6% | -47% | 38% | $ 45,840,474.90 |
| DTWO | D2 Lithium Corp. | 0.1 | 18% | -13% | -64% | -82% | $ 3,623,180.40 |
| HMLO | Hemlo Explorers Inc. | 0.06 | 0% | 0% | -25% | 9% | $ 3,043,495.20 |
| BIG | Hercules Silver Corp. | 1.15 | 24% | 265% | 461% | 1178% | $ 223,216,452.45 |
| HBK | Highbank Resources Ltd. | 0.02 | 0% | -20% | -33% | -60% | $ 448,356.32 |
| HIGH | Highgold Mining Inc. | 0.295 | -11% | -17% | -62% | -56% | $ 25,889,444.26 |
| HI | Highland Copper Company Inc. | 0.07 | 17% | -7% | -7% | -18% | $ 51,545,453.33 |
| HWY | Highway 50 Gold Corp. | 0.1 | 5% | -23% | -29% | -17% | $ 4,577,421.40 |
| ESPN | Hispania Resources Inc. | 0.155 | 0% | 15% | 7% | 63% | $ 9,069,074.65 |
| HMR | Homerun Resources Inc. | 0.64 | -9% | -12% | 49% | 611% | $ 31,187,536.00 |
| TUF | Honey Badger Silver Inc. | 0.075 | -6% | -6% | -55% | -74% | $ 3,007,611.83 |
| HCU | Horizon Copper Corp. | 0.64 | 2% | 0% | 7% | 7% | $ 55,304,161.28 |
| HCH | Hot Chili Limited | 0.98 | 7% | -4% | 14% | 18% | $ 117,056,301.88 |
| HUD | Hudson Resources Inc. | 0.025 | 0% | 0% | -17% | -29% | $ 4,541,063.45 |
| HMAN | Huntsman Exploration Inc. | 0.03 | 20% | 20% | -63% | -70% | $ 471,742.80 |
| ICM | Iconic Minerals Ltd. | 0.04 | 0% | 14% | -53% | -62% | $ 5,900,362.04 |
| IRI | IEMR Resources Inc. | 0.01 | 0% | 0% | -33% | -33% | $ 948,071.41 |
| ILI | Imagine Lithium Inc. | 0.05 | 11% | -17% | -41% | -33% | $ 15,242,041.65 |
| IMR | iMetal Resources Inc. | 0.065 | 0% | -24% | -65% | -58% | $ 3,307,204.10 |
| IPT | IMPACT Silver Corp. | 0.205 | -9% | -9% | -36% | -43% | $ 39,562,224.51 |
| IPG | Imperial Mining Group Ltd. | 0.05 | 25% | -17% | -38% | -38% | $ 10,308,641.30 |
| INCA | Inca One Gold Corp. | 0.14 | -10% | -7% | -22% | -32% | $ 5,698,082.46 |
| IGO | Independence Gold Corp. | 0.18 | -10% | 29% | 20% | 227% | $ 27,740,000.00 |
| IXI | Indigo Exploration Inc. | 0.06 | -14% | -40% | -74% | 140% | $ 4,267,771.30 |
| INFD | Infield Minerals Corp. | 0.015 | 0% | 0% | -25% | -50% | $ 487,827.31 |
| INFI | Infinitum Copper Corp. | 0.025 | 0% | -29% | -55% | -75% | $ 1,833,451.00 |
| MINE | Inomin Mines Inc. | 0.035 | 0% | -13% | -50% | -30% | $ 1,340,974.32 |
| ITR | Integra Resources Corp. | 0.97 | -1% | -9% | -43% | -56% | $ 68,089,755.69 |
| ICON | International Iconic Gold Exploration Co | 0.01 | -33% | -33% | -50% | -60% | $ 1,013,254.32 |
| ILC | International Lithium Corp. | 0.04 | 14% | 0% | -27% | -38% | $ 9,943,463.52 |
| IMM | International Metals Mining Corp. | 0.15 | -14% | -9% | -21% | 50% | $ 4,219,109.40 |
| IZZ | International Prospect Ventures Ltd. | 0.03 | 0% | 0% | -25% | -33% | $ 1,534,853.94 |
| IZ | International Zeolite Corp. | 0.045 | 0% | -10% | -57% | -68% | $ 1,908,313.29 |
| IRO | Inter-Rock Minerals Inc. | 0.69 | 0% | -1% | -8% | 15% | $ 15,251,284.59 |
| INTR | Intrepid Metals Corp. | 0.21 | -11% | -16% | 45% | 35% | $ 10,366,255.62 |
| IVS | Inventus Mining Corp. | 0.045 | -10% | 0% | -40% | 0% | $ 7,558,420.68 |
| IZN | InZinc Mining Ltd. | 0.02 | 0% | -20% | -33% | -60% | $ 2,468,041.68 |
| ION | Lithium ION Energy Ltd. | 0.1 | -5% | -38% | -70% | -43% | $ 6,071,603.40 |
| ISO | IsoEnergy Ltd. | 3.44 | -8% | -11% | 27% | -2% | $ 381,840,000.00 |
| IFOS | Itafos Inc. | 1.39 | 9% | 5% | -21% | -28% | $ 254,068,185.12 |
| JADE | Jade Leader Corp. | 0.015 | 0% | 0% | -63% | -63% | $ 973,234.40 |
| JG | Japan Gold Corp. | 0.08 | 7% | -6% | -54% | -71% | $ 17,956,083.53 |
| JAX | Jaxon Mining Inc. | 0.015 | 0% | 0% | -50% | -57% | $ 2,520,054.78 |
| JDN | Jayden Resources Inc. | 0.075 | 0% | -21% | -32% | -50% | $ 4,388,838.68 |
| JRV | Jervois Global Limited | 0.035 | 17% | 17% | -61% | -92% | $ 94,588,223.98 |
| CLM | Consolidated Lithium Metals Inc. | 0.05 | -9% | -9% | -38% | -47% | $ 16,409,537.45 |
| JUB | Jubilee Gold Exploration Ltd. | 0.44 | 0% | 0% | 0% | -42% | $ 3,503,094.32 |
| JUGR | Juggernaut Exploration Ltd. | 0.125 | 0% | -22% | -17% | 39% | $ 7,818,681.50 |
| JZR | JZR Gold Inc. | 0.205 | -27% | -5% | -65% | -63% | $ 8,665,476.28 |
| KTO | K2 Gold Corporation | 0.095 | -24% | -21% | -39% | -14% | $ 9,315,871.00 |
| KNC | K9 Gold Corp. | 0.025 | 0% | 0% | -38% | -62% | $ 2,253,400.18 |
| KRL | Kainantu Resources Ltd. | 0.025 | 25% | -38% | -72% | -75% | $ 2,535,698.90 |
| KZD | Kaizen Discovery Inc. | 0.1 | -23% | -26% | -33% | -17% | $ 6,594,299.20 |
| KALO | Kalo Gold Corp. | 0.02 | 0% | -20% | -67% | -64% | $ 2,384,911.00 |
| KAPA | Kapa Gold Inc. | 0.05 | 11% | -23% | -44% | 25% | $ 2,790,537.20 |
| KEN.H | Kenadyr Mtls | 0.015 | -50% | -67% | -67% | -67% | $ 177,059.33 |
| KLD | Kenorland Minerals Ltd. | 0.59 | -7% | -8% | -22% | -14% | $ 37,500,694.41 |
| KLM | Kermode Resources Ltd. | 0.02 | 0% | -56% | -80% | -87% | $ 654,630.43 |
| KES | Kesselrun Resources Ltd. | 0.03 | -14% | 50% | -25% | -63% | $ 2,822,155.11 |
| KGC | Kestrel Gold Inc. | 0.025 | 25% | 0% | -44% | -50% | $ 2,565,358.40 |
| KIB | Kiboko Gold Inc. | 0.065 | 0% | 8% | -52% | -57% | $ 2,868,911.05 |
| KCC | Kincora Copper Limited | 0.03 | 20% | 20% | -63% | -45% | $ 6,215,206.23 |
| KING | King Global Ventures Inc. | 0.36 | 0% | 9% | 11% | -28% | $ 2,561,334.84 |
| KFR | Kingfisher Metals Corp. | 0.055 | 0% | -27% | -35% | -54% | $ 7,182,238.31 |
| KGS | Kingman Minerals Ltd. | 0.14 | 27% | 8% | 0% | 12% | $ 970,942.14 |
| KNG | Kingsmen Resources Ltd. | 0.16 | -18% | -11% | -47% | 7% | $ 3,095,987.04 |
| KTR | Kintavar Exploration Inc. | 0.015 | -25% | -40% | -70% | -63% | $ 1,928,356.92 |
| KIP | Kiplin Metals Inc. | 0.105 | -13% | -16% | -76% | -84% | $ 7,983,963.54 |
| KG | Klondike Gold Corp. | 0.085 | 0% | 13% | -23% | -32% | $ 14,409,859.84 |
| KS | Klondike Silver Corp. | 0.025 | 0% | -17% | -38% | -50% | $ 6,704,802.68 |
| KRI | Kobo Resources Inc. | 0.3 | -13% | -5% | 7% | 20% | $ 24,353,514.90 |
| KDK | Kodiak Copper Corp. | 0.59 | -2% | 4% | -23% | -20% | $ 38,356,234.80 |
| KTN | Kootenay Silver Inc. | 0.085 | -11% | 21% | -15% | -32% | $ 38,901,867.81 |
| KORE | Kore Mining Ltd. | 0.05 | 0% | 0% | 25% | 43% | $ 9,082,186.07 |
| KC | Kutcho Copper Corp. | 0.095 | 0% | -21% | -57% | -58% | $ 13,349,086.41 |
| LAB | Labrador Gold Corp. | 0.135 | 0% | -16% | -29% | -53% | $ 22,101,297.27 |
| LG | Lahontan Gold Corp. | 0.055 | -8% | -8% | -69% | -21% | $ 8,179,759.56 |
| LRA | Lara Exploration Ltd. | 0.6 | 2% | -2% | -24% | -29% | $ 27,480,608.40 |
| LMS | Latin Metals Inc. | 0.07 | -13% | -26% | -61% | -44% | $ 5,003,337.57 |
| LME | Laurion Mineral Exploration Inc. | 0.45 | -8% | -21% | 22% | -24% | $ 118,505,745.90 |
| LGC | Lavras Gold Corp. | 1.09 | -4% | -20% | 230% | 166% | $ 55,890,312.44 |
| LEM | Leading Edge Materials Corp. | 0.155 | 3% | 11% | -14% | -21% | $ 27,153,086.14 |
| LVX | Leviathan Gold Ltd. | 0.145 | 16% | 45% | -28% | -28% | $ 2,891,991.07 |
| LILI | Li3 Lithium Corp. | 0.045 | 13% | -10% | -71% | -65% | $ 1,706,523.21 |
| LBC | Libero Copper & Gold Corporation | 0.025 | -17% | -44% | -79% | -84% | $ 3,692,223.09 |
| LMG | Lincoln Gold Mining Inc. | 0.17 | -26% | -23% | -47% | -66% | $ 2,337,956.96 |
| LEO | Lion Copper and Gold Corp. | 0.08 | 0% | 0% | -6% | 14% | $ 24,773,438.00 |
| LIO | Lion One Metals Limited | 0.84 | -1% | -10% | 2% | 2% | $ 175,372,204.85 |
| ROAR | Lion Rock Resources Inc. | 0.15 | 15% | -12% | 36% | -25% | $ 4,720,302.75 |
| LITH | Lithium Chile Inc. | 0.61 | -3% | -12% | -18% | -8% | $ 125,796,735.77 |
| LEXI | Lithium Energi Exploration Inc. | 0.13 | -4% | -13% | -43% | -33% | $ 19,301,007.83 |
| LTH | Lithium Ionic Corp. | 1.36 | -24% | -20% | -53% | -23% | $ 186,550,497.90 |
| LONE | Lithium One Metals Inc. | 0.07 | -33% | -60% | -83% | -80% | $ 5,565,112.91 |
| LIS | Lithium South Development Corporation | 0.33 | 14% | -16% | -51% | -32% | $ 31,976,848.86 |
| LBNK | LithiumBank Resources Corp. | 0.92 | 21% | -7% | -22% | 15% | $ 41,753,474.49 |
| LSTR | Lodestar Battery Metals Corp | 0.035 | 0% | -13% | -30% | -59% | $ 1,551,777.50 |
| LMR | Lomiko Metals Inc. | 0.025 | 0% | 25% | 0% | -17% | $ 9,585,791.15 |
| LEX | Longhorn Exploration Corp. | 0.15 | 0% | -12% | -12% | 7% | $ 1,267,200.00 |
| LA | Los Andes Copper Ltd. | 11.81 | 1% | -2% | -7% | -15% | $ 348,783,466.33 |
| LUCA | Luca Mining Corp. | 0.225 | 0% | -6% | -46% | -72% | $ 33,302,439.15 |
| LKY | Lucky Minerals Inc. | 0.01 | 100% | 0% | -67% | -71% | $ 2,022,540.83 |
| LUM | Lumina Gold Corp. | 0.38 | -1% | 7% | -36% | 17% | $ 158,019,533.26 |
| LR | Luminex Resources Corp. | 0.16 | -14% | -20% | -45% | -22% | $ 27,828,803.04 |
| LPK | Lupaka Gold Corp. | 0.085 | -6% | 31% | 6% | 0% | $ 1,702,361.64 |
| MT | M3 Metals Corp. | 0.5 | 0% | -17% | 14% | 75% | $ 5,137,362.00 |
| MMS | MacArthur Minerals Limited | 0.145 | -3% | -3% | -15% | 7% | $ 24,077,755.76 |
| BMK | MacDonald Mines Exploration Ltd. | 0.04 | 0% | -33% | -33% | -47% | $ 1,094,930.28 |
| MDM | Madoro Metals Corp. | 0.025 | 67% | -17% | -44% | -17% | $ 1,966,167.90 |
| NICU | Magna Mining Inc. | 0.49 | 3% | 1% | -40% | 1% | $ 79,892,441.02 |
| MTT | Magna Terra Minerals Inc. | 0.03 | -14% | 50% | -14% | -25% | $ 2,408,935.95 |
| MGI | Magnum Goldcorp Inc. | 0.01 | -33% | -33% | -67% | -60% | $ 386,195.83 |
| MJS | Majestic Gold Corp. | 0.095 | 27% | 46% | 6% | 58% | $ 99,053,116.20 |
| MKO | Mako Mining Corp. | 2.04 | 11% | 45% | -4% | 63% | $ 134,269,929.72 |
| MTH | Mammoth Resources Corp. | 0.015 | 0% | 0% | -50% | -25% | $ 1,009,946.30 |
| MN | Manganese X Energy Corp. | 0.095 | 6% | 0% | -49% | -51% | $ 12,897,567.18 |
| MNTR | Mantaro Precious Metals Corp. | 0.02 | 0% | 0% | -50% | -56% | $ 1,076,906.00 |
| MGM | Maple Gold Mines Ltd. | 0.055 | 0% | -8% | -71% | -68% | $ 18,677,121.49 |
| DIA | Margaret Lake Diamonds Inc. | 0.16 | 0% | 0% | -20% | -73% | $ 758,596.64 |
| MAE | Maritime Resources Corp. | 0.045 | -10% | 29% | 29% | -10% | $ 24,554,984.36 |
| MARV | Marvel Discovery Corp. | 0.05 | 0% | -9% | -33% | -60% | $ 6,241,928.20 |
| MAS | Mas Gold Corp. | 0.01 | 0% | 0% | -67% | -78% | $ 3,842,151.32 |
| MASS | Masivo Silver Corp. | 0.065 | -19% | -7% | -62% | -67% | $ 1,533,524.09 |
| MAX | MAX Resource Corp. | 0.135 | 13% | -10% | 0% | -60% | $ 21,854,383.88 |
| MFG | Mayfair Gold Corp. | 2.15 | 1% | 1% | 13% | 87% | $ 205,056,265.05 |
| MCS | McChip Resources Inc. | 0.7 | 0% | -15% | -21% | -1% | $ 3,997,067.20 |
| MDL | Medallion Resources Ltd. | 0.015 | 50% | 0% | -75% | -75% | $ 1,052,916.56 |
| MED | Medgold Resources Corp. | 0.005 | 0% | 0% | 0% | 0% | $ 673,945.16 |
| MCU | Mega Copper Ltd. | 0.12 | 0% | 0% | -4% | -20% | $ 5,100,900.00 |
| MKR | Melkior Resources Inc. | 0.085 | -23% | -26% | -67% | -59% | $ 2,664,979.25 |
| MERG | Metal Energy Corp. | 0.04 | 0% | 0% | -11% | -43% | $ 3,720,435.20 |
| MTX | Metalex Ventures Ltd. | 0.01 | -33% | 0% | -78% | -80% | $ 3,516,718.77 |
| MTA | Metalla Royalty & Streaming Ltd. | 3.75 | -9% | -3% | -44% | -46% | $ 198,148,226.25 |
| MMG | Metallic Minerals Corp. | 0.35 | -8% | -11% | -13% | 17% | $ 58,352,709.45 |
| MTS | Metallis Resources Inc. | 0.04 | -11% | 0% | -43% | -72% | $ 2,421,772.48 |
| WHE | Waroona Energy Inc. | 0.05 | 11% | 11% | 100% | 100% | $ 36,898,970.75 |
| MQM | Metalquest Mining Inc. | 0.05 | -17% | -17% | -60% | -20% | $ 1,345,739.40 |
| MEK | Metals Creek Resources Corp. | 0.025 | 25% | 25% | -17% | -29% | $ 3,946,086.65 |
| MEX | Mexican Gold Mining Corp. | 0.07 | -7% | -7% | -33% | -65% | $ 1,486,399.46 |
| MD | Midland Exploration Inc. | 0.44 | -2% | -14% | -23% | 24% | $ 36,264,886.68 |
| MMA | Midnight Sun Mining Corp. | 0.26 | -4% | 13% | 11% | 18% | $ 30,831,063.64 |
| MILL | Millbank Mining Corp. | 0.075 | 0% | 0% | -25% | -35% | $ 861,450.08 |
| MVM.H | MillenMin Ve | 0.05 | 0% | 0% | 0% | 0% | $ 2,105,000.00 |
| MLP | Millennial Potash Corp. | 0.2 | 0% | -20% | -55% | -45% | $ 10,383,600.00 |
| MSC | Millennium Silver Corp. | 0.005 | -50% | 0% | -50% | 0% | $ 1,107,526.13 |
| MGG | Minaurum Gold Inc. | 0.145 | 12% | 0% | -26% | -26% | $ 54,219,512.73 |
| MMM | Minco Capital Corp. | 0.065 | 0% | 0% | 0% | 44% | $ 2,868,312.27 |
| MAI | Minera Alamos Inc. | 0.27 | -5% | -8% | -29% | -33% | $ 121,026,515.31 |
| MHI | Mineral Hill Industries Ltd. | 0.11 | 0% | 0% | -12% | 57% | $ 2,345,728.77 |
| MMV | Mineral Mountain Resources Ltd. | 0.035 | -13% | -42% | -53% | -36% | $ 3,957,542.68 |
| MINK | Mink Ventures Corporation | 0.16 | -3% | -11% | 14% | 100% | $ 2,864,477.44 |
| MCI | Minnova Corp. | 0.02 | -20% | -20% | -67% | -67% | $ 1,397,763.52 |
| MSR | Minsud Resources Corp. | 1 | 5% | 33% | 6% | 300% | $ 164,090,694.00 |
| MNTO | Minto Metals Corp. | 0 | -100% | -100% | -100% | -100% | $ 64,167,137.76 |
| MRZ | Mirasol Resources Ltd. | 0.56 | -5% | 4% | -53% | -3% | $ 38,077,034.80 |
| MKA | Mkango Resources Ltd. | 0.13 | -4% | -13% | -24% | -35% | $ 32,948,964.62 |
| MMN | Monarca Minerals Inc. | 0.01 | 0% | 100% | -33% | 0% | $ 1,265,546.06 |
| MAU | Montage Gold Corp. | 0.64 | -2% | 23% | -14% | 8% | $ 116,553,080.70 |
| MON | Montero Mining and Exploration Ltd. | 0.15 | -6% | -36% | 150% | 400% | $ 5,603,885.33 |
| MMY | Monument Mining Limited | 0.12 | 9% | -4% | 20% | 85% | $ 39,264,588.36 |
| MNRL | Monumental Minerals Corp. | 0.04 | -11% | -20% | -60% | -80% | $ 2,303,493.08 |
| MOX | Morien Resources Corp. | 0.58 | -11% | 18% | 5% | -17% | $ 29,744,139.42 |
| MTB | MTB Metals Corp. | 0.105 | 0% | -25% | -13% | -13% | $ 11,335,805.50 |
| MLY | Multi-Metal Development Ltd. | 0.04 | 0% | 0% | 0% | 100% | $ 10,054,387.60 |
| MUN | Mundoro Capital Inc. | 0.17 | -3% | 0% | -29% | -11% | $ 18,165,972.30 |
| MUR | Murchison Minerals Ltd. | 0.025 | -17% | -29% | -62% | -71% | $ 7,232,895.66 |
| NMI | Namibia Critical Metals Inc. | 0.06 | -14% | -20% | -45% | -57% | $ 12,781,235.94 |
| NBM | NEO Battery Materials Ltd. | 0.37 | 0% | 0% | 37% | 185% | $ 37,636,639.02 |
| NGE | Nevada Exploration Inc. | 0.12 | 0% | -8% | -49% | -52% | $ 2,371,783.80 |
| NKG | Nevada King Gold Corp. | 0.385 | -9% | -13% | -18% | 43% | $ 104,744,240.64 |
| NEV | Nevada Sunrise Metals Corporation | 0.065 | 8% | -35% | -43% | -70% | $ 6,570,412.56 |
| NZN | Nevada Zinc Corporation | 0.025 | 0% | -17% | -38% | -38% | $ 2,531,489.38 |
| NAU | Nevgold Corp. | 0.31 | -3% | 11% | -18% | -23% | $ 23,222,568.55 |
| NAM | New Age Metals Inc. | 0.04 | 0% | -11% | -27% | -38% | $ 8,885,480.08 |
| NED | New Destiny Mining Corp. | 0.025 | -29% | 0% | 25% | 0% | $ 565,141.73 |
| ENRG | New Energy Metals Corp. | 0.025 | 25% | 0% | -89% | -58% | $ 886,169.18 |
| NFG | New Found Gold Corp. | 4.78 | -8% | -12% | -26% | -6% | $ 856,137,435.00 |
| NSE | New Stratus Energy Inc. | 0.65 | -3% | 5% | 155% | -24% | $ 81,172,425.18 |
| NEW | New Target Mining Corp. | 0.07 | -13% | -22% | -53% | -30% | $ 839,044.08 |
| NCAU | Newcore Gold Ltd. | 0.13 | -10% | 8% | -19% | -35% | $ 22,324,483.35 |
| NER | Newmac Resources Inc. | 0.285 | 0% | 0% | 0% | 0% | $ 2,769,071.97 |
| NEWO | NewOrigin Gold Corp. | 0.03 | 0% | -14% | -54% | -40% | $ 1,706,750.49 |
| NWX | Newport Exploration Ltd. | 0.265 | -2% | 2% | -2% | -30% | $ 27,978,666.61 |
| NRG | Newrange Gold Corp. | 0.09 | 0% | 0% | 0% | -50% | $ 3,397,843.80 |
| NGEX | NGEx Minerals Ltd. | 6.07 | 4% | 14% | -7% | 106% | $ 1,131,596,660.37 |
| NICN | NICAN Limited | 0.05 | -17% | 25% | -44% | -44% | $ 3,469,945.10 |
| NKL | Nickel 28 Capital Corp. | 0.84 | -8% | -10% | -44% | -11% | $ 76,133,574.34 |
| NNX | Nickel North Exploration Corp. | 0.015 | 0% | 50% | 0% | -57% | $ 1,506,532.46 |
| NIM | Nicola Mining Inc. | 0.15 | -9% | -12% | -14% | 67% | $ 48,095,564.85 |
| NIO | Nio Strategic Metals Inc. | 0.105 | -5% | -13% | -5% | 62% | $ 8,784,673.92 |
| NBY | Niobay Metals Inc. | 0.065 | -7% | 8% | -24% | -35% | $ 5,505,629.99 |
| NOAL | NOA Lithium Brines Inc | 0.3 | 3% | -25% | -25% | 200% | $ 35,205,054.90 |
| NBLC | Nobel Resources Corp. | 0.07 | 17% | 75% | 17% | 0% | $ 5,399,248.19 |
| NOB | Noble Mineral Exploration Inc. | 0.05 | 11% | 25% | 11% | -29% | $ 11,329,949.40 |
| NRM | Noram Lithium Corp. | 0.41 | 0% | 6% | -33% | -10% | $ 36,896,658.57 |
| NOCR | Norden Crown Metals Corporation | 0.015 | 0% | 0% | 0% | -50% | $ 795,367.43 |
| NORA | Norra Metals Corp. | 0.015 | 0% | 0% | 0% | -40% | $ 1,639,898.79 |
| NORR | Norrland Gold Corp. | 0.03 | 50% | 50% | -54% | -63% | $ 1,032,000.00 |
| NOC | Norseman Silver Inc. | 0.07 | -18% | 56% | -7% | -22% | $ 4,768,270.99 |
| NVT | Nortec Minerals Corp. | 0.02 | 0% | -33% | -33% | -20% | $ 1,019,339.24 |
| NAR | North Arrow Minerals Inc. | 0.035 | 17% | -13% | -42% | -13% | $ 6,153,078.51 |
| NPR | North Peak Resources Ltd. | 1.23 | 1% | -2% | -1% | 183% | $ 37,062,578.94 |
| NGC | Northern Graphite Corporation | 0.235 | -4% | 2% | -49% | -49% | $ 29,978,895.06 |
| NL | Northern Lion Gold Corp. | 0.155 | 0% | 3% | -48% | -14% | $ 2,109,953.00 |
| NRN | Northern Shield Resources Inc. | 0.055 | 22% | -27% | 38% | 38% | $ 4,517,375.01 |
| SUP | Northern Superior Resources Inc. | 0.305 | -5% | -8% | -35% | -20% | $ 42,600,000.00 |
| NCX | NorthIsle Copper and Gold Inc. | 0.235 | -4% | -18% | 24% | 38% | $ 53,230,984.00 |
| NWST | Northwest Copper Corp. | 0.165 | 10% | 14% | -27% | -35% | $ 31,467,251.15 |
| NOU | Nouveau Monde Graphite Inc. | 3.73 | 1% | 24% | -27% | -40% | $ 227,171,539.54 |
| NOVR | Nova Royalty Corp. | 1.35 | -7% | -1% | -9% | -17% | $ 127,101,533.40 |
| NBR | Nubian Resources Ltd. | 0.04 | -20% | -11% | -43% | -58% | $ 2,533,056.04 |
| NUG | NuLegacy Gold Corporation | 0.025 | 0% | 67% | 0% | 0% | $ 11,777,049.06 |
| NVX | NV Gold Corporation | 0.04 | 0% | 0% | -38% | -33% | $ 3,549,818.16 |
| OIII | O3 Mining Inc. | 1.61 | 2% | 12% | -1% | 13% | $ 120,193,480.96 |
| FEO | Oceanic Iron Ore Corp. | 0.065 | 0% | 0% | -19% | -19% | $ 6,848,647.46 |
| OLV | Olivut Resources Ltd. | 0.03 | -25% | -57% | -50% | 20% | $ 2,248,218.33 |
| OMG | Omai Gold Mines Corp. | 0.035 | -13% | -13% | -53% | -42% | $ 13,224,607.62 |
| OMM | Omineca Mining and Metals Ltd. | 0.06 | 9% | -8% | -29% | -25% | $ 9,791,901.63 |
| OPHR | Ophir Gold Corp. | 0.14 | -10% | -20% | -40% | 75% | $ 13,284,062.54 |
| OPV | Optimum Ventures Ltd. | 0 | -100% | -100% | -100% | -100% | $ 5,672,991.61 |
| OOR | Opus One Gold Corporation | 0.02 | 33% | 33% | -33% | 33% | $ 3,153,418.42 |
| OCI | Orecap Invest Corp. | 0.03 | 0% | 0% | -25% | -33% | $ 7,431,428.94 |
| ORS | Orestone Mining Corp. | 0.03 | 20% | 20% | -14% | 20% | $ 1,699,806.96 |
| REX | Orex Minerals Inc. | 0.16 | 3% | -16% | -47% | -60% | $ 2,998,368.96 |
| ORM | Orford Mining Corporation | 0.04 | 0% | -43% | -71% | -43% | $ 8,039,930.32 |
| OCO | Oroco Resource Corp. | 0.415 | -7% | -36% | -50% | -58% | $ 89,694,303.17 |
| OGN | Orogen Royalties Inc. | 0.66 | -6% | 3% | 12% | 55% | $ 127,646,647.92 |
| OMI | Orosur Mining Inc. | 0.05 | 11% | 43% | -41% | -69% | $ 9,428,015.00 |
| OSI | Osino Resources Corp. | 0.92 | 0% | -7% | -26% | 6% | $ 149,404,918.92 |
| ODV | Osisko Development Corp. | 4.14 | -6% | -11% | -39% | -34% | $ 348,165,020.34 |
| OM | Osisko Metals Incorporated | 0.17 | -3% | -8% | -36% | -24% | $ 43,617,738.95 |
| OZ | Outback Goldfields Corp. | 0.035 | -13% | -30% | -56% | -42% | $ 2,042,968.55 |
| OCG | Outcrop Silver & Gold Corporation | 0.19 | 0% | 3% | -12% | -41% | $ 41,514,840.78 |
| PGLD | P2 Gold Inc. | 0.085 | 0% | -19% | -66% | -69% | $ 9,618,472.17 |
| PBM | Pacific Bay Minerals Ltd. | 0.025 | 25% | 0% | -64% | -69% | $ 774,289.60 |
| BKM | Pacific Booker Minerals Inc. | 0.75 | -6% | 10% | -3% | -33% | $ 12,612,726.75 |
| PEMC | Pacific Empire Minerals Corp. | 0.01 | 0% | -33% | -60% | -33% | $ 903,481.96 |
| PPM | Pacific Imperial Mines Inc. | 0.015 | -25% | -25% | -50% | -25% | $ 1,186,162.02 |
| PEX | Pacific Ridge Exploration Ltd. | 0.155 | 11% | -11% | -35% | -62% | $ 19,946,571.18 |
| PP | Pacific Silk Road Resources Group Inc. | 0.025 | 0% | 0% | 0% | 0% | $ 833,564.00 |
| PAC | Pacton Gold Inc. | 0 | -100% | -100% | -100% | -100% | $ 6,539,677.20 |
| PA | Palamina Corp. | 0.1 | 0% | -29% | -33% | -13% | $ 7,128,483.60 |
| PDM | Palladium One Mining Inc. | 0.075 | 25% | 25% | -25% | -44% | $ 25,154,424.96 |
| PGZ | Pan Global Resources Inc. | 0.18 | -8% | 3% | -47% | -59% | $ 43,740,000.00 |
| PAN | Pangolin Diamonds Corp. | 0.005 | 0% | 0% | 0% | 0% | $ 931,163.09 |
| PML | Panoro Minerals Ltd. | 0.095 | -10% | -24% | -32% | -21% | $ 25,115,630.51 |
| PNTR | Pantera Silver Corp. | 0.1 | 43% | 33% | -17% | -17% | $ 2,835,705.60 |
| VEIN | Pasofino Gold Limited | 0.45 | -1% | 32% | -9% | 0% | $ 23,359,070.70 |
| PGDC | Patagonia Gold Corp. | 0.01 | -33% | 0% | -33% | 0% | $ 4,710,614.90 |
| PMET | Patriot Battery Metals Inc. | 9.6 | -5% | 5% | -35% | 88% | $ 1,099,683,417.60 |
| PEGA | Pegasus Resources Inc. | 0.17 | -13% | -15% | 100% | -43% | $ 2,635,739.67 |
| PX | Pelangio Exploration Inc. | 0.015 | 0% | -40% | -40% | -50% | $ 1,819,903.31 |
| PER | Peruvian Metals Corp. | 0.06 | 4% | -8% | -40% | -29% | $ 5,984,551.26 |
| PHNM | Phenom Resources Corp. | 0.33 | 12% | 3% | -7% | -13% | $ 31,400,709.12 |
| PJX | PJX Resources Inc. | 0.11 | 10% | 38% | 10% | 0% | $ 14,653,813.68 |
| PLA | Plata Latina Minerals Corporation | 0.015 | 50% | 50% | 0% | -25% | $ 1,185,520.07 |
| PGC | Plato Gold Corp. | 0.015 | 50% | 50% | -50% | -50% | $ 3,425,485.76 |
| PLY | Playfair Mining Ltd. | 0.035 | -13% | 17% | -22% | -36% | $ 4,462,400.60 |
| POR | Portofino Resources Inc. | 0.075 | 0% | -12% | 88% | 114% | $ 12,884,463.23 |
| PGP | Power Group Projects Corp. | 0.01 | -33% | -33% | -33% | -50% | $ 1,195,605.56 |
| PWM | Power Metals Corp. | 0.28 | -2% | -5% | 17% | 14% | $ 41,232,242.80 |
| PNPN | Power Nickel Inc. | 0.22 | 7% | -2% | -24% | 63% | $ 30,637,791.14 |
| PPX | Ppx Mining Corp. | 0.02 | -20% | -20% | 33% | 0% | $ 10,395,179.32 |
| PRG | Precipitate Gold Corp. | 0.06 | 0% | 9% | -8% | -14% | $ 7,170,174.44 |
| PNRL | Premium Nickel Resources Ltd. | 1.57 | 5% | -7% | 33% | -9% | $ 213,353,499.93 |
| PRYM | Prime Mining Corp. | 1.37 | -3% | 16% | -46% | 1% | $ 196,133,042.85 |
| PMX | ProAm Explorations Corporation | 0.03 | 0% | 0% | 20% | 100% | $ 533,092.08 |
| PLAN | Progressive Planet Solutions Inc. | 0.105 | -7% | -34% | -53% | -61% | $ 11,542,179.08 |
| PPP | Prospector Metals Corp. | 0.06 | -20% | -33% | -60% | -60% | $ 3,490,435.96 |
| PGX | Prosper Gold Corp. | 0.105 | -30% | -25% | -38% | -63% | $ 3,543,262.36 |
| PHD | Providence Gold Mines Inc. | 0.025 | -29% | -17% | -38% | -50% | $ 1,517,726.88 |
| TORO | Pucara Gold Ltd. | 0.03 | 0% | 0% | -33% | -25% | $ 2,297,758.80 |
| PUMA | Puma Exploration Inc. | 0.125 | 4% | 4% | -14% | -32% | $ 17,156,104.75 |
| PE | Pure Energy Minerals Limited | 0.58 | 4% | -31% | -28% | 7% | $ 19,279,766.66 |
| PTU | Purepoint Uranium Group Inc. | 0.04 | -20% | -11% | -27% | -43% | $ 15,470,479.40 |
| QTWO | Q2 Metals Corp. | 0.455 | -30% | -39% | -29% | 379% | $ 38,747,102.94 |
| QCCU | QC Copper and Gold Inc. | 0.115 | -8% | -12% | -21% | -36% | $ 19,106,594.43 |
| QCX | QCX Gold Corp. | 0.03 | 20% | 0% | -33% | 0% | $ 2,277,549.36 |
| QGR | Q-Gold Resources Ltd. | 0.01 | -33% | 0% | -50% | -60% | $ 559,986.95 |
| QMC | QMC Quantum Minerals Corp. | 0.105 | 11% | -5% | -45% | -25% | $ 10,546,744.76 |
| QRO | Quadro Resources Ltd. | 0.02 | 0% | -20% | -33% | -67% | $ 556,898.50 |
| QZM | Quartz Mountain Resources Ltd. | 0.15 | -17% | -17% | -40% | -40% | $ 6,960,454.50 |
| QPM | Quebec Precious Metals Corporation | 0.09 | -10% | 13% | -5% | 20% | $ 8,504,775.90 |
| QURI | Quri-Mayu Developments Ltd. | 0.03 | 0% | 50% | -50% | -60% | $ 1,341,910.14 |
| RAK | Rackla Metals Inc. | 0.12 | -4% | -55% | -29% | -48% | $ 7,297,402.32 |
| RDS | Radisson Mining Resources Inc. | 0.205 | 28% | 0% | -2% | 64% | $ 62,117,562.36 |
| RDU | Radius Gold Inc. | 0.12 | -35% | -43% | -35% | -29% | $ 11,894,223.96 |
| RMO | Rainy Mountain Royalty Corp. | 0.085 | 21% | 21% | -15% | 143% | $ 2,210,015.13 |
| RNCH | Ranchero Gold Corp. | 0.05 | -9% | -17% | -23% | -17% | $ 3,286,866.10 |
| RTH | Rathdowney Resources Ltd. | 0.025 | 0% | -17% | -17% | -17% | $ 5,760,686.25 |
| AMY | RecycLiCo Battery Materials Inc. | 0.24 | -6% | -32% | -38% | -38% | $ 64,347,811.12 |
| RPX | Red Pine Exploration Inc. | 0.18 | -5% | 13% | -10% | -8% | $ 23,950,905.83 |
| RSMX | Regency Silver Corp. | 0.205 | -2% | 3% | -32% | -2% | $ 19,514,668.95 |
| REG | Regulus Resources Inc. | 0.73 | 0% | -5% | -11% | 1% | $ 90,891,437.14 |
| RSM | Resouro Strategic Metals Inc. | 0.4 | 0% | -1% | 135% | 167% | $ 28,387,505.60 |
| RGD | Reunion Gold Corporation | 0.405 | 1% | 1% | -17% | -2% | $ 493,279,641.98 |
| RVG | Revival Gold Inc. | 0.355 | -12% | -16% | -26% | -45% | $ 36,895,298.04 |
| OWN | Rex Resources Corp. | 0.06 | 0% | -33% | -8% | 0% | $ 671,357.10 |
| REYG | Reyna Gold Corp. | 0.035 | -22% | -22% | -72% | -76% | $ 2,348,717.74 |
| RSLV | Reyna Silver Corp. | 0.17 | -11% | -26% | -28% | -50% | $ 20,979,011.50 |
| RYE | Rhyolite Resources Ltd. | 0.055 | -8% | -15% | -27% | -70% | $ 5,895,188.92 |
| RMD | Richmond Minerals Inc. | 0.05 | 43% | -38% | -50% | -75% | $ 1,417,944.00 |
| RDG | Ridgeline Minerals Corp. | 0.12 | -8% | -27% | -49% | -48% | $ 10,933,533.48 |
| RMI | Ridgestone Mining Inc. | 0.11 | 5% | -12% | -21% | -45% | $ 1,683,135.96 |
| RLYG | Riley Gold Corp. | 0.15 | 25% | 15% | -25% | 25% | $ 4,827,432.00 |
| RYO | Rio Silver Inc. | 0.02 | -20% | -43% | -33% | -20% | $ 1,696,656.88 |
| RIO | Rio2 Limited | 0.175 | -5% | -5% | -5% | 25% | $ 46,661,815.08 |
| RRI | Riverside Resources Inc. | 0.11 | -4% | -4% | -35% | 0% | $ 7,523,409.41 |
| RBX | Robex Resources Inc. | 0.25 | 6% | -7% | -11% | -7% | $ 202,573,056.72 |
| RCT | Rochester Resources Ltd. | 0.015 | 0% | 0% | -25% | -40% | $ 707,161.88 |
| RCK | Rock Tech Lithium Inc. | 1.23 | -4% | -10% | -47% | -59% | $ 119,034,830.55 |
| RK | Rockhaven Resources Ltd. | 0.06 | -8% | 0% | -14% | -8% | $ 16,568,188.20 |
| ROCK | Rockridge Resources Ltd. | 0.015 | 0% | -25% | -57% | -67% | $ 1,877,274.26 |
| RRS | Rogue Resources Inc. | 0.03 | 20% | 0% | -14% | -25% | $ 1,080,782.28 |
| RKR | Rokmaster Resources Corp. | 0.05 | -17% | -23% | -33% | -33% | $ 8,162,023.90 |
| RMR | Rome Resources Ltd. | 0.205 | -11% | -11% | -29% | 356% | $ 17,684,517.50 |
| RG | Romios Gold Resources Inc. | 0.025 | 25% | 0% | 0% | -29% | $ 6,302,871.30 |
| ROS | Roscan Gold Corporation | 0.105 | 11% | -19% | -50% | -40% | $ 39,800,292.11 |
| ROVR | Rover Metals Corp. | 0.03 | 0% | -25% | -60% | -63% | $ 1,585,450.14 |
| RYR | Royal Road Minerals Limited | 0.085 | -19% | -19% | -39% | -39% | $ 22,584,143.09 |
| RTM | RT Minerals Corp. | 0.03 | 20% | -25% | -73% | -70% | $ 616,633.95 |
| RUG | Rugby Resources Ltd. | 0.045 | -18% | 13% | -10% | -50% | $ 11,953,387.89 |
| RML | Rusoro Mining Ltd. | 0.415 | -10% | -15% | 388% | 493% | $ 238,622,118.24 |
| SAE | Sable Resources Ltd. | 0.04 | -11% | -11% | -33% | -47% | $ 11,454,595.96 |
| SAGE | Sage Potash Corp. | 0.175 | -10% | -22% | -59% | 0% | $ 9,474,708.78 |
| FISH | Sailfish Royalty Corp. | 1.23 | -4% | 4% | 26% | 81% | $ 88,536,621.25 |
| SRL | Salazar Resources Limited | 0.045 | -10% | -10% | -44% | -63% | $ 9,205,603.95 |
| SME | Sama Resources Inc. | 0.125 | 4% | -17% | -24% | -26% | $ 28,608,897.20 |
| SLG | San Lorenzo Gold Corp. | 0.1 | 33% | 82% | 82% | 67% | $ 7,170,669.60 |
| STA | Sanatana Resources Inc. | 0.07 | 40% | 56% | 75% | 40% | $ 5,295,557.54 |
| SFR | Sandfire Resources America Inc. | 0.1 | 11% | 5% | -5% | -38% | $ 102,335,279.40 |
| SCZ | Santacruz Silver Mining Ltd. | 0.185 | -10% | -3% | -54% | -62% | $ 64,933,360.53 |
| SWA | Sarama Resources Ltd. | 0.015 | 0% | -25% | -84% | -86% | $ 2,068,832.54 |
| SRE | Saville Resources Inc. | 0.005 | 0% | -50% | -50% | -67% | $ 509,232.84 |
| SGN | Scorpio Gold Corporation | 0.03 | 50% | 50% | -33% | -25% | $ 5,273,416.63 |
| SCOT | Scottie Resources Corp. | 0.17 | 0% | -8% | -41% | -24% | $ 47,088,481.39 |
| SMY | Search Minerals Inc. | 0.03 | 0% | 20% | -25% | -63% | $ 12,518,610.42 |
| SCLT | Searchlight Resources Inc. | 0.02 | -20% | -33% | -60% | -67% | $ 2,652,254.68 |
| SGZ | Sego Resources Inc. | 0.02 | 0% | 0% | -20% | -50% | $ 2,953,875.52 |
| SNS | Select Sands Corp. | 0.015 | -25% | -25% | -70% | -70% | $ 1,297,750.89 |
| SHRP | Sherpa II Holdings Corp. | 0.04 | 0% | 0% | -20% | -27% | $ 750,240.00 |
| SIE | Sienna Resources Inc. | 0.045 | -25% | -36% | 0% | -10% | $ 9,728,165.80 |
| SM | Sierra Madre Gold and Silver Ltd. | 0.35 | -7% | -7% | -53% | -53% | $ 50,399,440.35 |
| SGML | Sigma Lithium Corporation | 30.14 | -15% | -22% | -43% | -36% | $ 3,286,697,942.18 |
| SGU | Signature Resources Ltd. | 0.02 | -20% | 0% | -43% | -80% | $ 1,102,792.64 |
| SBMI | Silver Bullet Mines Corp. | 0.115 | 5% | -4% | -32% | -23% | $ 7,670,215.03 |
| SVG | Silver Grail Resources Ltd. | 0.115 | -8% | 28% | 28% | 44% | $ 3,863,381.53 |
| AGMR | Silver Mountain Resources Inc. | 0.065 | 0% | -19% | -63% | -77% | $ 14,135,540.90 |
| SVE | Silver One Resources Inc. | 0.18 | -20% | -23% | -50% | -38% | $ 44,059,811.58 |
| SPD | Silver Predator Corp. | 0.065 | -13% | 0% | -7% | -19% | $ 1,921,390.51 |
| SNG | Silver Range Resources Ltd. | 0.085 | -6% | 0% | -39% | 21% | $ 8,029,596.49 |
| SSE | Silver Spruce Resources Inc. | 0.01 | 0% | 0% | -60% | -60% | $ 2,007,595.00 |
| SLVR | Silver Tiger Metals Inc. | 0.17 | -8% | -21% | -42% | -17% | $ 63,883,370.78 |
| SILV | Silver Valley Metals Corp. | 0.07 | -7% | -22% | -48% | -30% | $ 3,890,644.80 |
| VIPR | Silver Viper Minerals Corp. | 0.09 | 6% | -5% | -50% | -53% | $ 13,923,783.18 |
| SWLF | Silver Wolf Exploration Ltd. | 0.065 | -28% | -7% | -59% | -19% | $ 2,324,627.50 |
| AGX | Silver X Mining Corp. | 0.2 | -5% | -2% | -43% | -49% | $ 33,316,155.40 |
| SOI | Sirios Resources Inc. | 0.05 | 11% | 0% | -23% | -17% | $ 12,172,779.59 |
| SKRR | SKRR Exploration Inc. | 0.135 | 0% | -21% | -40% | -10% | $ 2,088,495.77 |
| SKYG | Sky Gold Corp. | 0.07 | 27% | 27% | -42% | -33% | $ 3,030,453.37 |
| SYH | Skyharbour Resources Ltd. | 0.54 | 4% | -4% | 30% | 42% | $ 92,038,982.40 |
| SXL | SLAM Exploration Ltd. | 0.025 | -29% | -55% | -38% | -38% | $ 1,711,594.05 |
| SMRV | Smooth Rock Ventures Corp. | 0.08 | 7% | 60% | -6% | 167% | $ 1,973,983.52 |
| SIC | Sokoman Minerals Corp. | 0.06 | 0% | -25% | -61% | -73% | $ 13,764,806.16 |
| SLMN | Solis Minerals Ltd. | 0.19 | -10% | -10% | 81% | 138% | $ 16,689,102.77 |
| SGC | Solstice Gold Corp. | 0.04 | 14% | 14% | -50% | -38% | $ 7,999,982.48 |
| SOMA | Soma Gold Corp. | 0.62 | -7% | -7% | -7% | 121% | $ 56,636,061.94 |
| SDCU | Sonoran Desert Copper Corporation | 0.035 | -13% | -36% | -22% | -36% | $ 3,034,171.86 |
| SGO | Sonoro Gold Corp. | 0.08 | -11% | 7% | -11% | -27% | $ 13,285,679.36 |
| SAO | South Atlantic Gold Inc. | 0.02 | -20% | 0% | -56% | -56% | $ 2,191,313.32 |
| STS | South Star Battery Metals Corp. | 0.76 | 0% | 31% | 60% | 58% | $ 31,807,022.20 |
| SMP | Southern Empire Resources Corp. | 0.05 | -9% | -17% | -17% | -9% | $ 3,351,140.00 |
| SSV | Southern Silver Exploration Corp. | 0.14 | -7% | -13% | -33% | -26% | $ 40,816,545.98 |
| SML | Southstone Minerals Limited | 0.01 | 0% | 0% | 0% | -50% | $ 320,418.88 |
| SPA | Spanish Mountain Gold Ltd. | 0.14 | -13% | -13% | -38% | -3% | $ 52,220,000.00 |
| SRI | Sparton Resources Inc. | 0.04 | 14% | 0% | -20% | -38% | $ 5,943,661.48 |
| SPC | SPC Nickel Corp. | 0.055 | 0% | 10% | -39% | 10% | $ 6,876,883.97 |
| SHL | Spruce Ridge Resources Ltd. | 0.055 | 10% | 22% | -8% | -8% | $ 9,911,396.11 |
| SRG | SRG Mining Inc. | 0.68 | -3% | -14% | 13% | 1% | $ 79,560,000.00 |
| LORD | St. James Gold Corp. | 0.2 | -2% | 5% | 5% | 25% | $ 5,930,889.80 |
| SRC | Stakeholder Gold Corp. | 1 | -5% | 5% | 12% | 100% | $ 13,314,412.00 |
| STUD | Stallion Uranium Corp. | 0.19 | -10% | 3% | -51% | 27% | $ 20,782,444.34 |
| SLI | Standard Lithium Ltd. | 3.63 | -11% | -8% | -26% | -37% | $ 627,090,475.11 |
| STND | Standard Uranium Ltd. | 0.045 | -10% | -18% | 29% | -40% | $ 9,167,331.25 |
| STRR | Star Royalties Ltd. | 0.25 | -9% | -12% | -39% | -36% | $ 18,740,426.25 |
| STE | Starr Peak Mining Ltd. | 0.395 | 0% | -4% | -28% | -16% | $ 20,813,806.50 |
| SPX | Stellar AfricaGold Inc. | 0.01 | -33% | -33% | -75% | -67% | $ 1,113,524.50 |
| STH | Stelmine Canada Ltd. | 0.08 | -11% | 0% | -50% | -59% | $ 7,455,511.28 |
| SAG | Sterling Metals Corp. | 0.07 | 0% | -13% | -46% | -69% | $ 8,999,954.00 |
| PGE | Stillwater Critical Minerals Corp. | 0.155 | -9% | -14% | -16% | -23% | $ 30,656,891.69 |
| STNG | Stinger Resources Inc. | 0.055 | 38% | 38% | 10% | -21% | $ 2,234,148.39 |
| STRM | Storm Exploration Inc. | 0.085 | 6% | 42% | -47% | -53% | $ 3,538,778.23 |
| SB | Stratabound Minerals Corp. | 0.02 | 33% | -20% | -56% | -56% | $ 4,394,026.14 |
| SMD | Strategic Metals Ltd. | 0.2 | 5% | -17% | -29% | -32% | $ 22,191,193.40 |
| SR | Strategic Resources Inc. | 1.15 | -3% | -20% | -44% | -25% | $ 67,626,331.90 |
| SUU | Strathmore Plus Uranium Corp. | 0.5 | -19% | -32% | -25% | 54% | $ 22,424,295.50 |
| SRA | Stria Lithium Inc. | 0.15 | 0% | -21% | -39% | -57% | $ 3,888,155.40 |
| SKP | Strikepoint Gold Inc. | 0.04 | 0% | 0% | -33% | -58% | $ 8,551,018.28 |
| SDR | Stroud Resources Ltd. | 0.03 | 20% | 200% | -50% | -85% | $ 1,728,695.97 |
| STU | Stuhini Exploration Ltd | 0.195 | -9% | -17% | -46% | -41% | $ 9,039,305.15 |
| STUV | Stuve Gold Corp. | 0.09 | 100% | -10% | 20% | 38% | $ 1,630,666.62 |
| SSVR | Summa Silver Corp. | 0.39 | -15% | -8% | -39% | -45% | $ 41,331,450.68 |
| PEAK | Sun Peak Metals Corp. | 0.16 | 10% | -9% | -22% | -30% | $ 15,677,754.12 |
| SMN | Sun Summit Minerals Corp. | 0.05 | -17% | 25% | -55% | -66% | $ 5,280,084.40 |
| SGI | Superior Gold Inc. | 0 | -100% | -100% | -100% | -100% | $ 24,066,897.86 |
| SUI | Superior Mining International Corporatio | 0.3 | -9% | -9% | -6% | 50% | $ 19,476,914.40 |
| NILI | Surge Battery Metals Inc. | 0.6 | -6% | -32% | 131% | 500% | $ 94,905,861.60 |
| SURG | SURGE COPPER CORP. | 0.075 | -12% | -25% | -40% | -44% | $ 14,731,818.38 |
| SYG | Sylla Gold Corp. | 0.055 | -15% | 38% | -45% | -42% | $ 2,654,015.87 |
| TWO | T2 Metals Corp. | 0.125 | -17% | -26% | -55% | -52% | $ 3,613,002.38 |
| TAJ | Tajiri Resources Corp. | 0.015 | -25% | 0% | -63% | -67% | $ 1,944,999.27 |
| TRO | Taranis Resources Inc. | 0.175 | 17% | 0% | 35% | -3% | $ 18,444,470.27 |
| TKU | Tarku Resources Ltd. | 0.02 | 0% | -33% | -67% | -56% | $ 1,680,000.00 |
| TORA | Taura Gold Inc. | 0.235 | 0% | 18% | -23% | -6% | $ 5,323,301.55 |
| TDG | TDG Gold Corp. | 0.16 | -9% | -3% | -47% | 10% | $ 18,771,109.44 |
| TEA | Tearlach Resources Limited | 0.075 | -6% | -21% | -65% | -96% | $ 6,622,311.15 |
| TECT | Tectonic Metals Inc. | 0.14 | -13% | 8% | 27% | 22% | $ 44,476,790.26 |
| TEM | Tembo Gold Corp. | 0.17 | -3% | -3% | -6% | -17% | $ 17,914,658.65 |
| TMRR | Tempus Resources Ltd. | 0.01 | -33% | -50% | -75% | -80% | $ 2,487,321.81 |
| TRA | Teras Resources Inc. | 0.005 | 0% | 0% | -50% | -67% | $ 1,255,475.62 |
| TES | Tesoro Minerals Corp. | 0.04 | 33% | 14% | 60% | 33% | $ 3,960,701.96 |
| TUO | Teuton Resources Corp. | 0.96 | -4% | 0% | -43% | -20% | $ 55,053,005.76 |
| MAC | Themac Resources Group Limited | 0.04 | 0% | 0% | -33% | 0% | $ 3,176,004.88 |
| TAUOLD | Thesis Gold Inc | 0 | -100% | -100% | -100% | -100% | $ - |
| THX | Thor Explorations Ltd. | 0.24 | -8% | 0% | -25% | -8% | $ 156,960,000.00 |
| TVC.H | Three Valley | 0.01 | -33% | -50% | -67% | -71% | $ 1,124,638.54 |
| TGOL | Thunder Gold Corp. | 0.025 | -17% | 25% | -44% | -44% | $ 4,297,520.45 |
| THM | Thunder Mountain Gold, Inc. | 0.035 | -56% | 17% | -68% | -72% | $ 2,129,945.27 |
| AWE | Thunderstruck Resources Ltd. | 0.065 | 18% | 0% | -62% | -78% | $ 1,733,026.49 |
| TSLV | Tier One Silver Inc. | 0.1 | 0% | -26% | -55% | -70% | $ 15,009,492.30 |
| TBR | Timberline Resources Corporation | 0.06 | 0% | 0% | -48% | -68% | $ 7,465,169.58 |
| TIN | Tincorp Metals Inc. | 0.4 | 0% | -7% | -18% | -23% | $ 26,622,969.20 |
| TK | Tinka Resources Limited | 0.11 | 5% | -12% | -12% | -29% | $ 41,086,912.13 |
| TORC | TinOne Resources Inc. | 0.055 | 38% | 10% | -61% | -21% | $ 4,771,349.33 |
| TTS | Tintina Mines Ltd. | 0.01 | -50% | -50% | -50% | -60% | $ 459,049.32 |
| TNR | TNR Gold Corp. | 0.055 | -8% | -27% | -8% | 57% | $ 10,385,142.90 |
| LOT | TomaGold Corporation | 0.02 | 33% | 33% | -33% | -56% | $ 3,234,345.02 |
| TBLL | Tombill Mines Limited | 0.02 | 33% | 33% | 100% | 100% | $ 3,458,869.04 |
| TORQ | Torq Resources Inc. | 0.235 | -13% | -33% | -56% | -65% | $ 25,936,510.55 |
| TMET | Torr Metals Inc. | 0.06 | 0% | 9% | -25% | -14% | $ 2,155,877.64 |
| TBK | Trailbreaker Resources Ltd. | 0.235 | 12% | 0% | 47% | 135% | $ 7,815,426.49 |
| TCO | Transatlantic Mining Corp. | 0.105 | -9% | -5% | 5% | 425% | $ 9,097,191.18 |
| TFM | Transforma Resources Corporation | 0.025 | 0% | 0% | -29% | -29% | $ 595,081.65 |
| XTM | Transition Metals Corp. | 0.075 | 25% | 7% | 0% | -21% | $ 5,386,171.12 |
| TMC | Trench Metals Corp. | 0.095 | -5% | -32% | -37% | -83% | $ 4,711,656.15 |
| TRS | Tres-Or Resources Ltd. | 0.075 | -17% | -35% | 7% | 50% | $ 1,892,539.73 |
| TRBC | Tribeca Resources Corporation | 0.22 | 0% | -12% | -24% | -27% | $ 13,693,676.26 |
| TG | Trifecta Gold Ltd. | 0.03 | 20% | 20% | -33% | -25% | $ 2,002,482.15 |
| TM | Trigon Metals Inc. | 0.185 | 12% | 9% | -26% | 16% | $ 37,002,208.16 |
| RAGE | Renegade Gold Inc. | 0.4 | -6% | -11% | -62% | -80% | $ 6,013,488.00 |
| TSG | TriStar Gold Inc. | 0.095 | 0% | -14% | -34% | -37% | $ 26,593,201.90 |
| TIG | Triumph Gold Corp. | 0.225 | -18% | 2% | 2% | -44% | $ 9,552,565.80 |
| TR | Troubadour Resources Inc. | 0.045 | -10% | -25% | -18% | -25% | $ 755,806.70 |
| TRU | TRU Precious Metals Corp. | 0.025 | 25% | 25% | -38% | -58% | $ 4,144,333.05 |
| TGX | True North Gems Inc. | 0.04 | 0% | 14% | -43% | -33% | $ 1,263,094.12 |
| TSD | Tsodilo Resources Limited | 0.195 | -3% | -15% | -15% | -33% | $ 10,205,914.29 |
| TUD | Tudor Gold Corp. | 0.89 | -9% | 0% | -45% | -30% | $ 193,213,352.64 |
| TUK | Tuktu Resources Ltd. | 0.07 | 17% | 0% | -13% | -56% | $ 5,810,459.20 |
| TBX | Turmalina Metals Corp. | 0.115 | -12% | -30% | -52% | -52% | $ 9,361,275.48 |
| TVI | Tvi Pacific Inc. | 0.02 | 0% | -33% | 0% | 0% | $ 14,571,740.78 |
| TYMB | Tymbal Resources Ltd. | 0.01 | 100% | 0% | 0% | 0% | $ 538,262.73 |
| UCU | Ucore Rare Metals Inc. | 0.66 | -11% | -3% | -38% | -15% | $ 41,419,014.75 |
| ULT | Ultra Lithium Inc. | 0.055 | 0% | -15% | 0% | -52% | $ 11,465,721.06 |
| UGD | Unigold Inc. | 0.045 | -10% | -18% | -18% | -31% | $ 11,501,443.94 |
| UNV | Universal Copper Ltd. | 0.015 | 0% | 0% | -25% | -40% | $ 2,129,983.17 |
| USCU | US Copper Corp. | 0.045 | 13% | 0% | -40% | 13% | $ 5,181,958.22 |
| USHA | Usha Resources Ltd. | 0.075 | 15% | -25% | -73% | -67% | $ 3,889,417.56 |
| VZZ | Val-d'Or Mining Corporation | 0.08 | 14% | -11% | -6% | 7% | $ 6,602,836.72 |
| VMXX | Valhalla Metals Inc. | 0.23 | -4% | 7% | -38% | -23% | $ 8,053,826.28 |
| VO | Valore Metals Corp. | 0.06 | -8% | 20% | -70% | -82% | $ 10,430,408.70 |
| NICK | Nickelex Resource Corporation | 0.025 | 0% | 25% | 67% | 25% | $ 2,255,080.75 |
| VRB | Vanadiumcorp Resource Inc. | 0.075 | 0% | -12% | -25% | 7% | $ 4,955,725.73 |
| VSR | Vanstar Mining Resources Inc. | 0.35 | 0% | 3% | -7% | 11% | $ 20,317,660.30 |
| VAX | Vantex Resources Ltd. | 0.06 | -25% | -33% | -60% | -59% | $ 288,553.86 |
| VCV | Vatic Ventures Corp. | 0.08 | 0% | 33% | -38% | -54% | $ 2,396,920.80 |
| VLC | Velocity Minerals Ltd. | 0.105 | 5% | -13% | -32% | -48% | $ 19,011,706.35 |
| VTT | Vendetta Mining Corp. | 0.025 | 25% | 0% | -62% | -44% | $ 8,079,726.43 |
| VLV | Venerable Ventures Ltd. | 0.115 | 0% | 0% | 0% | 0% | $ 1,553,987.76 |
| VERT | Vertical Exploration Inc. | 0.06 | -20% | -29% | 33% | 20% | $ 8,933,863.45 |
| VIO | Vior Inc. | 0.14 | 8% | 8% | -18% | 27% | $ 13,768,748.69 |
| VML | Viscount Mining Corp. | 0.25 | 16% | 32% | -29% | -29% | $ 21,383,907.81 |
| VGD | Visible Gold Mines Inc. | 0.145 | -3% | -19% | 26% | 38% | $ 5,097,498.78 |
| VLI | Vision Lithium Inc. | 0.055 | 0% | -21% | -42% | -67% | $ 15,420,000.00 |
| VIZ | Visionary Metals Corp. | 0.085 | -6% | 31% | -6% | 70% | $ 12,750,892.25 |
| VAU | Viva Gold Corp. | 0.125 | -14% | 4% | -32% | 56% | $ 13,340,140.25 |
| VCU | Vizsla Copper Corp. | 0.085 | -19% | -35% | -67% | -70% | $ 9,688,892.85 |
| VZLA | Vizsla Silver Corp. | 1.38 | -3% | -1% | -28% | -9% | $ 287,031,470.22 |
| VG | Volcanic Gold Mines Inc | 0.19 | -14% | 15% | 3% | -7% | $ 8,654,729.90 |
| VCT | Volt Carbon Technologies Inc. | 0.07 | -7% | -13% | -13% | -44% | $ 12,548,613.14 |
| VMS | Vortex Metals Inc. | 0.08 | -11% | -20% | -38% | 7% | $ 4,806,404.56 |
| VOX | Vox Royalty Corp. | 0 | 0% | 0% | 0% | 0% | $ 153,073,279.98 |
| VONE | Voyager Metals Inc. | 0 | -100% | -100% | -100% | -100% | $ 13,016,659.18 |
| VM | Voyageur Pharmaceuticals Ltd. | 0.045 | 0% | -10% | -31% | -47% | $ 4,644,584.21 |
| VRR | VR Resources Ltd. | 0.07 | -13% | -22% | -63% | -30% | $ 7,407,813.14 |
| VUL | Vulcan Minerals Inc. | 0.15 | 11% | -6% | -40% | -52% | $ 19,324,389.75 |
| VVC | VVC Exploration Corporation | 0.065 | 8% | -13% | -7% | -24% | $ 37,224,317.98 |
| WRR | Walker River Resources Corp. | 0.135 | -21% | 35% | -16% | -40% | $ 5,434,001.37 |
| WRI | Waseco Resources Inc. | 0.015 | 0% | -50% | -40% | -63% | $ 625,220.85 |
| WML | Wealth Minerals Ltd. | 0.23 | -6% | -18% | -18% | -6% | $ 78,205,425.84 |
| WGF | Wescan Goldfields Inc. | 0.04 | 0% | 0% | 14% | -11% | $ 2,131,372.80 |
| WHY | West High Yield (W.H.Y.) Resources Ltd. | 0.245 | 9% | 9% | -44% | 7% | $ 21,350,083.68 |
| WRLG | West Red Lake Gold Mines Ltd. | 0.57 | -12% | -10% | -24% | 14% | $ 106,118,455.53 |
| WVM | West Vault Mining Inc. | 0.99 | 2% | 16% | 4% | 3% | $ 57,345,247.08 |
| WAM | Western Alaska Minerals Corp. | 1.01 | -2% | 2% | -59% | -63% | $ 27,937,010.06 |
| WA | Western Atlas Resources Inc | 0.02 | 0% | 0% | -20% | -60% | $ 2,351,067.96 |
| WEX | Western Exploration Inc. | 0.65 | -7% | -17% | -60% | -67% | $ 22,391,954.00 |
| WGLD | Western Gold Exploration Ltd. | 0.09 | 0% | 0% | -25% | 20% | $ 4,507,471.53 |
| WMG | Western Magnesium Corporation | 0.11 | 0% | 0% | 0% | -4% | $ 50,222,715.40 |
| WMS | Western Metallica Resources Corp. | 0.04 | 0% | -11% | -33% | -60% | $ 2,869,145.20 |
| WHN | Westhaven Gold Corp. | 0.16 | -9% | -16% | -53% | -58% | $ 22,493,815.20 |
| WKG | WestKam Gold Corp. | 0.065 | 0% | -7% | -28% | -41% | $ 1,477,781.96 |
| WGO | White Gold Corp. | 0.21 | -5% | -5% | -46% | -40% | $ 33,705,147.00 |
| WMK | Whitemud Resources Inc. | 0.07 | -7% | 8% | -26% | 56% | $ 2,381,841.00 |
| WSK | Wildsky Resources Inc. | 0.165 | 0% | 3% | 22% | -31% | $ 6,780,368.27 |
| WIN | Windfall Geotek Inc. | 0.04 | 0% | -20% | -43% | -27% | $ 5,360,000.00 |
| WINS | Winshear Gold Corp. | 0.265 | -4% | 6% | 141% | 430% | $ 21,826,210.86 |
| WLF | Wolfden Resources Corporation | 0.08 | 0% | -11% | -56% | -56% | $ 13,185,411.84 |
| WCU | World Copper Ltd. | 0.075 | -17% | -40% | -57% | -68% | $ 9,375,524.85 |
| XGC | Xali Gold Corp. | 0.04 | 14% | 14% | -20% | -50% | $ 5,575,593.60 |
| XND | Xander Resources Inc. | 0.005 | 0% | 0% | -67% | -88% | $ 563,600.62 |
| GIG | XAU Resources Inc. | 0.06 | -8% | 9% | 0% | -50% | $ 756,690.00 |
| XIM | Ximen Mining Corp. | 0.06 | -14% | 0% | -59% | 9% | $ 8,982,863.82 |
| XPLR | Xplore Resources Corp. | 0.135 | 0% | 8% | 35% | 54% | $ 2,117,003.18 |
| CLIC | Comet Lithium Corporation | 0.53 | -4% | 45% | -2% | 203% | $ 10,111,334.22 |
| YORK | York Harbour Metals Inc. | 0.1 | -17% | 0% | -72% | -80% | $ 6,852,904.10 |
| ZACA | Zacapa Resources Ltd. | 0.03 | -25% | -14% | -33% | -78% | $ 3,602,097.09 |
| ZAC | Zacatecas Silver Corp. | 0.12 | -20% | -25% | -70% | -79% | $ 10,849,318.92 |
| ZBNI | Zeb Nickel Corp. | 0.08 | 0% | -11% | -60% | 0% | $ 4,452,314.40 |
| ZEN | Zentek Ltd. | 1.65 | -4% | 2% | -19% | -21% | $ 166,455,496.35 |
| ZFR | Zephyr Minerals Ltd. | 0.085 | 6% | 13% | -23% | -6% | $ 6,382,393.73 |
| ZNX | Zincx Resources Corp. | 0.065 | -19% | -24% | -35% | -19% | $ 12,220,000.00 |
| ZON | Zonte Metals Inc. | 0.04 | -27% | 33% | -56% | -69% | $ 3,131,098.25 |
| CELL | Grid Battery Metals Inc. | 0.065 | -7% | -43% | 30% | 0% | $ 12,238,251.68 |
| EML | Electric Metals (USA) Limited | 0.155 | -26% | -31% | -35% | -31% | $ 22,430,465.87 |
| FIN | European Energy Metals Corp. | 0.36 | -10% | -13% | -25% | 260% | $ 12,656,453.76 |
| AVA | Avante Mining Corp. | 0.07 | 8% | -22% | -53% | -83% | $ 2,222,945.93 |
| VLT | Volt Lithium Corp. | 0.255 | 16% | -6% | -50% | 96% | $ 32,575,900.75 |
| SGD | Snowline Gold Corp. | 3.97 | -8% | -13% | 26% | 53% | $ 573,972,861.59 |
| ZLTO | BULGOLD Inc. | 0.15 | 0% | 0% | -52% | -38% | $ 4,139,689.20 |
| TM | Trigon Metals Inc. | 0.185 | 12% | 9% | -26% | 16% | $ 37,002,208.16 |
| COSA | Cosa Resources Corp. | 0.315 | -5% | -2% | -23% | 103% | $ 14,514,919.34 |
| SRQ | SRQ Resources Inc. | 0.23 | 21% | -8% | 0% | 0% | $ 5,054,673.43 |
| GHR.H | Glden Harp | 0.09 | 0% | -25% | 13% | -10% | $ 2,697,073.74 |
| KEN.H | Kenadyr Mtls | 0.015 | -50% | -67% | -67% | -67% | $ 177,059.33 |
Prices and market caps in CAD.

Related Stories
Canada Unearthed: TSX targets ASX companies for dual-listings in conviction mining juniors can prosper in Canada
Canada Unearthed: Canuck investors are about to get exposure to ‘one of the best gold discoveries globally’
Canada Unearthed: SSR crumbles as heap leach pad disaster shuts Turkish gold mine
UNLOCK INSIGHTS
Discover the untold stories of emerging ASX stocks.
Daily news and expert analysis, it's free to subscribe.
By proceeding, you confirm you understand that we handle personal information in accordance with our Privacy Policy.


