Oxford reckons copper will lead the electrifyin’ revolution. Here are some ASX stocks to watch
Pic: Tyler Stableford / Stone via Getty Images
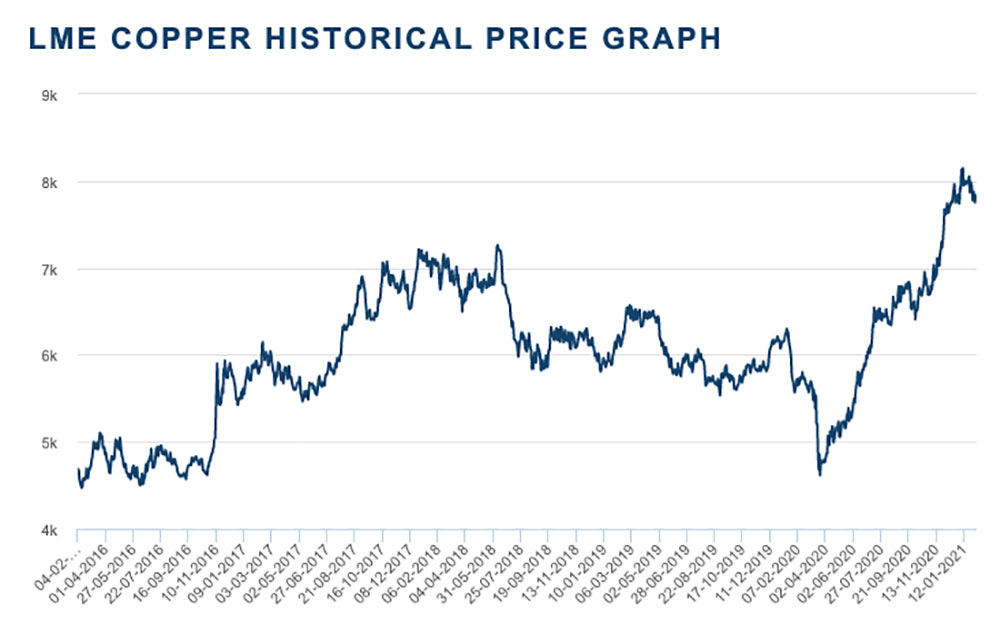
The global green energy revolution will boost demand for copper as cars and trucks switch fuel from petrol to electricity.
The red metal is well placed to benefit because it has very few close competitors for industrial electricity transmission, according to Oxford Economics.
Meanwhile, years of low prices (and more recently, COVID-19) has slowed investment — thinning the pipeline of mining projects on the horizon.
Copper demand will benefit from electrification in two ways, Oxford says.
Bigger batteries = more copper
First, EVs – which contain significantly more copper than traditional vehicles already – are expected to need bigger batteries to provide adequate power and range.
“Those bigger batteries mean copper’s use in wires and motors needs to be significantly scaled up and should double or triple per vehicle,” Oxford says.
With sales of EVs growing far more rapidly than traditional cars, the boost to copper will inevitably be amplified.
Charging up with copper
Second, copper will benefit from a massive build-out of charging stations for EVs.
The EU has a €20bn ($31.5 billion) green energy plan to increase the number of public charging stations from 170,000 in 2020 to 2 million by 2025, Oxford says.
“Some of this extra infrastructure will also boost aluminium demand (the light metal is used for overhead power lines), but significant amounts of extra copper will also be needed for power cables.”
And don’t forget wind and solar power — some scenarios suggest that solar alone may need an extra 20 million tonnes of copper by 2050, which is equal to current global output. Ridiculous.
Here’s how a bunch of ASX-listed copper-exposed stocks are performing.
Scroll or swipe to reveal table. Click headings to sort. Best viewed on a laptop:
| CODE | COMPANY | 1 WEEK CHANGE % | 1 MONTH CHANGE % | 6 MONTH CHANGE % | 1 YEAR CHANGE % | PRICE | MARKET CAP |
|---|---|---|---|---|---|---|---|
| AML | Aeon Metals | 0 | 9 | -9 | -7 | 0.125 | $ 81,308,367.24 |
| AIS | Aeris Resources | -5 | -18 | 62 | 77 | 0.086 | $ 161,246,584.06 |
| A1M | Aic Mines | -5 | -5 | 13 | 8 | 0.35 | $ 24,050,256.30 |
| AUQ | Alara Resources | -32 | -28 | 0 | -24 | 0.013 | $ 8,712,051.10 |
| ALY | Alchemy Resource | 0 | 0 | 8 | 67 | 0.018 | $ 12,100,382.15 |
| AL8 | Alderan Resource | -8 | -19 | -39 | 439 | 0.097 | $ 28,900,285.92 |
| AQI | Alicanto Minerals | 10 | 5 | 38 | 100 | 0.11 | $ 35,960,920.71 |
| AQX | Alice Queen | 6 | 3 | -15 | 27 | 0.033 | $ 37,113,161.35 |
| ALK | Alkane Resources | -2 | -17 | -30 | -2 | 0.8 | $ 482,264,928.00 |
| ATM | Aneka Tambang | 0 | 0 | 0 | 0 | 1 | $ 1,303,649.00 |
| AZY | Antipa Minerals | -9 | -7 | -11 | 273 | 0.041 | $ 102,337,665.34 |
| ARD | Argent Minerals | 17 | 2 | 21 | 294 | 0.063 | $ 53,387,735.03 |
| ARE | Argonaut Resources | 8 | 44 | 30 | 160 | 0.013 | $ 37,867,328.84 |
| AKN | Auking Mining | 0 | 0 | 0 | 0 | 0.002 | $ 1,865,168.92 |
| AOU | Auroch Minerals | -11 | 70 | 311 | 292 | 0.255 | $ 67,191,946.75 |
| AMG | Ausmex Mining | -7 | 35 | 100 | 10 | 0.066 | $ 36,840,633.80 |
| AQD | Ausquest | 0 | 33 | -26 | 82 | 0.02 | $ 14,223,986.30 |
| AZS | Azure Minerals | -8 | -17 | 219 | 281 | 0.495 | $ 152,502,431.90 |
| BAT | Battery Minerals | -15 | 40 | 211 | 300 | 0.028 | $ 59,196,932.69 |
| BHP | BHP Group | 0 | 2 | 16 | 15 | 44.07 | $ 129,352,334,710.54 |
| BOA | Boadicea Resources | 4 | 8 | 36 | 42 | 0.27 | $ 16,779,351.42 |
| BOC | Bougainville Copper | -4 | 52 | 66 | 57 | 0.44 | $ 164,435,625.00 |
| BYH | Bryah Resources | -11 | -10 | 9 | 54 | 0.063 | $ 9,673,052.00 |
| CAE | Cannindah Resources | -3 | -10 | 100 | 180 | 0.028 | $ 8,020,450.12 |
| CBY | Canterbury Resources | -9 | -9 | -29 | -47 | 0.096 | $ 8,449,439.52 |
| CVV | Caravel Minerals | -5 | -25 | 339 | 543 | 0.18 | $ 52,189,544.34 |
| CWX | Carawine Resources | -9 | -12 | 13 | 10 | 0.215 | $ 23,411,328.93 |
| CCZ | Castillo Copper | 8 | 76 | 52 | 219 | 0.067 | $ 66,165,204.43 |
| CHN | Chalice Mining | -1 | -7 | 277 | 1278 | 4 | $ 1,343,368,709.07 |
| CHK | Cohiba Minerals | -10 | 58 | 280 | 245 | 0.038 | $ 50,007,077.14 |
| C6C | Copper Mountain | 7 | 23 | 228 | 196 | 2.25 | $ 38,060,286.42 |
| COY | Coppermoly | -10 | 46 | 171 | 280 | 0.019 | $ 40,417,065.79 |
| CZN | Corazon | -17 | 55 | 55 | -8 | 0.062 | $ 9,760,104.36 |
| CYM | Cyprium Metals | -4 | 9 | 53 | -13 | 0.245 | $ 24,149,457.43 |
| DEV | Devex Resources | 5 | -12 | 33 | 331 | 0.22 | $ 62,183,844.80 |
| DGR | DGR Global | -12 | -11 | -2 | 7 | 0.065 | $ 65,363,774.71 |
| EM2 | Eagle Mountain | -10 | -27 | 130 | 130 | 0.345 | $ 51,224,898.96 |
| ERM | Emmerson Resources | 1 | -10 | -28 | -10 | 0.072 | $ 34,765,478.93 |
| ENR | Encounter Resources | -15 | -20 | -3 | 40 | 0.14 | $ 44,178,918.42 |
| FNT | Frontier Resources | 0 | 13 | 42 | 70 | 0.017 | $ 8,314,732.95 |
| GRL | Godolphin Resources | 4 | 2 | 4 | 29 | 0.245 | $ 20,601,119.25 |
| GMN | Gold Mountain | 5 | 5 | -10 | -34 | 0.045 | $ 33,469,309.08 |
| GED | Golden Deeps | 9 | 9 | 20 | -52 | 0.012 | $ 9,295,360.14 |
| GTE | Great Western Exploration | 18 | 40 | 55 | 272 | 0.295 | $ 32,535,457.08 |
| HAV | Havilah Resources | 8 | 26 | 19 | 117 | 0.215 | $ 65,849,604.02 |
| HGO | Hillgrove Resources | 0 | 6 | 2 | -36 | 0.035 | $ 23,162,936.79 |
| HCH | Hot Chili | -8 | -17 | 25 | 29 | 0.035 | $ 107,060,694.65 |
| IGO | IGO | -4 | -5 | 37 | 12 | 6.42 | $ 4,778,359,900.03 |
| IVR | Investigator Resources | 21 | -6 | 108 | 238 | 0.081 | $ 106,996,675.17 |
| KAU | Kaiser Reef | -9 | 7 | 28 | 0 | 0.44 | $ 42,595,675.76 |
| KGL | KGL Resources | -6 | 53 | 133 | 101 | 0.42 | $ 141,014,168.82 |
| KTA | Krakatoa Resources | -3 | -13 | -23 | 103 | 0.065 | $ 19,526,500.00 |
| LEX | Lefroy Exploration | 0 | -13 | -32 | 8 | 0.2 | $ 24,001,933.40 |
| MAU | Magnetic Resources | -1 | 18 | -3 | 138 | 1.38 | $ 291,831,358.95 |
| MCB | MCB Resources | 0 | 0 | 0 | 0 | 0.07 | $ 1,798,548.64 |
| MLX | Metals X | 0 | 26 | 105 | 118 | 0.017 | $ 154,235,231.39 |
| MEP | Minotaur Exploration | 0 | -16 | 269 | 260 | 0.155 | $ 74,813,824.05 |
| NML | Navarre Minerals | 0 | -21 | 32 | 72 | 0.165 | $ 87,222,744.16 |
| NWC | New World Resources | -13 | -18 | 53 | 207 | 0.046 | $ 59,684,700.11 |
| OAR | OAR Resources | -21 | 0 | 633 | 511 | 0.022 | $ 34,000,309.25 |
| ORN | Orion Minerals | 15 | 7 | 58 | 36 | 0.03 | $ 98,997,842.74 |
| OZL | OZ Minerals | 2 | -3 | 35 | 94 | 18.86 | $ 6,344,267,824.85 |
| PEX | Peel Mining | 13 | -12 | 14 | 14 | 0.265 | $ 87,119,172.57 |
| PXX | Polarx | 42 | 52 | 12 | 27 | 0.047 | $ 25,468,308.02 |
| REE | Rarex Limited | 0 | 4 | 105 | 221 | 0.125 | $ 51,080,400.50 |
| RVR | Red River Resources | -6 | -27 | 96 | 135 | 0.235 | $ 119,088,104.41 |
| RCP | Redbank Copper | 8 | 8 | 311 | 311 | 0.078 | $ 31,813,906.18 |
| RXM | Rex Minerals | 0 | 11 | -2 | 251 | 0.2 | $ 73,366,329.27 |
| RIO | Rio Tinto | 1 | -1 | 9 | 18 | 114.88 | $ 42,422,588,935.92 |
| RTG | RTG Mining Inc. | 3 | -9 | 39 | 132 | 0.195 | $ 124,665,870.03 |
| SFR | Sandfire Resources | 3 | -10 | 0 | -8 | 4.89 | $ 864,518,965.05 |
| SCI | Silver City Minerals | 23 | 29 | 50 | 200 | 0.027 | $ 12,184,006.33 |
| SRI | Sipa Resources | 0 | -10 | -34 | -6 | 0.061 | $ 11,203,122.92 |
| SUH | Southern Hem Min | 19 | 41 | 34 | 125 | 0.038 | $ 9,288,710.77 |
| SGQ | St George Mining | -5 | 0 | 3 | -5 | 0.1 | $ 51,613,196.04 |
| SVY | Stavely Minerals | -1 | -9 | 23 | 4 | 0.72 | $ 190,501,859.96 |
| SLZ | Sultan Resources | 8 | -15 | 11 | 223 | 0.2 | $ 13,906,877.80 |
| TLM | Talisman Mining | -5 | -2 | -34 | 12 | 0.095 | $ 17,729,696.58 |
| TAR | Taruga Minerals | 0 | -9 | 0 | 243 | 0.048 | $ 21,945,672.29 |
| TAS | Tasman Resources | 9 | 73 | 109 | 84 | 0.071 | $ 42,779,763.46 |
| VXR | Venturex Resources | -4 | -8 | 72 | 15 | 0.115 | $ 43,584,050.25 |
| XAM | Xanadu Mines | 3 | -10 | -39 | 6 | 0.036 | $ 38,214,453.27 |
| ZNC | Zenith Minerals | -14 | -4 | 9 | 131 | 0.125 | $ 36,795,003.75 |
| ANX | Anax Metals | 109 | 128 | 319 | 925 | 0.1025 | $ 13,169,702.02 |
| MBK | Metal Bank | -15 | -15 | 15 | 44 | 0.011 | $ 13,029,591.34 |
| HMX | Hammer Metals | 6 | 160 | 112 | 333 | 0.091 | $ 64,507,464.11 |
| DEX | Duke Exploration | -5 | -11 | 0 | 0 | 0.29 | $ 17,497,733.19 |
| IPT | Impact Minerals | -5 | 0 | 0 | 171 | 0.019 | $ 33,836,842.38 |
| TTM | Titan Minerals | 0 | 0 | -21 | -12 | 0.115 | $ 131,037,029.91 |
| STM | Sunstone Metals | 0 | 7 | 36 | 15 | 0.015 | $ 30,939,827.04 |
| HLX | Helix Resources | 23 | 60 | -16 | 35 | 0.016 | $ 11,911,798.92 |
| TRN | Torrens Mining | -14 | 0 | 0 | 0 | 0.19 | $ 24,632,043.03 |
Related Topics

Related Stories


UNLOCK INSIGHTS
Discover the untold stories of emerging ASX stocks.
Daily news and expert analysis, it's free to subscribe.
By proceeding, you confirm you understand that we handle personal information in accordance with our Privacy Policy.


