High Voltage: Lithium to keep flying in 2022, extra supply MAY dampen nickel and cobalt prices
Pic: Tyler Stableford / Stone via Getty Images
- Lithium boom to continue in 2022: S&P Global
- Elon Musk under pressure to sell ~$US21bn worth of Tesla stock
Our High Voltage column wraps all the news driving ASX stocks with exposure to lithium, cobalt, graphite, nickel, rare earths, and vanadium.
S&P Global predicts that lithium supply shortages could persist in 2022, cobalt markets will be balanced by new supply from the DRC, and nickel prices will moderate as Indonesian output continues to expand.
S&P’s 2022 Metals and Mining Industry Outlook expects another record to be set in 2021 for global plug-in electric vehicle (PEV) sales, despite a prolonged computer chip shortage which has constrained the full EV sales potential.
Both dynamics are expected to extend into 2022, it says.
“We remain cautiously optimistic on PEV sales in 2022, with risks to the downside,” it says.
Lithium
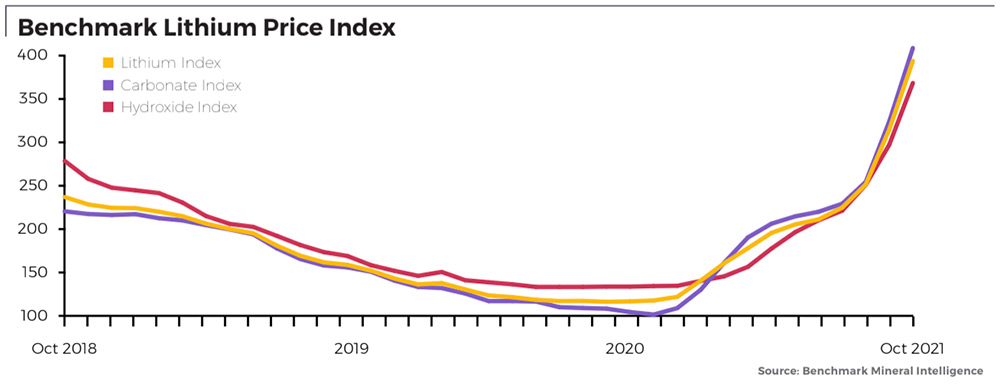
After three years of prices trending downward, the seaborne Asia lithium carbonate price and the ex-works China lithium carbonate price jumped 91% and 162%, respectively, in the first nine months of 2021, as unexpected demand increases combined with a slow expansion in supply.
“Active lithium M&A [mergers and acquisitions] and unprecedented financing for junior and intermediate explorers in 2021 are likely to improve medium-term supply; however, demand-supply mismatches could persist in 2022 if unexpected demand increases continue,” S&P says.
Benchmark Mineral Intelligence says the real shortage hasn’t even hit yet.
Benchmark Lithium prices – Battery Grade, EXW China @benchmarkmin
Nov 2018 $11,875
Nov 2019 $7,950
Nov 2020 $6,100
Today $30,025Structural shortage is set to hit in 2022.
Lithium carbonate prices are at all time highs but easy to see them soar above $40k in 2022 pic.twitter.com/1yl4Dd7csO
— Simon Moores (@sdmoores) November 7, 2021
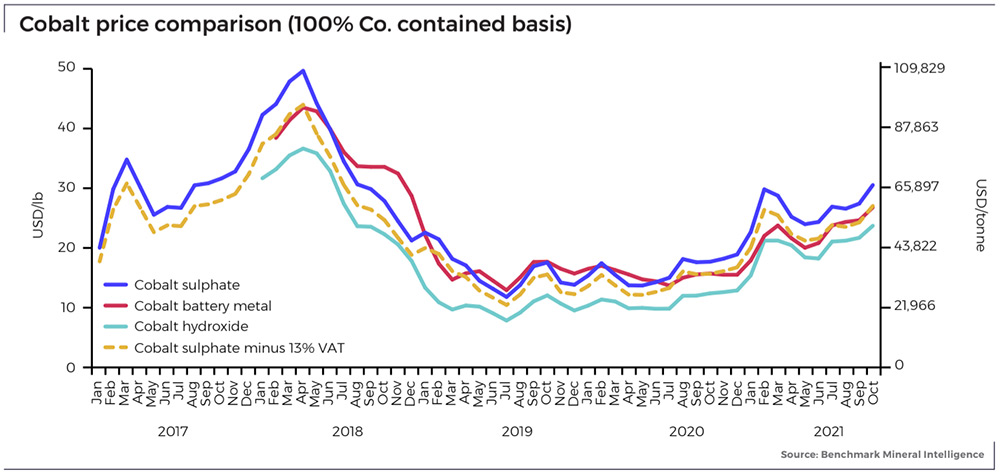
Cobalt
The cobalt export market has been hampered by low efficiency at the Port of Durban since May 2020, S&P says.
Durban port in South Africa is a key export channel for supply from the Democratic Republic of Congo (DRC), a global giant when it comes to production of the key battery metal.
According to the United States Geological Survey (USGS), the DRC produced 95,000 tonnes of cobalt in 2020, accounting for 68% of global output.
It’s where China – the world’s biggest consumer by far — gets ~90% of its supply.
“We expect supply flows to improve in 2022, however, boosted by the Mutanda [mine] restart and the Tenke Fugurume [operation] expansion,” it says.
“With battery-related demand expected to rise despite cobalt thrifting, the additional supply will balance the market.”
Nickel
The London Metal Exchange three-month, or LME 3M, nickel closing price surged to a seven-year high of $20,392 per tonne September 10 on dwindling LME stocks resulting from supply disruptions, recovering stainless steel sector activity and strong demand from the EV sector in 2021.
“We nevertheless expect primary nickel supply to increase faster than PEV-related demand in 2022, as Indonesian output continues to expand; this will put downward pressure on the LME 3M price in 2022,” S&P says.
However, Benchmark Mineral Intelligence reckons Indonesian nickel may not have a global customer base due to its poor ESG credentials.
“Earlier this year, the American automaker [Tesla] signed a supply agreement with BHP, which Benchmark estimates to be worth up to 18,000 tpa of nickel,” it said early November.
“These deals reflect Tesla’s concern over its future nickel supply, as the automaker looks to lock in long-term supplies deals with operations that satisfy their sustainability requirements.”
“Such deals indicate that Tesla likely plans to exclude Indonesian nickel from its supply chain due to the poor ESG record of mining in the region, at least until post-2025.”

Twitter decides: Elon Musk under pressure to sell Tesla stock
Yesterday, as a debate raged over how America’s richest people should be taxed, Musk tweeted this:
Much is made lately of unrealized gains being a means of tax avoidance, so I propose selling 10% of my Tesla stock.
Do you support this?
— Lorde Edge (@elonmusk) November 6, 2021
The outcome was clear. “I will abide by the results of this poll, whichever way it goes,” Musk says.
CNBC has its own theory.
*ELON MUSK FACES A $15 BILLION TAX BILL, WHICH IS LIKELY THE REAL REASON HE’S SELLING STOCK – CNBC$TSLA pic.twitter.com/uTDVzGcWex
— Investing.com (@Investingcom) November 8, 2021
The stake was valued at about $US21 billion, according to Bloomberg. What impact this news has on the Tesla share price remains to be seen.
Here’s how a basket of ASX stocks with exposure to lithium, cobalt, graphite, nickel, and vanadium are performing>>>
| CODE | COMPANY | 1 WEEK RETURN % | 1 MONTH RETURN % | 6 MONTH RETURN % | 1 YEAR RETURN % | SHARE PRICE [MON INTRADAY] | MARKET CAP |
|---|---|---|---|---|---|---|---|
| CAE | Cannindah Resources | 100 | 315 | 567 | 1900 | 0.56 | $ 267,097,552.41 |
| MNS | Magnis Energy Tech | 49 | 127 | 100 | 268 | 0.68 | $ 566,955,073.06 |
| ASN | Anson Resources | 48 | 84 | 108 | 361 | 0.1475 | $ 144,101,070.33 |
| LPD | Lepidico | 45 | 105 | 150 | 463 | 0.045 | $ 252,250,032.46 |
| RLC | Reedy Lagoon Corp | 45 | 83 | 100 | 282 | 0.042 | $ 24,301,177.47 |
| GW1 | Greenwing Resources | 42 | 56 | 36 | 217 | 0.475 | $ 54,111,384.53 |
| LEL | Lithium Energy | 41 | 81 | 1.03 | $ 48,150,000.00 | ||
| AZL | Arizona Lithium | 40 | 205 | 238 | 942 | 0.125 | $ 228,795,570.90 |
| PNN | PepinNini Minerals | 40 | 86 | 207 | 315 | 0.705 | $ 29,351,736.54 |
| EUR | European Lithium | 37 | 91 | 230 | 387 | 0.185 | $ 196,319,336.74 |
| GL1 | Global Lithium | 34 | 86 | 225 | 0.65 | $ 53,385,537.60 | |
| TLG | Talga Group | 34 | 47 | 31 | 62 | 2.01 | $ 577,652,970.93 |
| AVZ | AVZ Minerals | 32 | 54 | 224 | 535 | 0.47 | $ 1,705,631,520.40 |
| FRS | Forrestania Resources | 32 | 55 | 0.48 | $ 13,183,500.00 | ||
| TON | Triton Minerals | 29 | 26 | -4 | -4 | 0.044 | $ 45,378,722.68 |
| GLN | Galan Lithium | 29 | 75 | 119 | 1258 | 1.63 | $ 484,332,060.58 |
| QEM | QEM | 26 | 43 | 5 | 117 | 0.215 | $ 20,983,316.61 |
| QXR | Qx Resources | 24 | 121 | 94 | 63 | 0.031 | $ 19,672,507.31 |
| CHR | Charger Metals | 23 | 28 | 0.53 | $ 16,976,448.55 | ||
| ESS | Essential Metals | 23 | 78 | 150 | 167 | 0.24 | $ 57,028,793.76 |
| INF | Infinity Lithium | 23 | 118 | 26 | 189 | 0.24 | $ 92,900,801.03 |
| SBR | Sabre Resources | 20 | 20 | 9 | -33 | 0.006 | $ 10,135,881.89 |
| HXG | Hexagon Energy | 19 | 38 | -9 | 123 | 0.105 | $ 46,831,451.84 |
| ADV | Ardiden | 18 | 18 | 0 | -64 | 0.013 | $ 27,993,359.63 |
| AGY | Argosy Minerals | 17 | 84 | 282 | 608 | 0.34 | $ 406,350,507.88 |
| PSC | Prospect Resources | 17 | 24 | 238 | 367 | 0.49 | $ 203,548,679.13 |
| INR | Ioneer | 15 | 36 | 125 | 314 | 0.7875 | $ 1,619,547,117.97 |
| BKT | Black Rock Mining | 14 | 30 | 78 | 287 | 0.24 | $ 200,993,138.96 |
| HNR | Hannans | 14 | 60 | 591 | 591 | 0.041 | $ 107,458,973.64 |
| EMH | European Metals Hldg | 13 | 13 | 13 | 176 | 1.52 | $ 186,031,509.95 |
| BMM | Balkanminingandmin | 12 | 1 | 0.64 | $ 22,100,000.00 | ||
| LKE | Lake Resources | 12 | 93 | 244 | 1809 | 1.05 | $ 1,318,590,027.57 |
| LPI | Lithium Pwr Int | 12 | 60 | 66 | 146 | 0.48 | $ 176,128,773.24 |
| FFX | Firefinch | 11 | 13 | 75 | 329 | 0.665 | $ 600,526,368.64 |
| G88 | Golden Mile Res | 10 | 20 | -34 | -7 | 0.054 | $ 8,892,953.06 |
| CXO | Core Lithium | 10 | 59 | 137 | 1235 | 0.6275 | $ 1,060,707,105.28 |
| LIT | Lithium Australia NL | 10 | 20 | 15 | 181 | 0.1375 | $ 135,767,569.37 |
| AXE | Archer Materials | 10 | 4 | 87 | 233 | 1.6 | $ 403,371,547.41 |
| S2R | S2 Resources | 9 | 106 | 0 | -29 | 0.185 | $ 58,801,851.08 |
| NKL | Nickelx | 8 | -18 | 0.14 | $ 7,000,500.00 | ||
| TKL | Traka Resources | 7 | 25 | -12 | -35 | 0.015 | $ 9,331,618.41 |
| ARU | Arafura Resource | 7 | 15 | 42 | 153 | 0.235 | $ 348,738,149.70 |
| GBR | Greatbould Resources | 7 | 3 | 45 | 235 | 0.16 | $ 55,371,550.40 |
| ORE | Orocobre | 7 | 15 | 36 | 272 | 9.49 | $ 6,247,750,742.80 |
| SLZ | Sultan Resources | 6 | -7 | -34 | -14 | 0.19 | $ 12,516,190.02 |
| BRB | Breaker Res NL | 6 | 36 | 95 | 111 | 0.38 | $ 130,336,371.60 |
| RFR | Rafaella Resources | 5 | -6 | -25 | -6 | 0.079 | $ 15,450,135.86 |
| NWC | New World Resources | 5 | 18 | -21 | 72 | 0.079 | $ 130,093,508.07 |
| RMX | Red Mount Min | 5 | 17 | 5 | -25 | 0.0105 | $ 14,644,583.02 |
| JRL | Jindalee Resources | 4 | 23 | -2 | 255 | 2.7 | $ 143,375,509.90 |
| BEM | Blackearth Minerals | 4 | 4 | 0 | 150 | 0.125 | $ 26,087,432.04 |
| PLS | Pilbara Min | 4 | 22 | 95 | 478 | 2.29 | $ 7,007,967,315.36 |
| RNU | Renascor Res | 4 | 13 | 65 | 1200 | 0.13 | $ 245,521,400.80 |
| A8G | Australasian Gold | 4 | 72 | 0.68 | $ 28,202,755.68 | ||
| ADD | Adavale Resource | 4 | -3 | -24 | 75 | 0.056 | $ 17,927,689.18 |
| LOT | Lotus Resources | 3 | 23 | 97 | 287 | 0.325 | $ 315,152,201.98 |
| PUR | Pursuit Minerals | 3 | 0 | -44 | 169 | 0.035 | $ 31,858,473.14 |
| BOA | Boadicea Resources | 3 | 6 | -38 | 0 | 0.19 | $ 14,374,480.58 |
| PVW | PVW Res | 2 | 149 | 171 | 207 | 0.46 | $ 31,172,343.75 |
| BUX | Buxton Resources | 2 | 45 | 33 | 35 | 0.096 | $ 13,061,321.47 |
| SYR | Syrah Resources | 2 | 23 | 11 | 175 | 1.28 | $ 625,912,077.37 |
| CHN | Chalice Mining | 1 | 14 | -5 | 133 | 6.77 | $ 2,389,391,478.60 |
| MLX | Metals X | 1 | 6 | 38 | 368 | 0.365 | $ 335,688,444.79 |
| NMT | Neometals | 1 | 32 | 97 | 464 | 1.045 | $ 592,246,507.68 |
| NMT | Neometals | 1 | 32 | 97 | 464 | 1.045 | $ 592,246,507.68 |
| REE | Rarex | 1 | 2 | -3 | -16 | 0.0965 | $ 43,352,947.58 |
| MLS | Metals Australia | 0 | 0 | -33 | 0 | 0.002 | $ 10,477,114.72 |
| QPM | Queensland Pacific | 0 | -4 | 96 | 543 | 0.225 | $ 298,234,888.82 |
| MRC | Mineral Commodities | 0 | -7 | -36 | -58 | 0.14 | $ 74,898,688.76 |
| AJM | Altura Mining | 0 | 0 | 0 | 0 | 0.07 | $ 238,056,602.28 |
| LML | Lincoln Minerals | 0 | 0 | 0 | 0 | 0.008 | $ 4,599,869.49 |
| MMC | Mitremining | 0 | -7 | 0.215 | $ 5,687,871.00 | ||
| ATM | Aneka Tambang | 0 | 10 | 10 | 10 | 1.1 | $ 1,434,013.90 |
| AUZ | Australian Mines | 0 | 9 | 14 | 75 | 0.024 | $ 107,588,977.85 |
| VML | Vital Metals | 0 | -2 | -4 | 108 | 0.054 | $ 224,936,086.54 |
| LTR | Liontown Resources | 0 | 43 | 429 | 852 | 1.9 | $ 3,679,018,385.35 |
| IPT | Impact Minerals | 0 | -7 | -13 | -30 | 0.014 | $ 28,333,128.87 |
| IXR | Ionic Rare Earths | 0 | 11 | 39 | 179 | 0.039 | $ 132,303,581.05 |
| GED | Golden Deeps | 0 | 20 | 9 | -14 | 0.012 | $ 9,310,217.28 |
| VRC | Volt Resources | 0 | 3 | 25 | 200 | 0.03 | $ 74,137,760.34 |
| ESR | Estrella Res | 0 | -8 | -40 | -68 | 0.034 | $ 38,347,443.42 |
| FGR | First Graphene | 0 | 9 | -24 | 27 | 0.19 | $ 104,522,987.34 |
| DEV | Devex Resources | 0 | 22 | 32 | 35 | 0.31 | $ 93,889,359.94 |
| CZN | Corazon | 0 | 18 | 15 | -35 | 0.039 | $ 9,391,249.98 |
| GSR | Greenstone Resources | 0 | 0 | 4 | -26 | 0.025 | $ 20,101,967.23 |
| VIA | Viagold Rare Earth | 0 | 308 | 2339 | 10426 | 2 | $ 166,624,808.00 |
| BHP | BHP Group | 0 | 0 | -25 | 6 | 36.41 | $ 106,474,572,809.46 |
| MIN | Mineral Resources. | -1 | -10 | -21 | 52 | 38.33 | $ 7,153,645,992.68 |
| LYC | Lynas Rare Earths | -1 | 12 | 27 | 145 | 7.24 | $ 6,587,604,344.20 |
| VR8 | Vanadium Resources | -1 | 16 | 63 | 225 | 0.078 | $ 36,007,756.94 |
| PEK | Peak Resources | -1 | -15 | -13 | 112 | 0.07 | $ 135,174,987.35 |
| MOH | Moho Resources | -2 | -3 | -22 | -45 | 0.06 | $ 7,294,973.32 |
| EGR | Ecograf | -2 | -5 | 6 | 253 | 0.6 | $ 285,707,746.47 |
| HAS | Hastings Tech Met | -2 | 11 | 44 | 108 | 0.26 | $ 443,306,261.64 |
| NTU | Northern Min | -2 | 21 | 30 | 68 | 0.052 | $ 256,917,922.20 |
| AML | Aeon Metals . | -2 | -11 | -30 | -62 | 0.051 | $ 43,962,920.09 |
| PLL | Piedmont Lithium Inc | -2 | 15 | -5 | 159 | 0.8425 | $ 491,225,354.00 |
| ARL | Ardea Resources | -2 | 9 | 0 | 9 | 0.48 | $ 64,185,911.84 |
| GAL | Galileo Mining | -4 | -14 | -21 | -4 | 0.22 | $ 37,822,771.13 |
| AAJ | Aruma Resources | -2 | 7 | 34 | -17 | 0.087 | $ 10,832,689.26 |
| STK | Strickland Metals | -2 | 35 | 238 | -1 | 0.081 | $ 95,216,232.93 |
| SRL | Sunrise | -3 | 21 | -19 | -25 | 1.855 | $ 173,811,706.47 |
| ARN | Aldoro Resources | -3 | 36 | 54 | 329 | 0.515 | $ 43,814,226.56 |
| ARN | Aldoro Resources | -3 | 36 | 54 | 329 | 0.515 | $ 43,814,226.56 |
| OZL | OZ Minerals | -3 | 12 | -1 | 64 | 24.38 | $ 7,977,690,404.43 |
| PRL | Province Resources | -3 | 3 | -29 | 1206 | 0.15 | $ 169,448,971.65 |
| NIC | Nickel Mines | -3 | 10 | -14 | 21 | 1.01 | $ 2,552,754,486.77 |
| CLA | Celsius Resource | -4 | 8 | -42 | -21 | 0.026 | $ 28,275,158.19 |
| HYM | Hyperion Metals | -4 | -8 | -17 | 292 | 0.96 | $ 134,243,553.82 |
| RBX | Resource B | -5 | 3 | 488 | 488 | 0.2 | $ 7,590,041.15 |
| ILU | Iluka Resources | -5 | 2 | 10 | 79 | 8.94 | $ 3,728,412,633.02 |
| PAM | Pan Asia Metals | -5 | 17 | 256 | 200 | 0.48 | $ 36,829,322.00 |
| WKT | Walkabout Resources | -5 | -10 | -42 | 46 | 0.19 | $ 85,081,345.40 |
| SRI | Sipa Resources | -5 | -2 | -21 | -27 | 0.055 | $ 11,229,754.09 |
| VMC | Venus Metals Cor | -5 | 3 | 0 | -25 | 0.18 | $ 27,194,162.94 |
| TMT | Technology Metals | -5 | 0 | 4 | 11 | 0.355 | $ 69,017,976.27 |
| POS | Poseidon Nick | -5 | 1 | 35 | 28 | 0.088 | $ 263,500,519.24 |
| ARR | American Rare Earths | -5 | -3 | 101 | 75 | 0.175 | $ 59,409,237.68 |
| GME | GME Resources | -6 | -6 | 20 | 44 | 0.066 | $ 40,985,362.58 |
| COB | Cobalt Blue | -6 | 34 | 17 | 310 | 0.41 | $ 125,368,675.74 |
| CTM | Centaurus Metals | -6 | 0 | 49 | 97 | 1.005 | $ 347,166,342.52 |
| RXL | Rox Resources | -6 | -1 | -32 | -56 | 0.365 | $ 57,526,779.11 |
| MCR | Mincor Resources NL | -7 | 0 | 26 | 37 | 1.285 | $ 646,603,725.60 |
| JRV | Jervois Global | -7 | 7 | 29 | 112 | 0.53 | $ 803,150,619.84 |
| SGQ | St George Min | -7 | -6 | -34 | -54 | 0.062 | $ 38,297,410.91 |
| ALY | Alchemy Resource | -8 | -12 | -23 | -35 | 0.012 | $ 10,083,651.78 |
| TNG | TNG | -8 | 45 | 30 | 20 | 0.12 | $ 149,939,644.80 |
| SYA | Sayona Mining | -8 | -5 | 322 | 2073 | 0.1475 | $ 1,056,511,021.05 |
| IGO | IGO | -8 | 3 | 16 | 98 | 8.85 | $ 6,913,855,132.69 |
| IGO | IGO | -8 | 3 | 16 | 98 | 8.85 | $ 6,913,855,132.69 |
| AVL | Aust Vanadium | -8 | 0 | -4 | 100 | 0.022 | $ 72,178,160.58 |
| PAN | Panoramic Resources | -8 | 10 | 42 | 100 | 0.22 | $ 430,691,940.84 |
| MAN | Mandrake Res | -8 | -4 | -68 | -4 | 0.055 | $ 27,387,107.49 |
| AOU | Auroch Minerals | -9 | -3 | -26 | -14 | 0.16 | $ 46,415,214.23 |
| AR3 | Austrare | -9 | -15 | 0.79 | $ 33,587,495.25 | ||
| VUL | Vulcan Energy | -9 | -1 | 40 | 930 | 11.33 | $ 1,539,264,239.59 |
| CWX | Carawine Resources | -10 | -5 | -38 | -38 | 0.185 | $ 21,233,530.89 |
| CNJ | Conico | -10 | -20 | 17 | 17 | 0.035 | $ 38,008,165.21 |
| PGM | Platina Resources | -11 | 2 | -19 | 49 | 0.064 | $ 26,931,705.20 |
| AQD | Ausquest | -12 | -6 | -21 | -21 | 0.015 | $ 13,994,227.13 |
| AZS | Azure Minerals | -13 | 16 | 9 | 11 | 0.36 | $ 108,407,502.35 |
| NVA | Nova Minerals | -13 | 24 | -10 | -21 | 0.13 | $ 243,275,070.20 |
| BSX | Blackstone | -15 | 34 | 66 | 55 | 0.59 | $ 202,034,992.10 |
| LEG | Legend Mining | -16 | -19 | -56 | -53 | 0.057 | $ 165,308,143.26 |
| MRD | Mount Ridley Mines | -19 | 8 | -7 | 117 | 0.0065 | $ 39,246,503.66 |
Related Topics

Related Stories


UNLOCK INSIGHTS
Discover the untold stories of emerging ASX stocks.
Daily news and expert analysis, it's free to subscribe.
By proceeding, you confirm you understand that we handle personal information in accordance with our Privacy Policy.


