High Voltage: Let’s talk about Sachs… Goldman Sachs. And the gloomy lithium outlook it got right
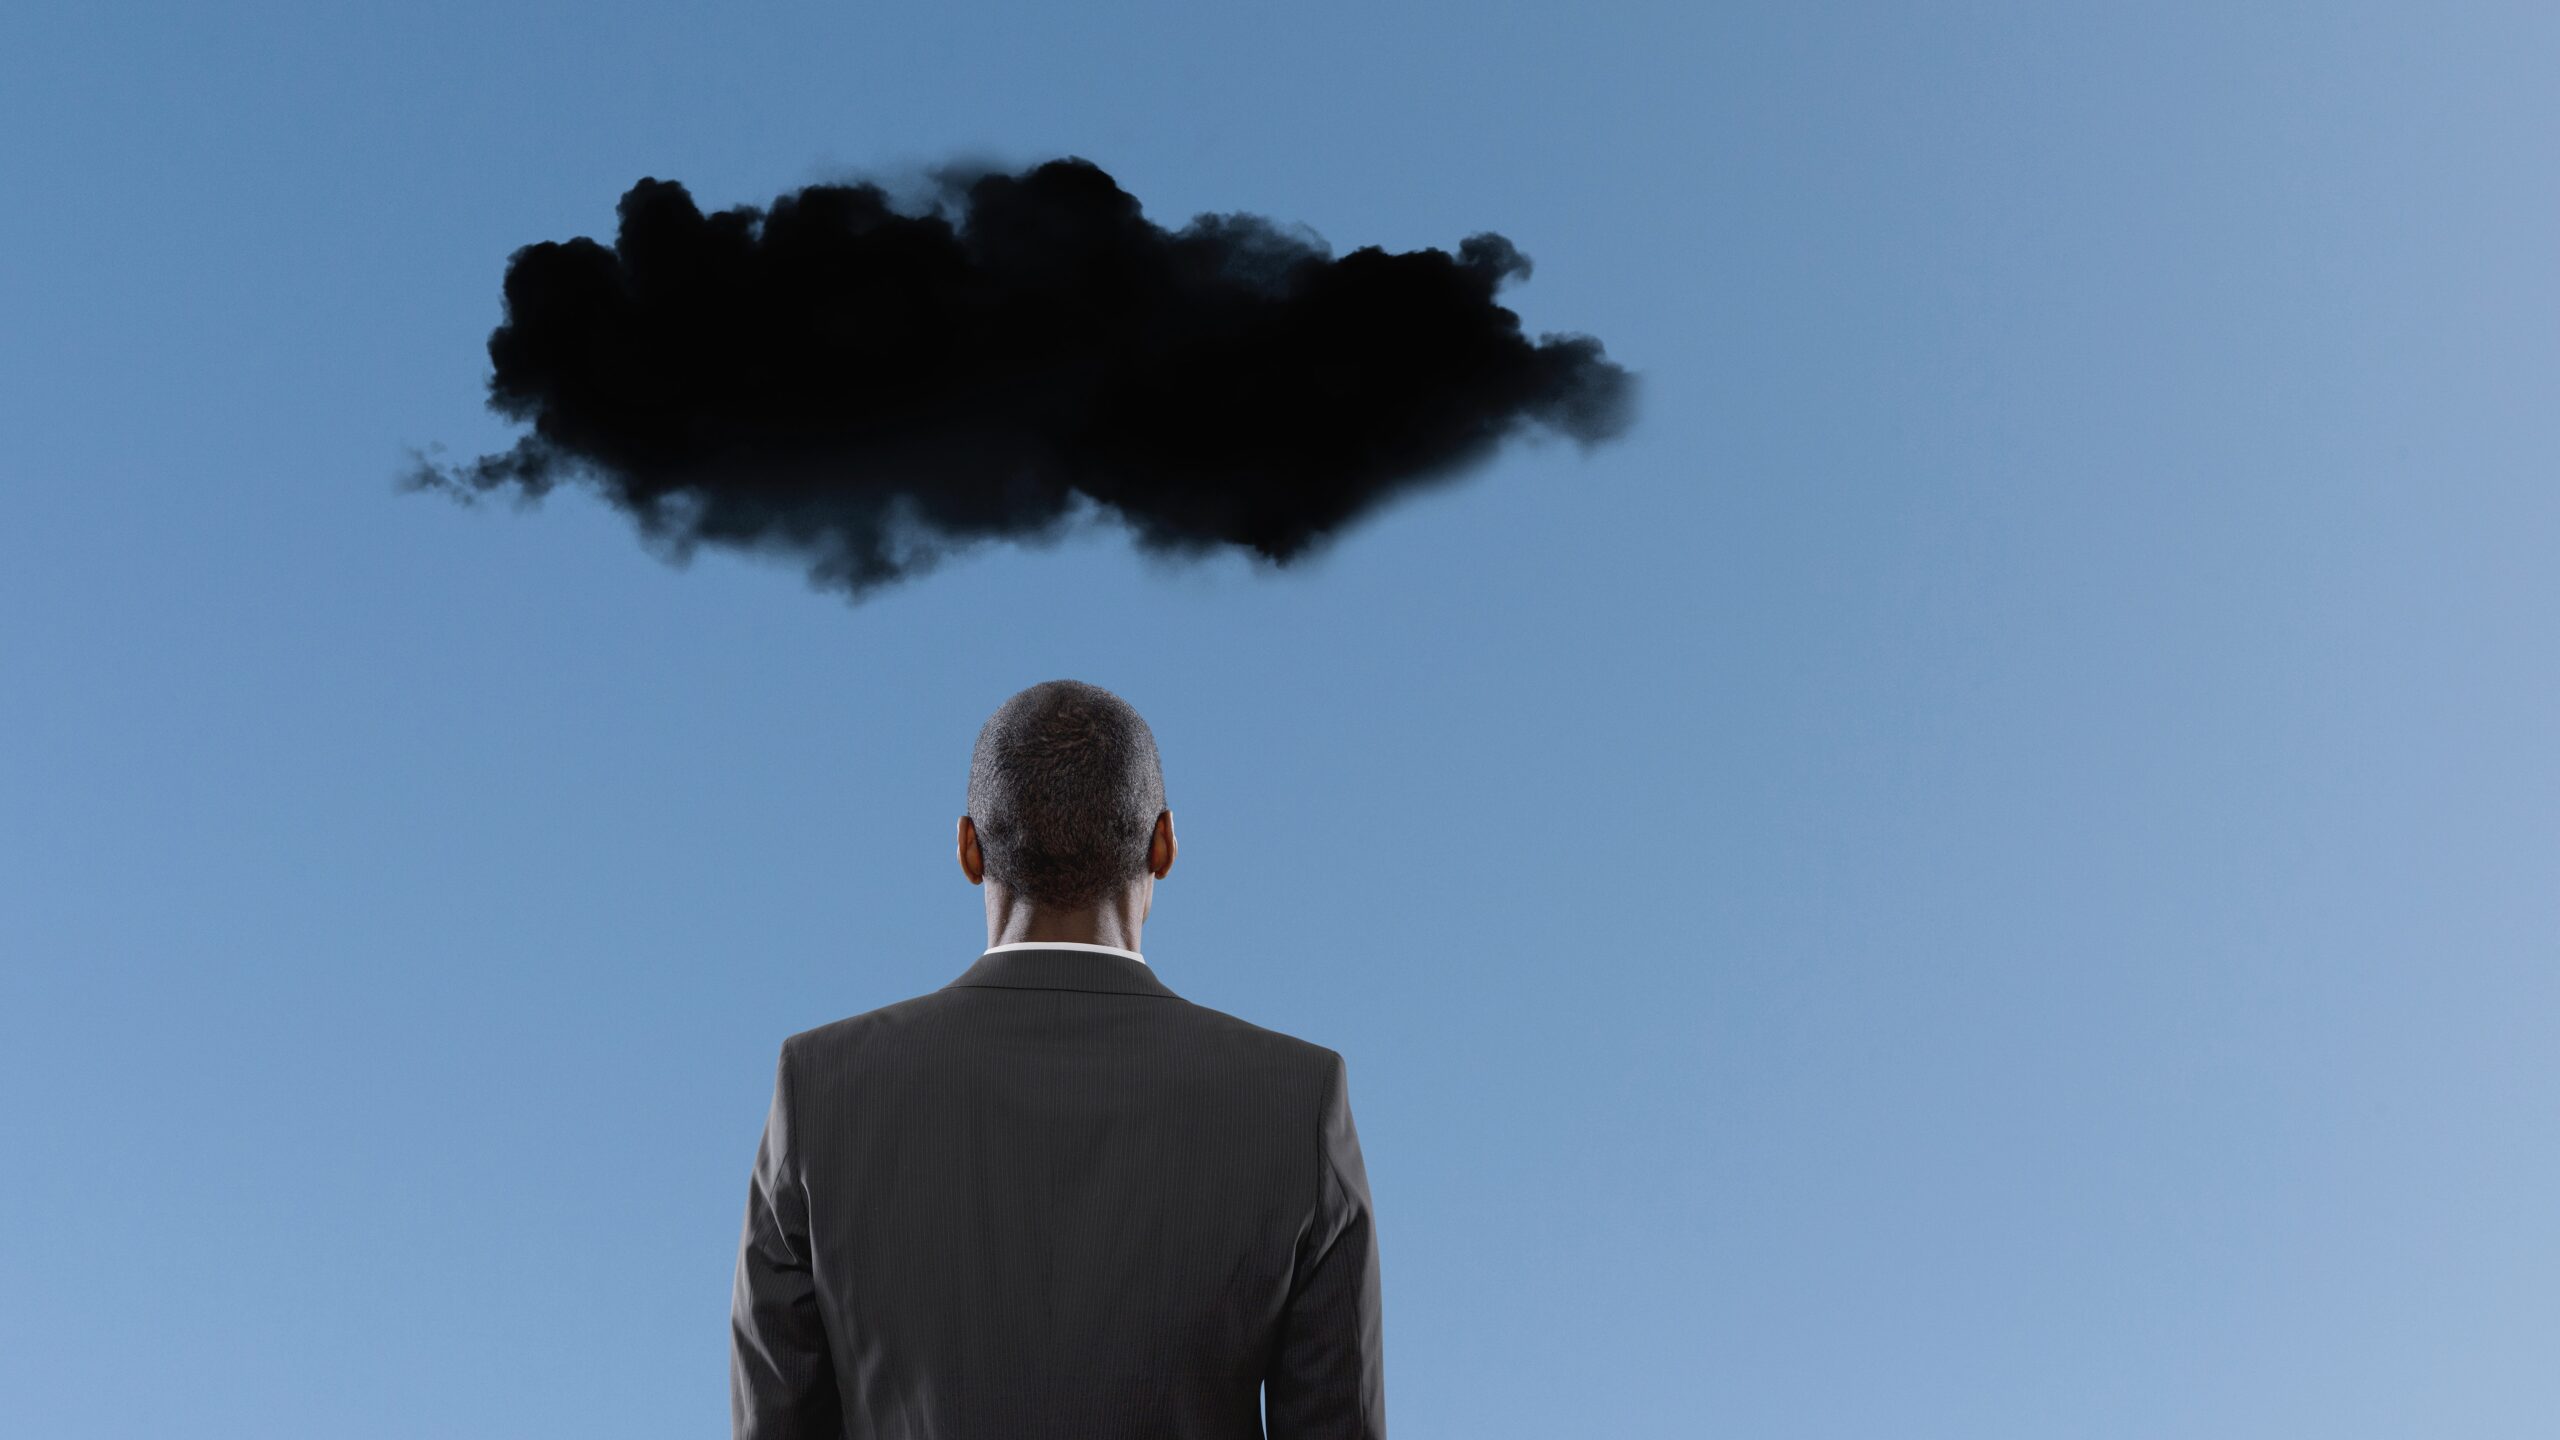
Pic via Getty Images
- Lithium spot prices and many related mining/exploration stocks are trending lower right now
- Was it something you said, Goldman Sachs? To be fair, it hasn’t been just GS with the downbeat forecasting
- At least some ASX battery metal hunters are gaining this past week, though
Our High Voltage column wraps the news driving ASX stocks with exposure to lithium, graphite, cobalt, nickel, rare earths, manganese, magnesium, and vanadium
First things first, where’s the latest commodity “spot” pricing at for the headline-stealing battery metal (which isn’t even the biggest component by size and weight in EV batteries)?
Here’s Lithium Price Bot with a quick-fire answer and a very limp looking line chart…
2023-12-04#Lithium Carbonate 99.5% Min China Spot
Price: $17,932.80
1 day: $280.20 (-1.54%) 📉
YTD: -75.67%#Spodumene Concentrate (6%, CIF China)Price: $1,700.00
1 day: -30 (-1.73%) 📉
YTD: -70.82%Sponsored by @SiennaResources $SIE $SNNAFhttps://t.co/pwsG2P1eQ7
— Lithium Price Bot (@LithiumPriceBot) December 4, 2023
Based on these industry standard Chinese-market-guided pricings, Li carbonate is down another percentage and a half on the daily and a depressing -75% YTD. Spodumene is trending something similar. Downwards.
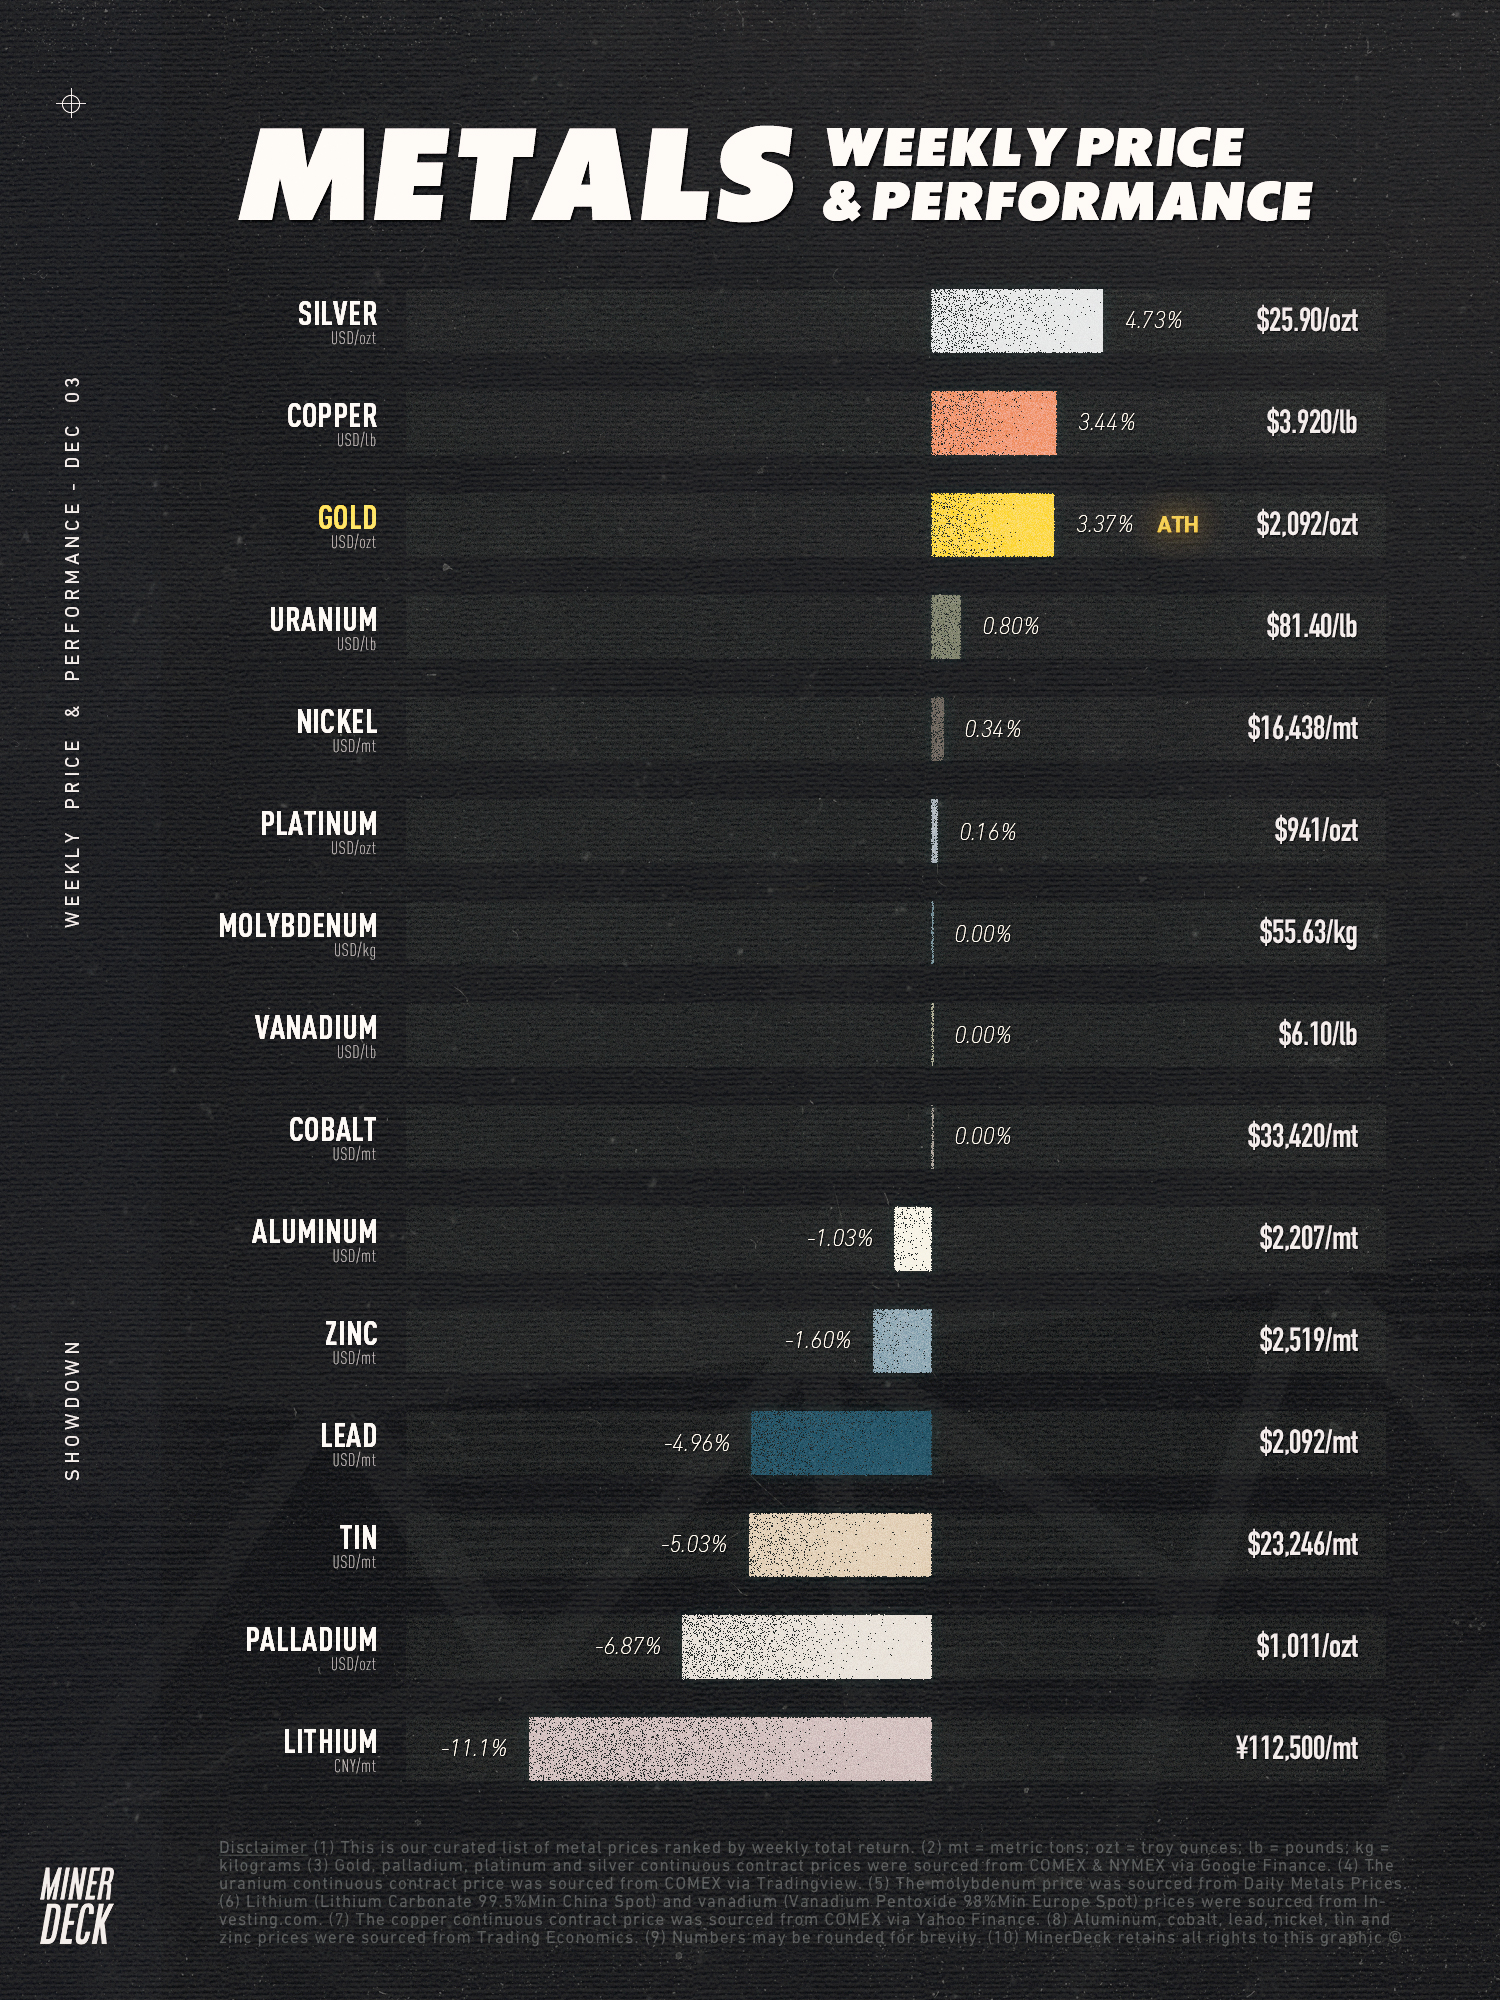
And here’s Miner Deck’s latest, which paints an even starker visual for lithium among its contemporaries right now… Look at those precious types up the top, lording it up. Kinda sucks to be a battery metal that isn’t nickel right now. Okay, copper, too.
Lithium pundit Chris Berry has a chart to share here, too. That lithium price movement is crypto-bubble-esque.
Battery metals since early 2018 (peak of last cycle) pic.twitter.com/g5mNbuphwn
— Chris Berry (@cberry1) December 4, 2023
Latest takes from Goldman…
Per its latest analysis (spread by the AFR on Dec 4) prominent investment banking firm Goldman Sachs says it expects the global lithium market to be in a 202,000 tonne surplus in 2024, which it says represents 17% of global demand.
The broker’s commodities analysts said they “expect prices to trade deeply into the cost curve to balance the market”, adding:
“In this context, we maintain our bearish view on the lithium market and lower our 12-month target for China Lithium Carbonate (excluding VAT) to US$11,000 a tonne and CME Asia CIF Lithium Hydroxide to US$12,000/t (from US$15,000/t and US$16,500/t respectively previously).
As we’ve mentioned in this column and elsewhere in Stockhead recently, Goldman is citing a large dip in battery demand out of China.
“The rise in chemical output has overtaken the growth in China battery output and China’s imports of spodumene concentrate – particularly from Australia and Zimbabwe – have continued to grow sharply,” said Goldman’s team.
They also said this:
“At the same point, there remains little evidence of supply rationing, with only an estimated 40kt of supply loss over the past 12 months due to cost pressures. However, with the market largely balanced year to date, the full extent of supply-led surplus is yet to be realised, with prices still 33% above the top end of the integrated cost curve.”
(For more on the broker’s latest views, read this Ground Breakers piece by Josh Chiat.)
… and UBS…
https://twitter.com/Stock_Vixen/status/1731470813701042498
Per Carl Capolingua’s Market Index-housed analysis on a recent UBS (Union Bank of Switzerland) research note, however, he says UBS acknowledges in the longer term that:
“It is hard to be all-out negative on a market that even on conservative estimates is expected to grow 2-3x by the end of 2030.”
“But, in the short-to-medium term, the demand-supply dynamics aren’t so rosy,” noted Capolingua, adding:
“To put some numbers to this narrative. UBS believes the demand side is likely to grow by around 25% in 2024, but supply is expected to grow 40%.”
… and Benchmark
Benchmark Mineral Intelligence has published a research note this week in which it forecasted “a more balanced market in 2024” but one which is “likely to keep prices at similar levels to today”.
Okay… so does that mean we’ve hit one big, long bottoming out then? Actually…
“Through constant contact with participants from across the lithium supply chain, short term expectations are that there remains scope for further price reductions in the near term,” continued the sector’s price reporting agency.
But… hang on, something to cling to here…
“Nonetheless, the slim forecasted surplus could swing into a deficit if only one major project delay occurs. Equally, should global EV sales rise 600,000 units above base case demand forecasts, the supply and demand dynamic would flip, which could lend some support to prices.”
Not an unthinkable scenario, says Benchmark, which adds that cheaper lithium prices will inevitably trickle down to enable cheaper EVs – “which would in turn accelerate demand for them”.
Has GS been pretty much on the money for a while now?
Say what you like about Goldman Sachs (Joe “Mr Lithium” Lowry certainly does), but some of its analysis on lithium forecasting leading into and throughout this year has (we say through gritted teeth) turned out to be pretty accurate.
No, we’re not saying they always get it right, no one does, but sometimes these institutional analysts earn their keep…
In January this year, Goldman said:
“Our least preferred commodities are the battery materials (lithium, nickel & cobalt) and thermal coal both on our forecasts for 2H surpluses.”
Well before that, Goldman famously tanked lithium stocks with a bearish note on 2023-2024 prices back in May of 2022, as pointed out in this Monsters of Rock article from almost a year ago.
And remember when MinRes boss Chris Ellison wanted to know what Goldman Sachs was smoking when it called the end of the lithium boom?
In 2022, bears were few and far between and largely in hibernation. Prices were heading towards 80k/t and everyone with lithium exposure in their portfolio was loving life.
Through boom and bust cycles, sections of the lithium market have scoffed at such bearish predictions from the likes of Goldman… but… whaddaya reckon – some credit where credit’s due?
We’ll turn to prominent lithium pundit Daniel Jimenez, though, for at least some sort of nod to balance on the latest negative Goldman outlook…
No surprise Goldman Sachs' bearish view on Li given the "optimistic" supply assumptions.
GS's 2023 supply forecast, for Aus, Chile and Argentina is 9%, 15% and 56% higher than iLiMarkets'. This is already hard data!!
With this bias it is hard to believe their 24 onwards… pic.twitter.com/T0GODV0GOs— Daniel Jimenez Sch (@D_Jimenez_Sch) November 30, 2023
What’s been surging?
(Circa 5pm-ish on December 5)
Charged up
Western Mines Group (ASX:WMG) +38% (Multiple intersections over 1% nickel)
Adavale Resources (ASX:ADD) +38% (Potential 700m nickel strike extend; and this isn’t battery metals we know, but it also had a key uranium licence granted)
Cosmo Metals (ASX:CMO)+31% (Up on no fresh news this week)
ASX battery metals form guide:
Scroll or swipe to reveal table. Click headings to sort. Best viewed on a laptop. (Note: figures accurate per ASX at 3pm.)
Stocks missing from this list?
Email [email protected]
| Code | Company | Price | % Week | % Month | % Year | % YTD | Market Cap |
|---|---|---|---|---|---|---|---|
| PVW | PVW Res Ltd | 0.051 | 4% | -11% | -58% | -5% | $5,171,644 |
| A8G | Australasian Metals | 0.17 | -3% | 0% | -28% | -2% | $8,860,484 |
| INF | Infinity Lithium | 0.1 | -11% | 18% | -44% | -2% | $50,885,130 |
| LPI | Lithium Pwr Int Ltd | 0.54 | 0% | 3% | 1% | 10% | $347,476,554 |
| PSC | Prospect Res Ltd | 0.082 | -17% | -10% | -47% | -4% | $41,236,545 |
| PAM | Pan Asia Metals | 0.135 | -7% | -10% | -69% | -28% | $25,053,215 |
| CXO | Core Lithium | 0.23 | -30% | -40% | -83% | -80% | $544,918,564 |
| LOT | Lotus Resources Ltd | 0.3 | 7% | 15% | 40% | 10% | $534,604,578 |
| AGY | Argosy Minerals Ltd | 0.15 | -14% | -12% | -77% | -42% | $224,705,200 |
| AZS | Azure Minerals | 3.57 | -11% | -7% | 1300% | 335% | $1,697,114,428 |
| NWC | New World Resources | 0.038 | -5% | 36% | -6% | 0% | $90,469,682 |
| QXR | Qx Resources Limited | 0.026 | -13% | 13% | -54% | -2% | $30,960,380 |
| GSR | Greenstone Resources | 0.008 | 14% | 0% | -77% | -2% | $12,313,021 |
| CAE | Cannindah Resources | 0.09 | -14% | -9% | -64% | -15% | $53,183,356 |
| AZL | Arizona Lithium Ltd | 0.036 | -14% | 100% | -49% | -3% | $133,780,576 |
| RIL | Redivium Limited | 0.006 | -25% | -14% | -71% | -1% | $16,385,129 |
| COB | Cobalt Blue Ltd | 0.265 | -21% | 4% | -61% | -32% | $103,230,075 |
| LPD | Lepidico Ltd | 0.0085 | 6% | -6% | -47% | -1% | $64,925,618 |
| MRD | Mount Ridley Mines | 0.002 | 0% | 0% | -50% | 0% | $15,569,766 |
| CZN | Corazon Ltd | 0.017 | -15% | 13% | 6% | 0% | $10,465,164 |
| LKE | Lake Resources | 0.12 | -20% | -27% | -88% | -68% | $177,805,588 |
| DEV | Devex Resources Ltd | 0.265 | 2% | -4% | -28% | -2% | $116,915,528 |
| INR | Ioneer Ltd | 0.14 | -7% | -20% | -77% | -24% | $306,154,761 |
| AVZ | AVZ Minerals Ltd | 0.78 | 0% | 0% | 0% | 0% | $2,752,409,203 |
| MAN | Mandrake Res Ltd | 0.04 | -2% | 18% | -7% | 0% | $25,246,157 |
| RLC | Reedy Lagoon Corp. | 0.006 | -14% | 50% | -48% | 0% | $4,316,785 |
| GBR | Greatbould Resources | 0.072 | 29% | 18% | -18% | -2% | $40,083,245 |
| FRS | Forrestaniaresources | 0.029 | -3% | -6% | -81% | -11% | $5,015,358 |
| STK | Strickland Metals | 0.165 | -6% | 6% | 267% | 13% | $293,357,352 |
| MLX | Metals X Limited | 0.255 | -6% | -11% | -11% | -13% | $240,425,508 |
| CLA | Celsius Resource Ltd | 0.0125 | 4% | 14% | -11% | 0% | $29,198,672 |
| FGR | First Graphene Ltd | 0.07 | 3% | -9% | -44% | -4% | $41,713,723 |
| HXG | Hexagon Energy | 0.009 | 0% | 0% | -47% | -1% | $4,616,243 |
| TLG | Talga Group Ltd | 0.885 | -10% | -19% | -38% | -52% | $339,108,922 |
| MNS | Magnis Energy Tech | 0.042 | -22% | -47% | -89% | -33% | $53,977,417 |
| PLL | Piedmont Lithium Inc | 0.37 | -12% | -19% | -55% | -28% | $147,054,720 |
| EUR | European Lithium Ltd | 0.069 | -15% | -8% | -17% | -1% | $101,779,460 |
| BKT | Black Rock Mining | 0.0765 | -23% | -36% | -49% | -6% | $87,785,571 |
| QEM | QEM Limited | 0.185 | -3% | -8% | 3% | 1% | $26,493,550 |
| LYC | Lynas Rare Earths | 6.24 | -4% | -13% | -31% | -161% | $6,019,431,524 |
| ESR | Estrella Res Ltd | 0.006 | 20% | 20% | -50% | -1% | $8,795,359 |
| ARL | Ardea Resources Ltd | 0.44 | -3% | -20% | -55% | -27% | $84,677,933 |
| GLN | Galan Lithium Ltd | 0.57 | -8% | -12% | -60% | -50% | $211,933,368 |
| JLL | Jindalee Lithium Ltd | 0.95 | 3% | -23% | -56% | -94% | $57,902,512 |
| VUL | Vulcan Energy | 2.26 | -4% | -4% | -69% | -407% | $400,930,109 |
| SBR | Sabre Resources | 0.029 | -24% | -26% | -28% | -1% | $12,673,107 |
| CHN | Chalice Mining Ltd | 1.485 | 1% | -23% | -74% | -482% | $604,837,938 |
| VRC | Volt Resources Ltd | 0.006 | 0% | -14% | -65% | -1% | $28,910,747 |
| NMT | Neometals Ltd | 0.185 | -18% | -22% | -82% | -59% | $118,205,531 |
| AXN | Alliance Nickel Ltd | 0.052 | -10% | -5% | -45% | -4% | $37,743,660 |
| PNN | Power Minerals Ltd | 0.2 | -20% | -26% | -68% | -33% | $19,215,309 |
| IGO | IGO Limited | 7.49 | -11% | -23% | -54% | -597% | $6,080,860,538 |
| GED | Golden Deeps | 0.049 | -8% | -2% | -46% | -4% | $5,545,073 |
| ADV | Ardiden Ltd | 0.2 | -9% | -15% | -48% | -10% | $11,253,151 |
| SRI | Sipa Resources Ltd | 0.021 | -16% | 5% | -48% | -1% | $4,791,321 |
| NTU | Northern Min Ltd | 0.033 | -6% | 0% | -21% | -1% | $200,973,294 |
| AXE | Archer Materials | 0.38 | -6% | -7% | -45% | -24% | $99,390,335 |
| PGM | Platina Resources | 0.024 | -4% | -14% | 33% | 1% | $16,202,689 |
| AAJ | Aruma Resources Ltd | 0.031 | -3% | -3% | -58% | -2% | $6,300,528 |
| IXR | Ionic Rare Earths | 0.022 | 10% | 10% | -44% | -1% | $92,796,213 |
| NIC | Nickel Industries | 0.68 | -6% | -17% | -34% | -29% | $3,042,925,015 |
| EVG | Evion Group NL | 0.033 | -3% | -18% | -65% | -4% | $12,108,572 |
| CWX | Carawine Resources | 0.115 | 5% | -4% | 28% | 2% | $25,973,799 |
| PLS | Pilbara Min Ltd | 3.23 | -9% | -14% | -34% | -52% | $10,623,403,190 |
| HAS | Hastings Tech Met | 0.7 | -4% | -20% | -83% | -282% | $88,616,157 |
| BUX | Buxton Resources Ltd | 0.185 | -3% | -10% | 87% | 7% | $32,916,909 |
| ARR | American Rare Earths | 0.135 | -16% | -4% | -44% | -6% | $64,731,378 |
| SGQ | St George Min Ltd | 0.0365 | 11% | -19% | -56% | -3% | $35,427,116 |
| TKL | Traka Resources | 0.004 | 0% | -20% | -33% | 0% | $3,501,317 |
| PAN | Panoramic Resources | 0.035 | 0% | 3% | -83% | -14% | $103,937,992 |
| PRL | Province Resources | 0.041 | 0% | 0% | -39% | -2% | $48,441,219 |
| IPT | Impact Minerals | 0.011 | 0% | 0% | 29% | 0% | $30,079,391 |
| LIT | Lithium Australia | 0.029 | -6% | -6% | -42% | -2% | $36,665,750 |
| AKE | Allkem Limited | 8.3 | -1% | -13% | -42% | -294% | $5,523,735,972 |
| ARN | Aldoro Resources | 0.083 | -1% | -12% | -71% | -8% | $11,173,771 |
| JRV | Jervois Global Ltd | 0.037 | -12% | 12% | -90% | -23% | $110,803,348 |
| SYR | Syrah Resources | 0.56 | -10% | -26% | -78% | -150% | $388,641,195 |
| FBM | Future Battery | 0.072 | -5% | -20% | 36% | 2% | $39,497,943 |
| ADD | Adavale Resource Ltd | 0.011 | 38% | 29% | -52% | -1% | $5,842,954 |
| LTR | Liontown Resources | 1.235 | -10% | -25% | -41% | -9% | $3,285,526,258 |
| CTM | Centaurus Metals Ltd | 0.485 | -3% | -6% | -59% | -64% | $242,480,240 |
| VML | Vital Metals Limited | 0.01 | 0% | 0% | -64% | -1% | $53,061,498 |
| BSX | Blackstone Ltd | 0.087 | 0% | -13% | -46% | -5% | $41,210,935 |
| POS | Poseidon Nick Ltd | 0.016 | -6% | -6% | -58% | -2% | $63,109,448 |
| CHR | Charger Metals | 0.24 | -11% | -11% | -59% | -21% | $17,815,020 |
| AVL | Aust Vanadium Ltd | 0.023 | 0% | -8% | -15% | 0% | $114,277,956 |
| AUZ | Australian Mines Ltd | 0.014 | 0% | 12% | -77% | -4% | $11,238,734 |
| TMT | Technology Metals | 0.21 | -9% | -2% | -37% | -14% | $53,400,057 |
| RXL | Rox Resources | 0.205 | 21% | -13% | 11% | 3% | $79,207,053 |
| RNU | Renascor Res Ltd | 0.135 | 0% | -13% | -60% | -8% | $342,820,012 |
| GL1 | Globallith | 1.24 | -5% | -5% | -47% | -61% | $325,331,624 |
| ASN | Anson Resources Ltd | 0.145 | 0% | -22% | -36% | -4% | $186,432,180 |
| SYA | Sayona Mining Ltd | 0.053 | -23% | -38% | -77% | -14% | $576,424,577 |
| FFX | Firefinch Ltd | 0.2 | 0% | 0% | 0% | 0% | $236,569,315 |
| EGR | Ecograf Limited | 0.155 | -9% | -11% | -44% | -7% | $72,645,091 |
| ATM | Aneka Tambang | 1.18 | 0% | 0% | 12% | 28% | $1,538,306 |
| TVN | Tivan Limited | 0.078 | 0% | 3% | -16% | 1% | $125,773,413 |
| ALY | Alchemy Resource Ltd | 0.01 | 0% | -9% | -63% | -1% | $11,191,724 |
| GAL | Galileo Mining Ltd | 0.275 | -5% | -13% | -73% | -61% | $52,370,606 |
| BHP | BHP Group Limited | 46.52 | 0% | 2% | 2% | 89% | ############## |
| LEL | Lithenergy | 0.58 | 6% | -18% | -41% | -19% | $60,775,900 |
| MMC | Mitremining | 0.29 | 29% | 29% | 16% | 1% | $12,698,028 |
| RMX | Red Mount Min Ltd | 0.0035 | 0% | -13% | -30% | 0% | $10,694,304 |
| GW1 | Greenwing Resources | 0.105 | -9% | -19% | -68% | -17% | $17,425,148 |
| AQD | Ausquest Limited | 0.013 | 18% | 8% | -35% | 0% | $10,726,940 |
| LML | Lincoln Minerals | 0.0055 | -21% | -21% | -20% | 0% | $8,469,226 |
| 1MC | Morella Corporation | 0.006 | 0% | 9% | -68% | -1% | $36,981,556 |
| REE | Rarex Limited | 0.028 | -15% | -3% | -43% | -3% | $17,768,051 |
| MRC | Mineral Commodities | 0.029 | -3% | -12% | -55% | -3% | $28,549,705 |
| PUR | Pursuit Minerals | 0.008 | -16% | -20% | -27% | -1% | $23,551,771 |
| QPM | Queensland Pacific | 0.052 | -2% | -13% | -58% | -6% | $104,652,096 |
| EMH | European Metals Hldg | 0.555 | -8% | -15% | -26% | -9% | $69,780,546 |
| BMM | Balkanminingandmin | 0.13 | -13% | 8% | -57% | -20% | $9,288,968 |
| PEK | Peak Rare Earths Ltd | 0.3525 | -6% | -12% | -23% | -10% | $95,270,928 |
| LEG | Legend Mining | 0.02 | 5% | 5% | -41% | -2% | $55,185,067 |
| MOH | Moho Resources | 0.009 | -10% | 50% | -61% | -1% | $4,590,600 |
| AML | Aeon Metals Ltd. | 0.012 | 9% | 9% | -60% | -2% | $12,060,407 |
| G88 | Golden Mile Res Ltd | 0.019 | -10% | -10% | -27% | 0% | $6,917,180 |
| WKT | Walkabout Resources | 0.15 | 7% | 20% | 43% | 1% | $100,689,218 |
| TON | Triton Min Ltd | 0.02 | -13% | -31% | -38% | -2% | $32,788,552 |
| AR3 | Austrare | 0.15 | -6% | -23% | -55% | -25% | $23,124,894 |
| ARU | Arafura Rare Earths | 0.195 | -3% | -7% | -56% | -27% | $422,672,938 |
| MIN | Mineral Resources. | 57.32 | -8% | -6% | -36% | -1988% | $11,695,570,766 |
| VMC | Venus Metals Cor Ltd | 0.1 | 0% | -9% | 27% | 2% | $19,921,512 |
| S2R | S2 Resources | 0.19 | 12% | 3% | 15% | 2% | $82,018,304 |
| CNJ | Conico Ltd | 0.005 | 0% | 0% | -44% | 0% | $7,065,427 |
| VR8 | Vanadium Resources | 0.045 | 0% | 2% | -27% | -1% | $24,756,104 |
| PVT | Pivotal Metals Ltd | 0.019 | -5% | 0% | -58% | -3% | $9,313,761 |
| BOA | Boadicea Resources | 0.036 | -12% | -8% | -61% | -6% | $4,431,251 |
| IPX | Iperionx Limited | 1.34 | -1% | -2% | 68% | 65% | $308,393,917 |
| SLZ | Sultan Resources Ltd | 0.014 | -13% | -7% | -83% | -7% | $2,371,041 |
| NKL | Nickelxltd | 0.06 | 5% | 7% | -33% | -2% | $5,268,910 |
| NVA | Nova Minerals Ltd | 0.295 | 18% | 13% | -60% | -39% | $59,049,189 |
| MLS | Metals Australia | 0.0345 | -1% | -9% | -23% | -1% | $22,465,303 |
| MQR | Marquee Resource Ltd | 0.025 | -17% | 0% | -56% | -1% | $11,574,763 |
| MRR | Minrex Resources Ltd | 0.017 | -11% | 31% | -59% | -2% | $18,442,748 |
| EVR | Ev Resources Ltd | 0.01 | -5% | -9% | -41% | 0% | $9,545,883 |
| EFE | Eastern Resources | 0.009 | -10% | 13% | -72% | -2% | $11,177,518 |
| CNB | Carnaby Resource Ltd | 0.69 | 13% | 8% | -20% | -25% | $114,806,668 |
| BNR | Bulletin Res Ltd | 0.115 | -28% | -30% | -4% | 2% | $38,166,843 |
| AX8 | Accelerate Resources | 0.038 | -7% | 3% | 31% | 2% | $19,352,090 |
| AM7 | Arcadia Minerals | 0.085 | 0% | 0% | -67% | -12% | $9,269,259 |
| AS2 | Askarimetalslimited | 0.175 | -8% | 0% | -55% | -26% | $13,923,038 |
| BYH | Bryah Resources Ltd | 0.013 | -7% | 0% | -53% | -1% | $6,504,109 |
| DTM | Dart Mining NL | 0.017 | 6% | -6% | -73% | -4% | $3,641,274 |
| EMS | Eastern Metals | 0.032 | 0% | 7% | -67% | -4% | $2,637,640 |
| FG1 | Flynngold | 0.064 | -24% | -4% | -39% | -4% | $10,365,076 |
| GSM | Golden State Mining | 0.018 | 6% | -10% | -63% | -3% | $4,538,345 |
| IMI | Infinitymining | 0.14 | 17% | 22% | -62% | -14% | $10,900,361 |
| LRV | Larvottoresources | 0.073 | -24% | -45% | -55% | -7% | $5,380,378 |
| LSR | Lodestar Minerals | 0.0045 | 13% | -10% | -18% | 0% | $8,093,589 |
| RAG | Ragnar Metals Ltd | 0.021 | -9% | -9% | 22% | 1% | $9,953,600 |
| CTN | Catalina Resources | 0.0035 | 17% | -13% | -56% | -1% | $4,334,704 |
| TMB | Tambourahmetals | 0.145 | 7% | 7% | 4% | 4% | $12,855,755 |
| TEM | Tempest Minerals | 0.008 | 0% | 0% | -70% | -2% | $4,091,068 |
| EMC | Everest Metals Corp | 0.083 | -11% | -13% | 11% | 0% | $14,042,347 |
| WML | Woomera Mining Ltd | 0.029 | 26% | 142% | 93% | 1% | $31,036,058 |
| KZR | Kalamazoo Resources | 0.125 | 0% | 28% | -43% | -9% | $22,278,031 |
| LMG | Latrobe Magnesium | 0.055 | -2% | 17% | -29% | -2% | $105,923,022 |
| KOR | Korab Resources | 0.017 | -6% | 13% | -39% | -1% | $6,239,850 |
| CMX | Chemxmaterials | 0.067 | -7% | -3% | -57% | -12% | $3,992,442 |
| NC1 | Nicoresourceslimited | 0.3 | 2% | -8% | -59% | -31% | $31,950,173 |
| GRE | Greentechmetals | 0.41 | -23% | -25% | 173% | 27% | $30,584,467 |
| CMO | Cosmometalslimited | 0.064 | 31% | 28% | -53% | -7% | $2,081,800 |
| FRB | Firebird Metals | 0.155 | -3% | 3% | -18% | 0% | $14,293,325 |
| S32 | South32 Limited | 3.06 | -1% | -8% | -27% | -94% | $14,131,286,732 |
| OMH | OM Holdings Limited | 0.47 | 1% | 1% | -32% | -23% | $336,073,618 |
| JMS | Jupiter Mines. | 0.165 | -3% | -11% | -18% | -6% | $333,028,476 |
| E25 | Element 25 Ltd | 0.5 | 4% | 20% | -56% | -38% | $107,677,516 |
| EMN | Euromanganese | 0.11 | 10% | 10% | -69% | -25% | $29,288,752 |
| KGD | Kula Gold Limited | 0.022 | -35% | 76% | -31% | 0% | $10,484,144 |
| LRS | Latin Resources Ltd | 0.17 | -8% | -37% | 17% | 7% | $499,051,116 |
| CRR | Critical Resources | 0.022 | -15% | -15% | -57% | -2% | $41,779,482 |
| ENT | Enterprise Metals | 0.003 | 0% | 0% | -67% | -1% | $2,398,413 |
| SCN | Scorpion Minerals | 0.039 | -20% | -24% | -46% | -3% | $16,268,248 |
| GCM | Green Critical Min | 0.0095 | -5% | 19% | -47% | -1% | $10,229,265 |
| ENV | Enova Mining Limited | 0.009 | 0% | 50% | -25% | -1% | $5,768,364 |
| RBX | Resource B | 0.084 | -1% | -35% | -3% | 0% | $6,945,497 |
| AKN | Auking Mining Ltd | 0.051 | -14% | 21% | -47% | -5% | $11,517,685 |
| RR1 | Reach Resources Ltd | 0.0055 | 10% | -54% | 38% | 0% | $16,051,486 |
| EMT | Emetals Limited | 0.007 | -13% | 0% | -42% | 0% | $5,950,000 |
| PNT | Panthermetalsltd | 0.056 | -2% | -23% | -65% | -13% | $3,424,400 |
| WIN | Widgienickellimited | 0.081 | -38% | -55% | -85% | -25% | $29,198,615 |
| WMG | Western Mines | 0.33 | 38% | 12% | 120% | 17% | $19,707,931 |
| AVW | Avira Resources Ltd | 0.0015 | 0% | 50% | -57% | 0% | $3,200,685 |
| CAI | Calidus Resources | 0.195 | 11% | 0% | -45% | -8% | $118,996,216 |
| GT1 | Greentechnology | 0.3 | -20% | -29% | -70% | -53% | $86,985,925 |
| KAI | Kairos Minerals Ltd | 0.015 | -3% | -12% | -43% | -1% | $39,313,683 |
| MTM | MTM Critical Metals | 0.025 | -4% | 4% | -75% | -5% | $2,483,427 |
| NWM | Norwest Minerals | 0.03 | -3% | -2% | -45% | -2% | $8,627,085 |
| PGD | Peregrine Gold | 0.275 | -11% | -8% | -36% | -11% | $15,795,797 |
| RAS | Ragusa Minerals Ltd | 0.04 | -9% | -5% | -73% | -8% | $5,703,951 |
| RGL | Riversgold | 0.016 | 14% | 78% | -53% | -1% | $15,220,183 |
| SRZ | Stellar Resources | 0.009 | 0% | 13% | -31% | 0% | $8,785,492 |
| STM | Sunstone Metals Ltd | 0.015 | -6% | -12% | -59% | -2% | $49,311,758 |
| ZNC | Zenith Minerals Ltd | 0.14 | -13% | 40% | -55% | -13% | $49,333,324 |
| WC8 | Wildcat Resources | 0.66 | -22% | -21% | 2100% | 64% | $818,508,528 |
| ASO | Aston Minerals Ltd | 0.03 | -3% | -9% | -67% | -5% | $40,146,992 |
| THR | Thor Energy PLC | 0.031 | 3% | 15% | -61% | -3% | $5,594,769 |
| YAR | Yari Minerals Ltd | 0.012 | -25% | -29% | -43% | -1% | $6,270,652 |
| IG6 | Internationalgraphit | 0.15 | -17% | -17% | -49% | -12% | $14,683,038 |
| LPM | Lithium Plus | 0.38 | -16% | -21% | -30% | 1% | $34,825,221 |
| ODE | Odessa Minerals Ltd | 0.007 | -22% | -13% | -53% | -1% | $7,576,895 |
| KOB | Kobaresourceslimited | 0.077 | -3% | 15% | -55% | -6% | $8,117,083 |
| AZI | Altamin Limited | 0.049 | -8% | -20% | -41% | -3% | $20,760,988 |
| FTL | Firetail Resources | 0.085 | -6% | -19% | -47% | -8% | $12,508,067 |
| LNR | Lanthanein Resources | 0.006 | -14% | -8% | -81% | -2% | $6,729,453 |
| CLZ | Classic Min Ltd | 0.001 | 0% | 0% | -90% | -1% | $12,357,082 |
| NVX | Novonix Limited | 0.68 | -2% | -7% | -71% | -79% | $342,033,929 |
| OCN | Oceanalithiumlimited | 0.125 | -7% | 9% | -74% | -22% | $6,634,563 |
| SUM | Summitminerals | 0.105 | -9% | 12% | -34% | -4% | $5,718,855 |
| DVP | Develop Global Ltd | 2.9 | -3% | -13% | -2% | -28% | $725,188,587 |
| XTCDA | Xantippe Res Ltd | 0.2 | 0% | 0% | -74% | -40% | $17,528,005 |
| OD6 | Od6Metalsltd | 0.165 | -11% | 10% | -65% | -17% | $9,077,557 |
| HRE | Heavy Rare Earths | 0.09 | 6% | 14% | -42% | -3% | $5,443,914 |
| LIN | Lindian Resources | 0.17 | 0% | -13% | -17% | 2% | $190,067,169 |
| PEK | Peak Rare Earths Ltd | 0.3525 | -6% | -12% | -23% | -10% | $95,270,928 |
| ILU | Iluka Resources | 6.72 | -2% | -10% | -35% | -281% | $2,999,267,406 |
| ASM | Ausstratmaterials | 1.28 | -12% | -27% | -30% | -16% | $220,165,416 |
| ETM | Energy Transition | 0.042 | 8% | 27% | -13% | -2% | $58,802,512 |
| VMS | Venture Minerals | 0.011 | 10% | 22% | -54% | -1% | $22,425,150 |
| IDA | Indiana Resources | 0.06 | 0% | 3% | 15% | 1% | $36,914,224 |
| VTM | Victory Metals Ltd | 0.235 | 0% | -13% | -6% | 2% | $19,011,419 |
| M2R | Miramar | 0.019 | 0% | 0% | -80% | -6% | $2,828,521 |
| WCN | White Cliff Min Ltd | 0.012 | 0% | 20% | -25% | 0% | $14,680,432 |
| TAR | Taruga Minerals | 0.011 | 10% | 5% | -72% | -1% | $7,766,295 |
| ABX | ABX Group Limited | 0.069 | -3% | 1% | -49% | -5% | $16,721,516 |
| MEK | Meeka Metals Limited | 0.04 | 11% | 0% | -44% | -3% | $52,182,193 |
| RR1 | Reach Resources Ltd | 0.0055 | 10% | -54% | 38% | 0% | $16,051,486 |
| DRE | Dreadnought Resources Ltd | 0.0325 | 2% | -4% | -69% | -7% | $114,079,195 |
| KFM | Kingfisher Mining | 0.16 | -11% | 14% | -75% | -32% | $9,131,550 |
| AOA | Ausmon Resorces | 0.003 | 0% | 0% | -63% | 0% | $3,020,998 |
| WC1 | Westcobarmetals | 0.059 | -6% | -5% | -68% | -11% | $6,836,940 |
| GRL | Godolphin Resources | 0.038 | 0% | 6% | -54% | -4% | $6,431,197 |
| DM1 | Desert Metals | 0.039 | 0% | 0% | -86% | -16% | $2,926,602 |
| PTR | Petratherm Ltd | 0.04 | -20% | -13% | -38% | -2% | $8,765,294 |
| ITM | Itech Minerals Ltd | 0.135 | -4% | 4% | -53% | -13% | $17,105,699 |
| KTA | Krakatoa Resources | 0.038 | -22% | 41% | -37% | -1% | $18,700,610 |
| M24 | Mamba Exploration | 0.03 | -6% | 3% | -81% | -12% | $1,829,500 |
| LNR | Lanthanein Resources | 0.006 | -14% | -8% | -81% | -2% | $6,729,453 |
| TKM | Trek Metals Ltd | 0.045 | -2% | -12% | -47% | -3% | $22,923,714 |
| BCA | Black Canyon Limited | 0.11 | -21% | -21% | -56% | -13% | $8,176,975 |
| CDT | Castle Minerals | 0.0095 | -5% | -14% | -62% | -1% | $12,244,930 |
| DLI | Delta Lithium | 0.44 | -5% | -22% | -14% | -2% | $290,517,113 |
| A11 | Atlantic Lithium | 0.505 | -1% | 17% | -37% | -12% | $309,182,038 |
| KNI | Kunikolimited | 0.25 | -2% | -17% | -55% | -26% | $22,335,630 |
| CY5 | Cygnus Metals Ltd | 0.1375 | -2% | -17% | -75% | -24% | $43,688,871 |
| WR1 | Winsome Resources | 1.055 | -4% | -26% | -16% | -18% | $209,993,608 |
| LLI | Loyal Lithium Ltd | 0.33 | -11% | -31% | -35% | 4% | $25,647,652 |
| BC8 | Black Cat Syndicate | 0.265 | 8% | 20% | -22% | -9% | $89,610,776 |
| BUR | Burleyminerals | 0.16 | 3% | -29% | -35% | -6% | $16,713,965 |
| PBL | Parabellumresources | 0.345 | 0% | 0% | -31% | 1% | $21,493,500 |
| L1M | Lightning Minerals | 0.145 | -6% | 16% | -31% | -2% | $6,333,760 |
| WA1 | Wa1Resourcesltd | 8.23 | 0% | -16% | 312% | 684% | $357,207,480 |
| EV1 | Evolutionenergy | 0.12 | -20% | -25% | -48% | -11% | $29,540,907 |
| 1AE | Auroraenergymetals | 0.08 | -5% | -27% | -60% | -7% | $12,258,934 |
| RVT | Richmond Vanadium | 0.305 | -2% | -20% | 0% | 7% | $26,724,420 |
| PMT | Patriotbatterymetals | 1.02 | -4% | -12% | 0% | 27% | $414,611,097 |
| PAT | Patriot Lithium | 0.19 | -7% | -10% | 0% | -8% | $13,018,255 |
| BM8 | Battery Age Minerals | 0.19 | -16% | -12% | -62% | -31% | $18,718,746 |
| OM1 | Omnia Metals Group | 0.078 | 0% | 0% | -53% | -8% | $3,786,192 |
| VHM | Vhmlimited | 0.7 | 8% | 46% | 0% | 0% | $101,584,643 |
| LLL | Leolithiumlimited | 0.505 | 0% | 0% | -11% | 2% | $498,553,663 |
| SRN | Surefire Rescs NL | 0.01 | 5% | -23% | -20% | 0% | $17,449,154 |
| SRL | Sunrise | 0.61 | 2% | -13% | -71% | -131% | $55,038,774 |
| SYR | Syrah Resources | 0.56 | -10% | -26% | -78% | -150% | $388,641,195 |
| EG1 | Evergreenlithium | 0.2 | 14% | 0% | 0% | 0% | $11,246,000 |
| WSR | Westar Resources | 0.025 | -7% | 39% | -50% | -3% | $4,633,938 |
| LU7 | Lithium Universe Ltd | 0.03 | -19% | -25% | 0% | 0% | $12,821,223 |
| MEI | Meteoric Resources | 0.2 | -5% | -18% | 1150% | 15% | $398,539,911 |
| REC | Rechargemetals | 0.11 | 0% | -15% | -15% | -3% | $11,691,957 |
| SLM | Solismineralsltd | 0.15 | -9% | -41% | 105% | 8% | $12,455,793 |
| DYM | Dynamicmetalslimited | 0.145 | -9% | -29% | 0% | 0% | $5,075,000 |
| TOR | Torque Met | 0.175 | -3% | -8% | -13% | -1% | $23,566,335 |
| ICL | Iceni Gold | 0.06 | -2% | 5% | -57% | -2% | $14,871,143 |
| TMX | Terrain Minerals | 0.005 | 25% | 0% | -29% | 0% | $6,767,139 |
| MHC | Manhattan Corp Ltd | 0.004 | 0% | 0% | -20% | 0% | $11,747,919 |
| MHK | Metalhawk. | 0.155 | -18% | 29% | -35% | -1% | $12,434,961 |
| ANX | Anax Metals Ltd | 0.026 | -7% | -16% | -55% | -3% | $12,984,776 |
| FIN | FIN Resources Ltd | 0.019 | -27% | -39% | -14% | 0% | $14,283,911 |
| LM1 | Leeuwin Metals Ltd | 0.185 | -18% | -31% | 0% | 0% | $9,203,126 |
| HAW | Hawthorn Resources | 0.098 | 5% | 5% | -22% | -2% | $26,801,249 |
| LCY | Legacy Iron Ore | 0.017 | 6% | 0% | -19% | 0% | $102,509,219 |
| RON | Roninresourcesltd | 0.2 | -2% | 54% | 5% | 4% | $6,839,619 |
| ASR | Asra Minerals Ltd | 0.008 | 0% | 33% | -50% | -1% | $13,031,966 |
| PFE | Panteraminerals | 0.059 | -2% | -2% | -46% | -5% | $6,317,280 |
Related Topics

Related Stories


UNLOCK INSIGHTS
Discover the untold stories of emerging ASX stocks.
Daily news and expert analysis, it's free to subscribe.
By proceeding, you confirm you understand that we handle personal information in accordance with our Privacy Policy.


