High Voltage: EV graveyards could be US$1b source of critical minerals by 2045
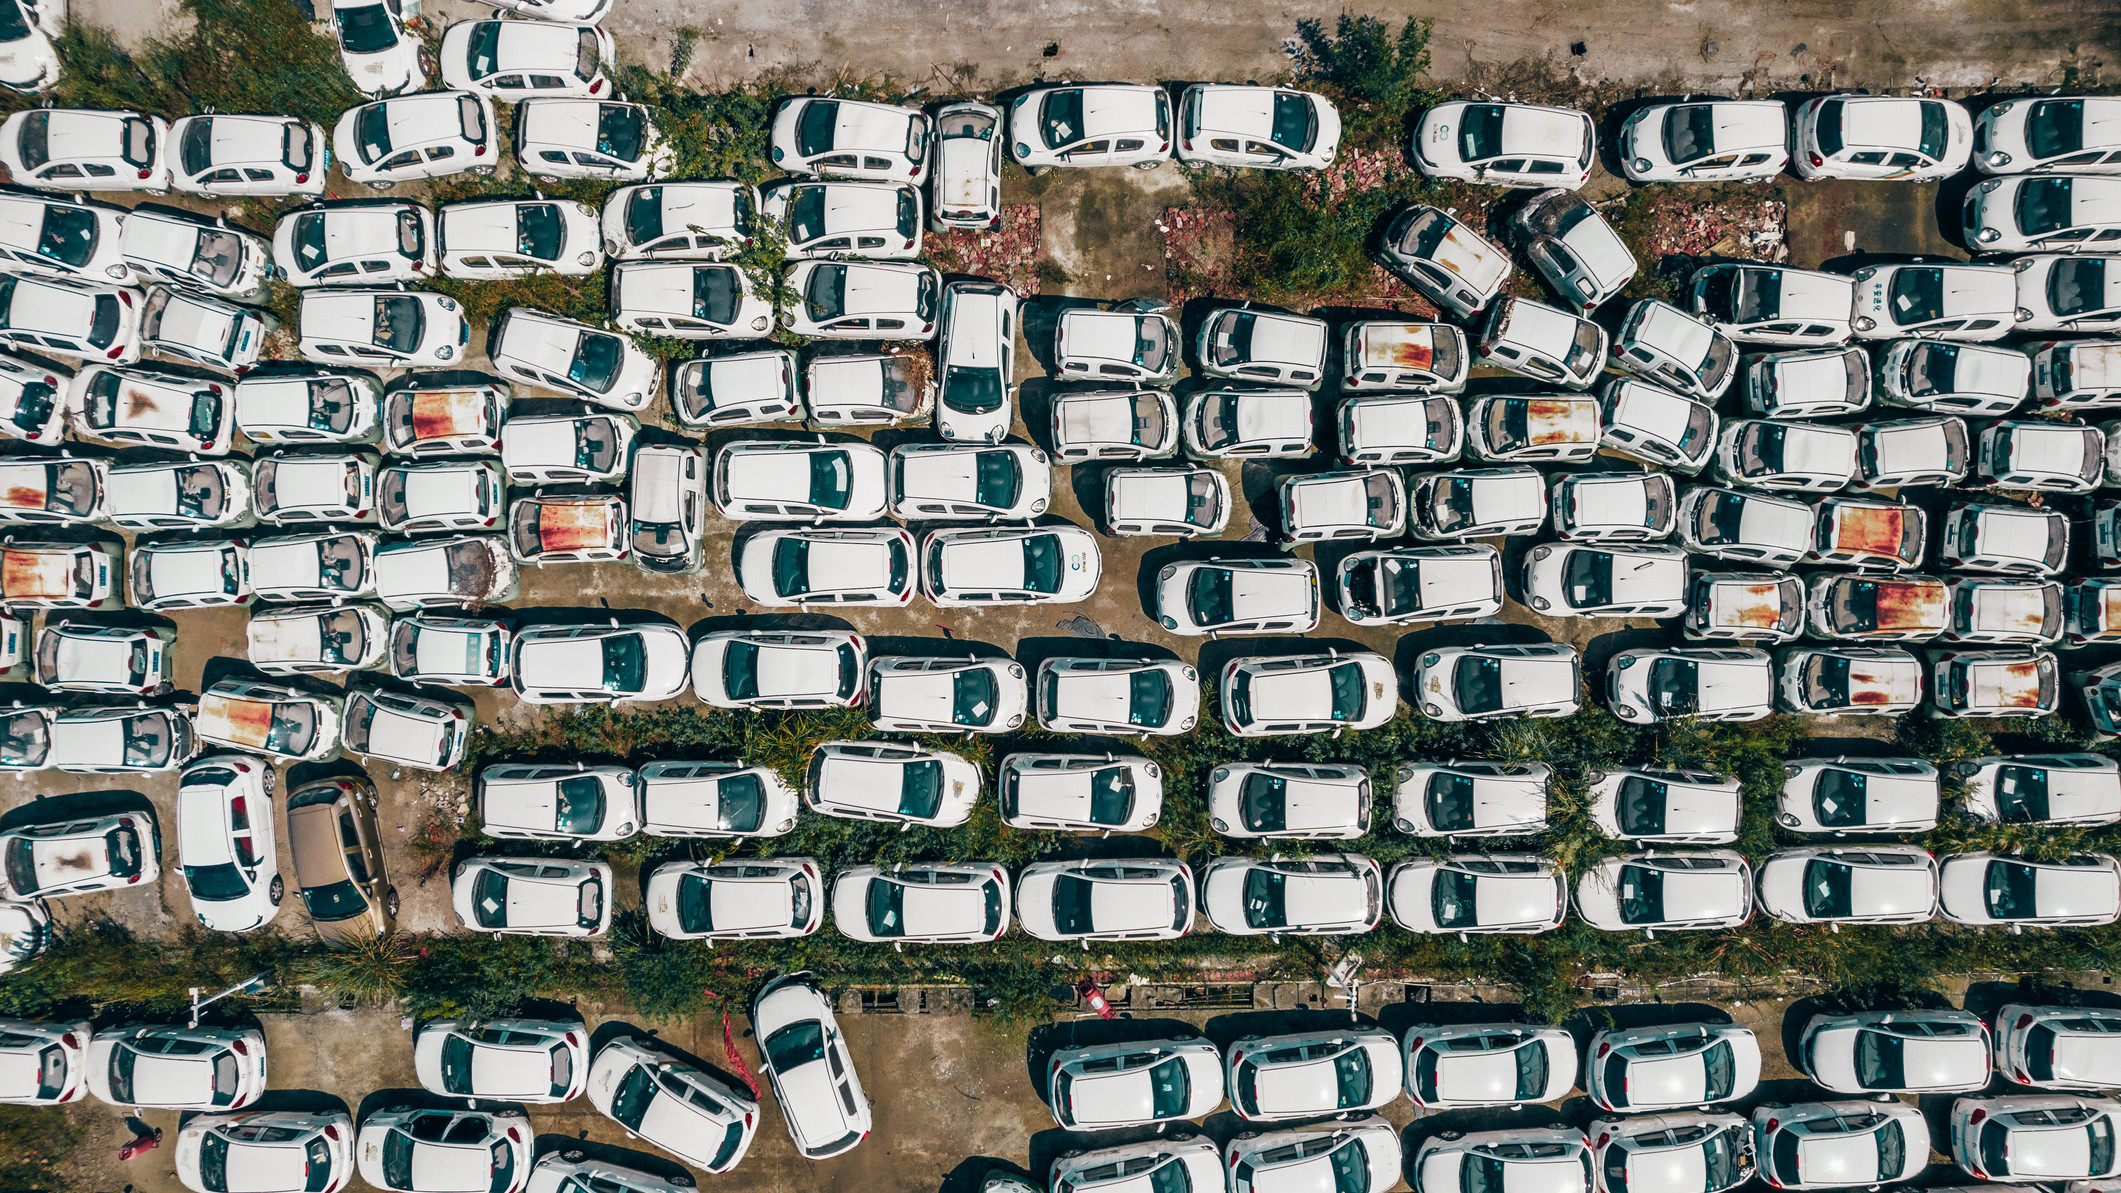
Millions of EVs are expected to reach retirement age in the coming decades. Pic: Getty Images.
- Reports says we could source US$1bn of critical minerals from EV scraps by 2045
- US$1600 worth of Li-ion battery metals and REEs could be recovered per vehicle
- Automotive OEMs are already building out circular rare earths supply chains
Our High Voltage column wraps all the news driving ASX stocks with exposure to lithium, cobalt, graphite, nickel, rare earths, and vanadium.
With over 100 million Electric Vehicles expected to reach end-of-life over the next two decades, IDTechEx reckons these automotive scraps could become an attractive source of critical minerals.
IDTechEx’s “Critical Material Recovery 2025-2045: Technologies, Markets, Players” report predicts that the value of critical materials recovered annually by 2045 will surpass a whopping US$100b.
The recovery of valuable platinum, palladium, and rhodium used in catalytic converters for emission control has long supported the auto scrap recycling market, with a typical internal combustion engine vehicle containing US$100s to US$1000s worth of PGMs.
But greater vehicle electrification presents critical metals and rare-earth elements used in Li-ion batteries and electric motors are the emerging value opportunity, the report states.
In electric vehicles, high-value critical material components reside within the battery and the electric motor.
Tens of kilograms of critical metals, such as lithium, nickel, and cobalt, are used in cathode materials within Li-ion batteries.
Plus, rare-earth elements such as neodymium, praseodymium, and terbium compose up to 33% by weight of the NdFeB permanent magnets used in the electric motor.
IDTechEx estimates that up to US$1600 worth of critical Li-ion battery metals and rare-earth elements can be recovered per electric vehicle.

Already automotive OEMs, including Ford, BMW, and Bentley, are building circular REE supply chains to mitigate supply challenges, but short term they’ll still have to weather low end-of-life component supply while the majority of EVs remain in use.
Long term, recovering these critical minerals from EVs is not so straightforward compared to ICE vehicles, so IDTechEx says pyrometallurgical (smelting) and hydrometallurgical metal extraction technologies will need to mature a bit before we’ll see this as a viable secondary source.
Battery Metals Winners and Losers
Here’s how a basket of ASX stocks with exposure to lithium, cobalt, graphite, nickel, rare earths, magnesium, manganese and vanadium is performing >>>
| CODE | COMPANY | PRICE | WEEK % | MONTH % | 6 MONTH % | YEAR % | YTD % | MARKET CAP |
|---|---|---|---|---|---|---|---|---|
| PVW | PVW Res Ltd | 0.021 | -5% | 0% | -19% | -70% | -56% | $ 2,654,500.34 |
| A8G | Australasian Metals | 0.13 | 24% | 8% | 83% | -7% | -24% | $ 6,775,664.22 |
| INF | Infinity Lithium | 0.035 | 0% | -29% | -54% | -61% | -65% | $ 16,190,723.26 |
| PSC | Prospect Res Ltd | 0.1 | 0% | 0% | 27% | 14% | 12% | $ 54,361,568.73 |
| PAM | Pan Asia Metals | 0.067 | 6% | -36% | -58% | -68% | -46% | $ 12,983,877.67 |
| CXO | Core Lithium | 0.1025 | 16% | 10% | -43% | -74% | -59% | $ 203,008,876.68 |
| LOT | Lotus Resources Ltd | 0.2325 | -3% | -7% | -42% | -17% | -18% | $ 440,022,360.48 |
| AGY | Argosy Minerals Ltd | 0.042 | 2% | 0% | -77% | -78% | -69% | $ 61,148,679.23 |
| NWC | New World Resources | 0.019 | 6% | 12% | -53% | -41% | -51% | $ 51,125,071.01 |
| QXR | Qx Resources Limited | 0.007 | 17% | 17% | -56% | -71% | -70% | $ 7,770,544.98 |
| CAE | Cannindah Resources | 0.043 | -7% | -14% | -34% | -67% | -57% | $ 25,435,517.93 |
| AZL | Arizona Lithium Ltd | 0.015 | 7% | -6% | -46% | -12% | -52% | $ 71,581,032.45 |
| RIL | Redivium Limited | 0.004 | 0% | 0% | 33% | -56% | -43% | $ 12,360,846.64 |
| COB | Cobalt Blue Ltd | 0.0695 | 4% | 1% | -52% | -75% | -70% | $ 28,728,282.66 |
| LPD | Lepidico Ltd | 0.0025 | 25% | 25% | -47% | -74% | -67% | $ 17,178,249.77 |
| MRD | Mount Ridley Mines | 0.001 | 0% | 0% | -50% | -50% | -50% | $ 7,784,882.87 |
| CZN | Corazon Ltd | 0.004 | 0% | 0% | -50% | -67% | -73% | $ 2,671,622.36 |
| LKE | Lake Resources | 0.043 | 19% | 30% | -41% | -76% | -67% | $ 68,409,353.95 |
| DEV | Devex Resources Ltd | 0.1375 | 6% | -29% | -56% | -64% | -43% | $ 66,253,600.65 |
| INR | Ioneer Ltd | 0.1625 | 12% | 35% | -2% | -36% | 8% | $ 385,675,340.00 |
| MAN | Mandrake Res Ltd | 0.027 | 13% | -13% | -30% | -29% | -37% | $ 16,652,517.84 |
| RLC | Reedy Lagoon Corp. | 0.003 | 0% | 0% | -25% | -40% | -40% | $ 1,858,622.20 |
| GBR | Greatbould Resources | 0.049 | 14% | 4% | -21% | -20% | -25% | $ 29,777,121.79 |
| FRS | Forrestaniaresources | 0.012 | 0% | -45% | -40% | -76% | -57% | $ 2,103,214.66 |
| STK | Strickland Metals | 0.096 | 4% | -13% | 8% | 100% | 1% | $ 211,863,815.23 |
| MLX | Metals X Limited | 0.425 | 6% | 12% | 18% | 39% | 47% | $ 385,141,828.48 |
| CLA | Celsius Resource Ltd | 0.011 | 0% | -15% | -15% | 5% | -8% | $ 29,134,952.92 |
| FGR | First Graphene Ltd | 0.049 | -2% | 0% | -14% | -27% | -31% | $ 32,548,334.43 |
| HXG | Hexagon Energy | 0.024 | -4% | 60% | 41% | 140% | 100% | $ 12,309,981.62 |
| TLG | Talga Group Ltd | 0.4 | -12% | -5% | -56% | -71% | -49% | $ 173,652,597.63 |
| MNS | Magnis Energy Tech | 0.042 | 0% | 0% | 0% | -51% | 0% | $ 50,378,922.34 |
| PLL | Piedmont Lithium Inc | 0.11 | 10% | -8% | -42% | -84% | -74% | $ 42,960,403.50 |
| EUR | European Lithium Ltd | 0.04 | 5% | 14% | -34% | -44% | -62% | $ 55,924,905.60 |
| BKT | Black Rock Mining | 0.055 | 2% | 4% | -19% | -38% | -35% | $ 68,862,672.18 |
| QEM | QEM Limited | 0.13 | -4% | 0% | -24% | -40% | -28% | $ 19,680,922.56 |
| LYC | Lynas Rare Earths | 6.755 | -4% | 8% | 17% | -9% | -6% | $ 6,300,000,566.90 |
| ESR | Estrella Res Ltd | 0.0065 | 8% | 30% | 63% | -13% | 30% | $ 11,815,083.81 |
| ARL | Ardea Resources Ltd | 0.4225 | -1% | -10% | -39% | -33% | -11% | $ 83,866,824.30 |
| GLN | Galan Lithium Ltd | 0.105 | -2% | -20% | -73% | -84% | -84% | $ 60,501,062.69 |
| JLL | Jindalee Lithium Ltd | 0.235 | -4% | -10% | -69% | -87% | -77% | $ 17,841,425.25 |
| VUL | Vulcan Energy | 3.75 | 6% | -2% | 10% | 10% | 32% | $ 679,360,741.31 |
| SBR | Sabre Resources | 0.014 | 17% | 8% | -26% | -69% | -58% | $ 5,501,467.06 |
| CHN | Chalice Mining Ltd | 1.4875 | 49% | 49% | 32% | -50% | -12% | $ 494,064,020.76 |
| VRC | Volt Resources Ltd | 0.004 | 0% | 0% | -20% | -53% | -38% | $ 16,634,712.51 |
| NMT | Neometals Ltd | 0.09 | 27% | 25% | -45% | -81% | -57% | $ 62,090,828.46 |
| AXN | Alliance Nickel Ltd | 0.039 | 22% | 11% | 18% | -51% | -9% | $ 28,307,744.99 |
| PNN | Power Minerals Ltd | 0.1 | 15% | 11% | -46% | -65% | -52% | $ 12,111,554.18 |
| IGO | IGO Limited | 5.065 | 4% | 0% | -31% | -62% | -44% | $ 3,922,647,271.34 |
| GED | Golden Deeps | 0.038 | -3% | 52% | -17% | -34% | -17% | $ 5,909,371.61 |
| ADV | Ardiden Ltd | 0.125 | -7% | -4% | -17% | -52% | -29% | $ 7,814,688.25 |
| SRI | Sipa Resources Ltd | 0.015 | 0% | 0% | -21% | -21% | -40% | $ 3,422,372.03 |
| NTU | Northern Min Ltd | 0.021 | -13% | -19% | -28% | -32% | -30% | $ 124,130,564.08 |
| AXE | Archer Materials | 0.225 | -4% | -8% | -48% | -52% | -41% | $ 57,340,577.93 |
| PGM | Platina Resources | 0.02 | 3% | -5% | -9% | -26% | -5% | $ 14,333,147.61 |
| AAJ | Aruma Resources Ltd | 0.018 | -33% | 13% | 6% | -45% | -33% | $ 4,219,105.27 |
| IXR | Ionic Rare Earths | 0.008 | 33% | 14% | -58% | -70% | -69% | $ 38,958,101.18 |
| NIC | Nickel Industries | 0.8325 | 10% | 1% | 10% | 2% | 20% | $ 3,557,222,200.40 |
| EVG | Evion Group NL | 0.023 | 0% | -4% | 0% | -28% | -32% | $ 7,633,190.11 |
| CWX | Carawine Resources | 0.091 | -4% | 0% | -13% | -16% | -17% | $ 21,487,415.86 |
| PLS | Pilbara Min Ltd | 2.875 | 22% | -1% | -26% | -36% | -27% | $ 8,582,048,478.00 |
| HAS | Hastings Tech Met | 0.28 | 4% | -2% | -52% | -70% | -60% | $ 49,727,186.85 |
| BUX | Buxton Resources Ltd | 0.064 | 5% | -15% | -47% | -71% | -62% | $ 13,360,658.43 |
| ARR | American Rare Earths | 0.275 | 8% | 8% | -14% | 77% | 67% | $ 135,966,407.23 |
| SGQ | St George Min Ltd | 0.031 | 11% | -3% | 41% | -23% | -9% | $ 33,744,753.39 |
| TKL | Traka Resources | 0.001 | -33% | -33% | -50% | -75% | -67% | $ 1,945,658.55 |
| PRL | Province Resources | 0.041 | 0% | 0% | 0% | 0% | 0% | $ 48,441,218.86 |
| IPT | Impact Minerals | 0.012 | -8% | -14% | -20% | 0% | 9% | $ 36,713,204.62 |
| LIT | Lithium Australia | 0.021 | 0% | 5% | -25% | -42% | -30% | $ 27,336,405.69 |
| ARN | Aldoro Resources | 0.08 | 0% | 10% | -1% | -33% | -36% | $ 10,769,899.44 |
| JRV | Jervois Global Ltd | 0.011 | -8% | -8% | -62% | -74% | -75% | $ 29,730,401.64 |
| SYR | Syrah Resources | 0.215 | 10% | -7% | -61% | -63% | -66% | $ 227,676,188.52 |
| FBM | Future Battery | 0.018 | 0% | -10% | -70% | -86% | -75% | $ 14,637,830.42 |
| ADD | Adavale Resource Ltd | 0.002 | 0% | -33% | -60% | -86% | -71% | $ 2,447,530.73 |
| LTR | Liontown Resources | 0.665 | 9% | -16% | -47% | -78% | -60% | $ 1,576,253,172.00 |
| CTM | Centaurus Metals Ltd | 0.425 | 8% | 21% | 42% | -41% | -21% | $ 210,891,659.75 |
| VML | Vital Metals Limited | 0.0025 | 25% | 0% | -44% | -75% | -62% | $ 11,790,133.90 |
| BSX | Blackstone Ltd | 0.046 | 15% | 84% | -19% | -61% | -34% | $ 23,229,224.35 |
| POS | Poseidon Nick Ltd | 0.0035 | 0% | -13% | -52% | -80% | -68% | $ 14,636,914.22 |
| CHR | Charger Metals | 0.09 | 10% | 32% | -25% | -53% | -45% | $ 6,967,822.50 |
| AVL | Aust Vanadium Ltd | 0.015 | 0% | 0% | -6% | -46% | -29% | $ 129,487,871.16 |
| AUZ | Australian Mines Ltd | 0.0075 | 7% | 7% | -46% | -50% | -25% | $ 9,789,584.87 |
| RXL | Rox Resources | 0.14 | 4% | 0% | -12% | -30% | -24% | $ 57,483,340.18 |
| RNU | Renascor Res Ltd | 0.09 | -5% | 2% | 6% | -25% | -31% | $ 223,681,011.05 |
| GL1 | Globallith | 0.18 | 9% | -25% | -69% | -88% | -85% | $ 46,905,819.48 |
| ASN | Anson Resources Ltd | 0.088 | -1% | -8% | -7% | -45% | -37% | $ 113,707,282.13 |
| SYA | Sayona Mining Ltd | 0.026 | 13% | 0% | -37% | -76% | -63% | $ 247,039,104.34 |
| EGR | Ecograf Limited | 0.097 | 2% | -3% | -46% | -16% | -31% | $ 43,587,054.62 |
| ATM | Aneka Tambang | 1.03 | 0% | 0% | -6% | -11% | -13% | $ 1,342,758.47 |
| TVN | Tivan Limited | 0.048 | 2% | 2% | -19% | -38% | -20% | $ 81,113,315.06 |
| ALY | Alchemy Resource Ltd | 0.006 | 0% | 0% | -14% | -45% | -40% | $ 7,068,457.54 |
| GAL | Galileo Mining Ltd | 0.16 | 3% | -6% | -33% | -48% | -44% | $ 31,619,988.32 |
| BHP | BHP Group Limited | 39.57 | 2% | -1% | -7% | -13% | -22% | $ 200,672,791,985.40 |
| LEL | Lithenergy | 0.31 | 0% | -10% | -48% | -49% | -46% | $ 34,160,478.55 |
| ASL | Andean Silver | 1.17 | 18% | 54% | 297% | 368% | 333% | $ 134,976,150.27 |
| RMX | Red Mount Min Ltd | 0.001 | 0% | 0% | -54% | -62% | -62% | $ 3,873,577.31 |
| GW1 | Greenwing Resources | 0.047 | -11% | -8% | -33% | -69% | -65% | $ 10,423,431.63 |
| AQD | Ausquest Limited | 0.009 | -10% | -18% | -18% | -31% | -18% | $ 7,426,343.01 |
| LML | Lincoln Minerals | 0.006 | 50% | 0% | 9% | 0% | 0% | $ 10,281,297.60 |
| 1MC | Morella Corporation | 0.032 | -3% | -11% | -57% | -79% | -77% | $ 8,935,551.27 |
| REE | Rarex Limited | 0.012 | 0% | 0% | -33% | -67% | -57% | $ 9,876,644.38 |
| MRC | Mineral Commodities | 0.026 | 0% | 0% | 8% | -38% | -19% | $ 25,596,287.57 |
| PUR | Pursuit Minerals | 0.0025 | -17% | -17% | -50% | -75% | -69% | $ 7,270,799.97 |
| QPM | Queensland Pacific | 0.03 | 0% | -9% | -30% | -51% | -45% | $ 75,635,365.74 |
| EMH | European Metals Hldg | 0.16 | -9% | -20% | -47% | -76% | -62% | $ 33,191,152.80 |
| BMM | Balkanminingandmin | 0.046 | 12% | 0% | -32% | -80% | -58% | $ 3,957,863.60 |
| PEK | Peak Rare Earths Ltd | 0.21 | 2% | 2% | 5% | -52% | -40% | $ 55,950,438.39 |
| LEG | Legend Mining | 0.013 | 0% | 18% | -19% | -48% | -7% | $ 37,823,203.41 |
| MOH | Moho Resources | 0.008 | 33% | 78% | 33% | 0% | -20% | $ 4,313,425.58 |
| AML | Aeon Metals Ltd. | 0.005 | 0% | 0% | -17% | -74% | -55% | $ 5,482,003.11 |
| G88 | Golden Mile Res Ltd | 0.009 | -18% | -10% | -31% | -76% | -53% | $ 3,701,005.70 |
| WKT | Walkabout Resources | 0.096 | 0% | -4% | -13% | -17% | -31% | $ 64,441,099.30 |
| TON | Triton Min Ltd | 0.011 | 38% | 10% | -27% | -50% | -52% | $ 17,252,276.07 |
| AR3 | Austrare | 0.063 | 7% | -14% | -45% | -74% | -58% | $ 9,951,715.94 |
| ARU | Arafura Rare Earths | 0.1575 | 5% | 2% | -33% | -44% | -5% | $ 394,292,590.56 |
| MIN | Mineral Resources. | 37.735 | 25% | -18% | -43% | -47% | -46% | $ 7,436,263,975.36 |
| VMC | Venus Metals Cor Ltd | 0.063 | 0% | -6% | -30% | -37% | -37% | $ 11,952,907.03 |
| S2R | S2 Resources | 0.086 | -3% | -22% | -34% | -49% | -48% | $ 38,945,787.40 |
| CNJ | Conico Ltd | 0.001 | -50% | 0% | -60% | -86% | -80% | $ 2,201,527.53 |
| VR8 | Vanadium Resources | 0.045 | 18% | 0% | 18% | -34% | -17% | $ 25,318,134.18 |
| PVT | Pivotal Metals Ltd | 0.014 | 27% | 8% | -7% | -13% | -44% | $ 9,153,537.71 |
| BOA | Boadicea Resources | 0.019 | 6% | -5% | -24% | -50% | -47% | $ 2,343,704.09 |
| IPX | Iperionx Limited | 2.72 | 2% | 28% | 32% | 71% | 96% | $ 683,745,039.18 |
| SLZ | Sultan Resources Ltd | 0.006 | 0% | 0% | -57% | -77% | -73% | $ 1,185,518.93 |
| NKL | Nickelxltd | 0.026 | 8% | 13% | -24% | -63% | -30% | $ 4,883,194.39 |
| NVA | Nova Minerals Ltd | 0.18 | 6% | 38% | -35% | -31% | -50% | $ 43,840,238.58 |
| MLS | Metals Australia | 0.026 | 24% | 37% | 13% | -21% | -30% | $ 18,907,707.62 |
| MQR | Marquee Resource Ltd | 0.017 | 13% | 55% | -15% | -51% | -35% | $ 7,078,534.49 |
| MRR | Minrex Resources Ltd | 0.009 | 0% | 13% | -36% | -40% | -47% | $ 9,763,807.53 |
| EVR | Ev Resources Ltd | 0.005 | 0% | 25% | -62% | -62% | -55% | $ 6,981,357.43 |
| EFE | Eastern Resources | 0.004 | 0% | 0% | -43% | -50% | -50% | $ 4,967,785.84 |
| CNB | Carnaby Resource Ltd | 0.375 | 3% | -6% | -26% | -61% | -53% | $ 62,757,094.79 |
| BNR | Bulletin Res Ltd | 0.042 | -2% | -2% | -46% | -45% | -70% | $ 12,331,759.57 |
| AX8 | Accelerate Resources | 0.009 | -10% | 0% | -70% | -57% | -79% | $ 5,595,785.39 |
| AM7 | Arcadia Minerals | 0.037 | 23% | 6% | -47% | -66% | -49% | $ 4,272,328.65 |
| AS2 | Askarimetalslimited | 0.019 | 0% | -10% | -78% | -92% | -89% | $ 1,765,262.63 |
| BYH | Bryah Resources Ltd | 0.005 | 0% | 0% | -38% | -70% | -62% | $ 2,516,434.28 |
| DTM | Dart Mining NL | 0.015 | 0% | 17% | 17% | -39% | -4% | $ 4,845,616.35 |
| EMS | Eastern Metals | 0.027 | -4% | 4% | -7% | -21% | -23% | $ 2,955,582.37 |
| FG1 | Flynngold | 0.028 | 12% | 8% | -26% | -47% | -38% | $ 7,137,661.16 |
| GSM | Golden State Mining | 0.009 | -10% | -18% | -25% | -78% | -40% | $ 2,514,335.67 |
| IMI | Infinitymining | 0.014 | 0% | -13% | -81% | -90% | -90% | $ 1,900,417.85 |
| LRV | Larvottoresources | 0.385 | -6% | 114% | 450% | 237% | 450% | $ 114,698,598.81 |
| LSR | Lodestar Minerals | 0.0015 | 50% | 50% | -6% | -69% | -53% | $ 3,372,328.92 |
| RAG | Ragnar Metals Ltd | 0.018 | 0% | -14% | -10% | -14% | -25% | $ 8,531,657.39 |
| CTN | Catalina Resources | 0.0025 | 25% | -17% | -38% | -38% | -44% | $ 3,096,217.23 |
| TMB | Tambourahmetals | 0.033 | 0% | -18% | -61% | -84% | -71% | $ 3,140,543.45 |
| TEM | Tempest Minerals | 0.01 | -9% | 0% | 16% | 5% | 31% | $ 6,899,967.68 |
| EMC | Everest Metals Corp | 0.115 | 5% | -2% | 44% | -8% | 44% | $ 21,422,557.54 |
| WML | Woomera Mining Ltd | 0.002 | -20% | -33% | -50% | -85% | -93% | $ 3,036,278.00 |
| KZR | Kalamazoo Resources | 0.082 | -2% | 32% | -14% | -29% | -32% | $ 14,961,067.76 |
| LMG | Latrobe Magnesium | 0.029 | -3% | -9% | -41% | -39% | -54% | $ 68,107,583.88 |
| KOR | Korab Resources | 0.008 | 0% | 0% | 14% | -58% | -50% | $ 2,936,400.00 |
| CMX | Chemxmaterials | 0.036 | 0% | 9% | -37% | -66% | -56% | $ 4,386,758.91 |
| NC1 | Nicoresourceslimited | 0.11 | -8% | 10% | -35% | -76% | -68% | $ 12,039,563.25 |
| GRE | Greentechmetals | 0.094 | 1% | 6% | -68% | -81% | -80% | $ 7,560,277.73 |
| CMO | Cosmometalslimited | 0.03 | -3% | -6% | -14% | -46% | -47% | $ 3,929,786.22 |
| FRB | Firebird Metals | 0.105 | 5% | -19% | -9% | -32% | -28% | $ 14,947,947.11 |
| S32 | South32 Limited | 3.185 | 7% | 7% | 6% | -5% | -4% | $ 14,629,505,174.64 |
| OMH | OM Holdings Limited | 0.355 | -10% | -10% | -13% | -31% | -20% | $ 272,021,164.36 |
| JMS | Jupiter Mines. | 0.16 | -6% | -24% | -11% | -18% | -3% | $ 313,680,851.04 |
| E25 | Element 25 Ltd | 0.205 | 0% | -5% | -7% | -55% | -51% | $ 45,082,042.21 |
| EMN | Euromanganese | 0.055 | -4% | 57% | -41% | -68% | -45% | $ 11,202,642.15 |
| KGD | Kula Gold Limited | 0.009 | 13% | -10% | 0% | -31% | -40% | $ 5,788,907.29 |
| LRS | Latin Resources Ltd | 0.195 | 22% | 3% | -11% | -36% | -32% | $ 532,269,697.97 |
| CRR | Critical Resources | 0.012 | 9% | 71% | -25% | -70% | -43% | $ 21,364,203.35 |
| ENT | Enterprise Metals | 0.004 | 0% | 33% | 33% | 0% | 0% | $ 4,413,269.00 |
| SCN | Scorpion Minerals | 0.02 | 54% | 33% | -26% | -67% | -39% | $ 7,779,667.65 |
| GCM | Green Critical Min | 0.0025 | 25% | 25% | -50% | -64% | -72% | $ 3,671,356.60 |
| ENV | Enova Mining Limited | 0.009 | -47% | 13% | -77% | 50% | -40% | $ 8,864,364.14 |
| RBX | Resource B | 0.034 | 0% | -15% | -24% | -77% | -55% | $ 2,811,272.49 |
| AKN | Auking Mining Ltd | 0.007 | -13% | -42% | -59% | -88% | -85% | $ 1,912,122.24 |
| RR1 | Reach Resources Ltd | 0.014 | 0% | 27% | -13% | -78% | -24% | $ 12,242,038.89 |
| EMT | Emetals Limited | 0.004 | 0% | -20% | -20% | -47% | -43% | $ 3,400,000.00 |
| PNT | Panthermetalsltd | 0.023 | 35% | 6% | -14% | -55% | -45% | $ 2,004,821.73 |
| WIN | WIN Metals | 0.034 | 3% | 55% | -35% | -83% | -62% | $ 11,547,886.21 |
| WMG | Western Mines | 0.235 | 7% | -16% | 47% | -19% | -10% | $ 19,584,747.71 |
| AVW | Avira Resources Ltd | 0.001 | 0% | 0% | 0% | -50% | -50% | $ 2,938,790.00 |
| CAI | Calidus Resources | 0.115 | 0% | 0% | -30% | -38% | -47% | $ 93,678,205.58 |
| GT1 | Greentechnology | 0.091 | 3% | 42% | -43% | -82% | -68% | $ 32,453,192.92 |
| KAI | Kairos Minerals Ltd | 0.012 | 20% | 20% | -8% | -48% | -14% | $ 31,570,946.27 |
| MTM | MTM Critical Metals | 0.066 | 38% | 83% | -11% | 61% | -3% | $ 18,553,052.10 |
| NWM | Norwest Minerals | 0.019 | -5% | -14% | -30% | -42% | -30% | $ 9,217,270.69 |
| PGD | Peregrine Gold | 0.15 | -9% | -29% | -33% | -53% | -38% | $ 10,181,763.15 |
| RAS | Ragusa Minerals Ltd | 0.015 | 0% | -12% | -48% | -62% | -58% | $ 2,138,981.79 |
| RGL | Riversgold | 0.0045 | 13% | 13% | -44% | -63% | -63% | $ 6,637,312.97 |
| SRZ | Stellar Resources | 0.0165 | 10% | 3% | 18% | 38% | 136% | $ 35,355,193.00 |
| STM | Sunstone Metals Ltd | 0.005 | 0% | -44% | -58% | -74% | -67% | $ 21,629,518.18 |
| ZNC | Zenith Minerals Ltd | 0.043 | 13% | -10% | -57% | -54% | -71% | $ 15,152,377.97 |
| WC8 | Wildcat Resources | 0.215 | 16% | -25% | -71% | -10% | -69% | $ 263,173,824.07 |
| ASO | Aston Minerals Ltd | 0.014 | 17% | 56% | 0% | -61% | -42% | $ 16,835,835.50 |
| THR | Thor Energy PLC | 0.017 | 21% | 13% | -32% | -62% | -43% | $ 3,914,645.57 |
| YAR | Yari Minerals Ltd | 0.003 | 0% | -25% | -50% | -84% | -74% | $ 1,447,073.44 |
| IG6 | Internationalgraphit | 0.07 | -13% | 3% | -55% | -62% | -56% | $ 12,774,849.78 |
| LPM | Lithium Plus | 0.11 | 18% | 5% | -33% | -70% | -69% | $ 14,612,400.00 |
| ODE | Odessa Minerals Ltd | 0.0025 | -17% | 25% | -50% | -79% | -72% | $ 2,608,206.34 |
| KOB | Kobaresourceslimited | 0.105 | -5% | -25% | -13% | 33% | 50% | $ 16,648,969.47 |
| AZI | Altamin Limited | 0.03 | 3% | -9% | -43% | -56% | -45% | $ 13,165,471.02 |
| FTL | Firetail Resources | 0.08 | 7% | 14% | 68% | -20% | 9% | $ 15,527,849.71 |
| LNR | Lanthanein Resources | 0.003 | 0% | 0% | 0% | -67% | -74% | $ 8,552,726.45 |
| CLZ | Classic Min Ltd | 0.001 | 0% | 0% | -98% | -98% | -98% | $ 1,439,025.56 |
| NVX | Novonix Limited | 0.55 | 4% | -10% | -44% | -42% | -25% | $ 266,580,610.38 |
| OCN | Oceanalithiumlimited | 0.035 | 40% | 17% | -43% | -84% | -71% | $ 2,804,932.00 |
| SUM | Summitminerals | 0.255 | 6% | 4% | 298% | 89% | 158% | $ 22,571,446.70 |
| DVP | Develop Global Ltd | 1.975 | -1% | -5% | -21% | -38% | -30% | $ 509,655,822.48 |
| OD6 | Od6Metalsltd | 0.045 | 10% | 10% | -48% | -72% | -68% | $ 5,791,057.79 |
| HRE | Heavy Rare Earths | 0.032 | 0% | 3% | -29% | -59% | -50% | $ 2,184,804.80 |
| LIN | Lindian Resources | 0.11 | 0% | -8% | -12% | -56% | -24% | $ 121,056,834.78 |
| PEK | Peak Rare Earths Ltd | 0.21 | 2% | 2% | 5% | -52% | -40% | $ 55,950,438.39 |
| ILU | Iluka Resources | 5.915 | 7% | 5% | -14% | -29% | -10% | $ 2,509,207,217.88 |
| ASM | Ausstratmaterials | 0.56 | 3% | 17% | -45% | -70% | -56% | $ 104,258,790.70 |
| ETM | Energy Transition | 0.024 | 9% | 0% | -37% | -40% | -38% | $ 32,400,299.59 |
| CRI | Criticalim | 0.013 | 8% | -28% | -38% | 8% | 86% | $ 34,720,409.22 |
| IDA | Indiana Resources | 0.095 | 1% | 3% | 19% | 56% | 19% | $ 59,630,899.94 |
| VTM | Victory Metals Ltd | 0.495 | 30% | 34% | 80% | 148% | 136% | $ 42,509,766.00 |
| M2R | Miramar | 0.0075 | -17% | 7% | -47% | -84% | -62% | $ 2,763,456.92 |
| WCN | White Cliff Min Ltd | 0.018 | 13% | 20% | 20% | 100% | 100% | $ 27,699,586.04 |
| TAR | Taruga Minerals | 0.008 | -11% | 14% | 14% | -11% | -27% | $ 5,648,214.28 |
| ABX | ABX Group Limited | 0.041 | -5% | -11% | -38% | -49% | -43% | $ 10,251,652.87 |
| MEK | Meeka Metals Limited | 0.058 | 14% | 7% | 57% | 18% | 45% | $ 85,619,393.44 |
| RR1 | Reach Resources Ltd | 0.014 | 0% | 27% | -13% | -78% | -24% | $ 12,242,038.89 |
| DRE | Dreadnought Resources Ltd | 0.0155 | 3% | -3% | -14% | -72% | -48% | $ 59,808,000.00 |
| KFM | Kingfisher Mining | 0.068 | 8% | 13% | -25% | -64% | -55% | $ 3,706,335.07 |
| AOA | Ausmon Resorces | 0.003 | 50% | 0% | 0% | 0% | 0% | $ 2,647,498.36 |
| WC1 | Westcobarmetals | 0.028 | -7% | -10% | -39% | -65% | -63% | $ 4,270,009.27 |
| GRL | Godolphin Resources | 0.015 | 7% | 25% | -58% | -62% | -62% | $ 2,994,477.09 |
| DM1 | Desert Metals | 0.023 | -8% | 0% | -26% | -49% | -55% | $ 6,104,790.94 |
| PTR | Petratherm Ltd | 0.046 | 130% | 142% | 130% | -23% | 31% | $ 11,089,672.85 |
| ITM | Itech Minerals Ltd | 0.066 | -6% | -1% | -12% | -62% | -40% | $ 11,610,006.38 |
| KTA | Krakatoa Resources | 0.012 | 20% | 20% | 33% | -40% | -67% | $ 5,193,179.42 |
| M24 | Mamba Exploration | 0.016 | 14% | 78% | -38% | -72% | -68% | $ 2,821,234.14 |
| LNR | Lanthanein Resources | 0.003 | 0% | 0% | 0% | -67% | -74% | $ 8,552,726.45 |
| TKM | Trek Metals Ltd | 0.033 | -11% | -21% | -6% | -40% | -18% | $ 16,944,604.45 |
| BCA | Black Canyon Limited | 0.052 | -7% | -21% | -48% | -61% | -63% | $ 4,251,284.13 |
| CDT | Castle Minerals | 0.0035 | -13% | -13% | -50% | -65% | -63% | $ 4,804,849.37 |
| DLI | Delta Lithium | 0.22 | 26% | 5% | -31% | -72% | -53% | $ 146,248,464.11 |
| A11 | Atlantic Lithium | 0.25 | 9% | -2% | -34% | -47% | -37% | $ 165,665,608.52 |
| KNI | Kunikolimited | 0.15 | 0% | -17% | -46% | -57% | -50% | $ 13,883,082.88 |
| CY5 | Cygnus Metals Ltd | 0.068 | 0% | 17% | 42% | -66% | -50% | $ 24,686,017.85 |
| WR1 | Winsome Resources | 0.51 | 16% | -10% | -43% | -67% | -51% | $ 112,493,780.36 |
| LLI | Loyal Lithium Ltd | 0.13 | 18% | 13% | -55% | -84% | -58% | $ 11,127,967.56 |
| BC8 | Black Cat Syndicate | 0.38 | 4% | 7% | 90% | 65% | 52% | $ 166,338,628.88 |
| BUR | Burleyminerals | 0.08 | -14% | -33% | 45% | -41% | -52% | $ 12,180,046.46 |
| PBL | Parabellumresources | 0.056 | 12% | 47% | -10% | -84% | -20% | $ 3,488,800.06 |
| L1M | Lightning Minerals | 0.072 | 9% | -10% | 9% | -49% | -49% | $ 6,889,633.13 |
| WA1 | Wa1Resourcesltd | 14.84 | -4% | 5% | 25% | 170% | 20% | $ 950,283,618.40 |
| EV1 | Evolutionenergy | 0.024 | 0% | -20% | -76% | -87% | -83% | $ 8,653,611.43 |
| 1AE | Auroraenergymetals | 0.042 | 20% | -30% | -60% | -53% | -63% | $ 6,983,485.74 |
| RVT | Richmond Vanadium | 0.305 | 3% | 2% | 2% | -25% | 9% | $ 25,862,341.80 |
| PMT | Patriotbatterymetals | 0.38 | 9% | -30% | -62% | -72% | -66% | $ 241,481,400.00 |
| PAT | Patriot Lithium | 0.037 | 12% | -24% | -51% | -79% | -79% | $ 3,725,296.74 |
| BM8 | Battery Age Minerals | 0.125 | 25% | 14% | -7% | -61% | -34% | $ 12,093,138.20 |
| OM1 | Omnia Metals Group | 0.078 | 0% | 0% | 0% | -14% | 0% | $ 4,550,567.66 |
| VHM | Vhmlimited | 0.565 | 9% | 24% | 5% | 3% | -20% | $ 91,892,820.32 |
| LLL | Leolithiumlimited | 0.505 | 0% | 0% | 0% | 0% | 0% | $ 605,458,341.55 |
| SRN | Surefire Rescs NL | 0.0055 | -8% | -8% | -45% | -63% | -35% | $ 10,924,692.97 |
| SRL | Sunrise | 0.425 | -6% | -6% | -10% | -52% | -7% | $ 37,895,549.16 |
| SYR | Syrah Resources | 0.215 | 10% | -7% | -61% | -63% | -66% | $ 227,676,188.52 |
| EG1 | Evergreenlithium | 0.04 | 14% | -13% | -62% | -86% | -79% | $ 2,249,200.00 |
| WSR | Westar Resources | 0.0085 | 21% | 6% | -25% | -65% | -53% | $ 3,389,160.91 |
| LU7 | Lithium Universe Ltd | 0.013 | 8% | -7% | -35% | -76% | -62% | $ 7,720,876.33 |
| MEI | Meteoric Resources | 0.096 | -1% | -4% | -60% | -56% | -63% | $ 213,082,642.81 |
| REC | Rechargemetals | 0.025 | -7% | -19% | -59% | -90% | -74% | $ 3,492,249.18 |
| SLM | Solismineralsltd | 0.094 | 1% | -10% | -15% | -72% | -35% | $ 7,273,936.11 |
| DYM | Dynamicmetalslimited | 0.205 | 17% | 41% | 0% | -18% | 46% | $ 7,020,000.00 |
| TOR | Torque Met | 0.1 | -17% | -5% | -33% | -70% | -55% | $ 18,843,892.60 |
| ICL | Iceni Gold | 0.038 | 12% | -10% | 52% | -54% | -27% | $ 9,546,636.82 |
| TMX | Terrain Minerals | 0.004 | 33% | 14% | 0% | -20% | -20% | $ 7,064,115.21 |
| MHC | Manhattan Corp Ltd | 0.001 | 0% | 0% | -60% | -83% | -70% | $ 4,638,800.01 |
| MHK | Metalhawk. | 0.12 | 33% | 21% | 67% | 20% | -11% | $ 9,060,300.18 |
| ANX | Anax Metals Ltd | 0.021 | 11% | 11% | 5% | -58% | -30% | $ 14,586,659.93 |
| FIN | FIN Resources Ltd | 0.005 | -17% | -29% | -74% | -58% | -77% | $ 3,246,343.50 |
| LM1 | Leeuwin Metals Ltd | 0.085 | 5% | 6% | 1% | -70% | -39% | $ 3,982,392.04 |
| HAW | Hawthorn Resources | 0.061 | 0% | 0% | -14% | -51% | -34% | $ 20,435,952.39 |
| LCY | Legacy Iron Ore | 0.013 | 0% | -13% | -13% | -13% | -24% | $ 100,276,127.41 |
| RON | Roninresourcesltd | 0.105 | -19% | -9% | 0% | -25% | -43% | $ 4,050,751.10 |
| ASR | Asra Minerals Ltd | 0.005 | -17% | -9% | 25% | -38% | -29% | $ 11,157,789.99 |
| PFE | Panteraminerals | 0.026 | 0% | 4% | -45% | -49% | -50% | $ 9,854,694.49 |
| KM1 | Kalimetalslimited | 0.125 | -7% | -19% | -71% | 0% | 0% | $ 10,371,729.24 |
| LTM | Arcadium Lithium PLC | 3.645 | 10% | -10% | -46% | 0% | -67% | $ 1,247,880,623.01 |
| KNG | Kingsland Minerals | 0.165 | 3% | -18% | -41% | -39% | -42% | $ 10,139,217.00 |
Up 142% for the month, Petratherm is the big critical minerals winner for the second week in a row according to High Voltage’s assessment, though these figures were clipped up before an 8% drop yesterday.
That came about after the company used the recent run in its shares to raise $1.6m in a share placement, with another $1m sought from existing shareholders in a share purchase plan.
Cashed-up, the explorer is seeking to start drilling operations in early October, having sampled high grade titanium rich heavy mineral sands over several kilometres at its Muckanippie project in South Australia.
“The Australian Government along with the United States, the European Union, India, Japan, South Korea and the United Kingdom designated Titanium as a critical mineral for essential modern technologies, economies and national security,” PTR said last week after releasing the results of sampling to the market.
“Titanium has uses in electric vehicles and battery storage, wind technology, pigments, and as an alloy in steel and superalloys..
The global market is expected to grow from US$28.6bn in 2022 to US$52bn by 2030.
Chalice is back over a $500 million valuation after a major run in recent days capped by a 14.5% gain yesterday.
Torched from mid-2023 as both nickel and platinum group metals prices came off and investors rebuked a poorly received scoping study on its Julimar nickel-copper-PGE project near Perth, Chalice has returned to the good books thanks to some upwards moves in palladium pricing.
Up at around US$1100/oz, plans from Sibanye to scale back production at its lossmaking US mines and suggestions Russia could put export restrictions on the precious metal have seen prices lift ~20% in around a week.
Chalice’s Gonneville deposit at Julimar was also awarded Strategic Project status by the WA Government on Tuesday, which will smooth its approvals pathway.
The mine, which has Mitsubishi on board as a strategic partner by way of a non-binding MoU, would become operational sometime around 2029 should metallurgical, permitting and financing questions be answered.
MTM announced further advancements in its flash joule heating processing technology yesterday, saying it achieved >90% lithium conversion in its spodumene calcination process testing.
The company thinks it can potentially revolutionise lithium processing flowsheets by improving the energy efficiency of the calcination process, the most energy intensive stage of lithium refining, accounting for over 50% of life cycle emissions.
“Achieving a commercial yield of over 90% for the calcination of spodumene is a significant breakthrough for the FJH process revolutionising how lithium is extracted in the future,” MTM CEO Michael Walshe said.
“The search for more sustainable, lower-energy calcination alternatives has long been a priority for the lithium industry, given the sheer energy and CO₂ intensity of traditional methods. While further testing is required, these results give us increased confidence in the FJH process.
“MTM continues to engage in commercial discussions with several leading industrial firms, and we look forward to providing further updates soon.”
Related Topics
Related Stories


UNLOCK INSIGHTS
Discover the untold stories of emerging ASX stocks.
Daily news and expert analysis, it's free to subscribe.
By proceeding, you confirm you understand that we handle personal information in accordance with our Privacy Policy.


