Gold Digger: US$3,000/oz gold price could be on the cards for 2023, mining boss says

Evolution Mining (ASX:EVN) exec Jake Klein. Pic: Diggers and Dealers.
- EVN’s Jake Klein predicts US$2-US$3,000/oz gold price for this time next year
- Is a wave of merger and acquisition activity coming in the ASX gold space?
- Bounce back in vehicle production to boost PGM demand
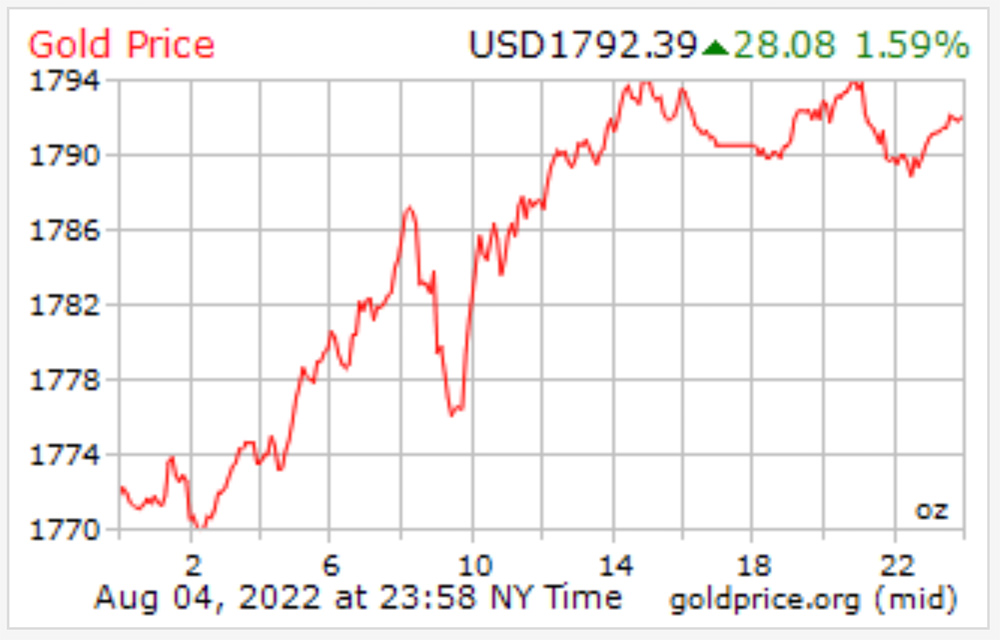
- Gold price hits a four-week high of +$US1792/oz
Our Gold Digger column wraps all the news driving ASX stocks with exposure to precious metals.
Klein predicts US$2-US$3,000/oz gold price for this time next year
Is a wave of merger and acquisition activity coming in the ASX gold space?
The gold sector is about to receive a big boost from a surging price, if Evolution (ASX:EVN) boss Jake Klein’s prediction of between US$2,000-US$3,000/oz by mid-2023 is correct.
“If Klein’s view is shared by others in the industry, standby for a wave of merger and acquisition activity where the bigger companies move on the developers and explorers with 1m-plus ounce gold resources with upside,” Fitzgerald says.
“The developers and developers are looking vulnerable to low-ball bids as they have to enjoy much of a recovery from their smashed levels from the March gold price fall, notwithstanding the gold price rally since.”
Bounce back in vehicle production to boost PGM prices
Three to seven grams of platinum group metals (PGMs) — mostly platinum, palladium and rhodium – go in every catalytic converter, which sit in your car exhaust to reduce polluting emissions.
Catalytic convertors account for as much as 80% of annual platinum and palladium production, respectively.
Metals Focus has now revised global light vehicle production numbers upwards for the first time this year as semiconductors become more readily available and China’s domestic production rebounds.
China has also slashed purchase tax for new cars by 50%, which Metals Focus says “not only benefits new energy vehicle sales, but also sales of hybrids and internal combustion engine (ICE) vehicles”.
This bounce back in Chinese automotive sales and production translated into improved regional demand for PGMs, Metals Focus says.
“In June, combined net palladium imports into China and Hong Kong surpassed 100koz, more than double the monthly average taken in during January to May far this year,” it says.
“Platinum, too, managed to outpace its elevated levels of demand with almost 1.4Moz imported so far this year.
Together, this has lent support to both metals’ prices, Metals Focus says.
“On 22nd July, when the trade data for June was published, the palladium price jumped US$150, its fifth best day so far this year,” it says.
“The price then posted further gains, climbing almost another US$150 in the last week of July to temporarily eclipse US$2,200.
“Similarly, platinum regained the US$900 handle for the first time since the start of the month.”
READ: A dodgy guide to recovering palladium from your old catalytic convertor
The gold price hits 1-month high, nears US$1,800/oz
A pretty good week for the gold price, which continues to rally as geopolitical tensions escalate and central bankers worldwide brace for recessions.
“Gold is rallying as Wall Street becomes fixated with a global economic slowdown that will get much worse by year end,” says Ed Moya, senior market analyst at OANDA.
The price was on the cusp of US$1,800/oz early Friday, NY time.
“Gold’s technical picture suggests it will continue grinding towards the $1900.00 region in the coming weeks,” says analyst Jeffrey Halley in his last note for OANDA (we’ll miss you Jeff).
“The first test of that will come in the form of the US Non-Farm Payrolls this evening. A soft US payroll number will likely support gold’s upward momentum, as it is likely to result in another bout of US Dollar weakness as yields fall.”
Winners & Losers
Here’s how ASX-listed precious metals stocks are performing:
Scroll or swipe to reveal table. Click headings to sort. Best viewed on a laptop.
Stocks missing from this list? Email [email protected]
| CODE | COMPANY | 1 WEEK RETURN % | 1 MONTH RETURN % | 6 MONTH RETURN % | 1 YEAR RETURN % | PRICE | MARKET CAP |
|---|---|---|---|---|---|---|---|
| PGD | Peregrine Gold | 88% | 119% | 50% | 76% | 0.79 | $16,080,533.70 |
| TSC | Twenty Seven Co. | 50% | 0% | -25% | -14% | 0.003 | $7,982,441.72 |
| MRR | Minrex Resources | 39% | 68% | -12% | 217% | 0.057 | $58,308,082.86 |
| CY5 | Cygnus Gold Limited | 34% | 43% | 23% | 34% | 0.215 | $25,366,842.73 |
| OBM | Ora Banda Mining | 34% | 81% | 38% | -50% | 0.067 | $87,935,187.39 |
| SPQ | Superior Resources | 32% | 61% | 21% | 287% | 0.058 | $86,762,241.32 |
| MBK | Metal Bank | 25% | 25% | -17% | -42% | 0.005 | $13,039,090.80 |
| SBR | Sabre Resources | 25% | 0% | 0% | 25% | 0.005 | $13,948,655.04 |
| MGV | Musgrave Minerals | 22% | 20% | -5% | -5% | 0.3 | $150,408,425.72 |
| SBM | St Barbara Limited | 22% | 52% | -7% | -30% | 1.25 | $987,039,069.28 |
| SLZ | Sultan Resources | 21% | 17% | -28% | -36% | 0.115 | $7,912,016.96 |
| AYM | Australia United Min | 20% | 20% | 0% | -33% | 0.006 | $11,055,464.91 |
| DCX | Discovex Res | 20% | 33% | -55% | 26% | 0.006 | $16,512,840.49 |
| G50 | Gold50Limited | 20% | 0% | -30% | 0% | 0.15 | $8,402,700.15 |
| MCT | Metalicity Limited | 20% | 0% | -65% | -69% | 0.003 | $8,646,765.02 |
| SKY | SKY Metals | 20% | 2% | -32% | -39% | 0.061 | $22,983,791.67 |
| TG1 | Techgen Metals | 19% | 60% | 23% | -16% | 0.16 | $7,073,346.56 |
| GSR | Greenstone Resources | 18% | 38% | 66% | 205% | 0.058 | $55,674,045.52 |
| EMR | Emerald Res NL | 18% | 9% | 11% | 32% | 1.175 | $697,187,405.03 |
| AXE | Archer Materials | 17% | 39% | -26% | -48% | 0.845 | $211,197,125.95 |
| GMN | Gold Mountain | 17% | 40% | -50% | -68% | 0.007 | $8,352,044.19 |
| KAI | Kairos Minerals | 15% | 50% | 15% | 0% | 0.03 | $56,900,711.24 |
| M24 | Mamba Exploration | 15% | 0% | -50% | -47% | 0.1 | $4,217,500.30 |
| IDA | Indiana Resources | 15% | 15% | 9% | -5% | 0.063 | $30,707,508.42 |
| CAI | Calidus Resources | 14% | 19% | 9% | 53% | 0.755 | $293,638,289.76 |
| CDT | Castle Minerals | 14% | 33% | -50% | 191% | 0.032 | $29,984,789.52 |
| RXL | Rox Resources | 14% | 14% | -33% | -32% | 0.285 | $43,924,646.22 |
| RXL | Rox Resources | 14% | 14% | -33% | -32% | 0.285 | $43,924,646.22 |
| AWJ | Auric Mining | 14% | 48% | -18% | -40% | 0.09 | $4,862,907.04 |
| TCG | Turaco Gold Limited | 14% | 28% | -33% | -47% | 0.074 | $33,789,616.85 |
| OKR | Okapi Resources | 13% | 16% | -31% | -52% | 0.22 | $27,187,769.60 |
| MOH | Moho Resources | 13% | 13% | -51% | -61% | 0.027 | $3,512,538.99 |
| PKO | Peako Limited | 13% | 50% | -10% | -40% | 0.018 | $6,169,082.02 |
| PNX | PNX Metals Limited | 13% | 13% | -10% | -42% | 0.0045 | $19,998,260.13 |
| RDS | Redstone Resources | 13% | 29% | -25% | -25% | 0.009 | $5,894,659.17 |
| DEG | De Grey Mining | 12% | 20% | -17% | -24% | 0.9825 | $1,311,921,059.58 |
| GBR | Greatbould Resources | 12% | 21% | -37% | -7% | 0.092 | $38,481,367.74 |
| KCN | Kingsgate Consolid. | 12% | 32% | 14% | 119% | 1.795 | $395,057,008.61 |
| ARV | Artemis Resources | 12% | -7% | -65% | -52% | 0.028 | $38,873,267.55 |
| PRS | Prospech Limited | 12% | 4% | -48% | -72% | 0.029 | $1,890,249.15 |
| ADT | Adriatic Metals | 12% | 9% | -7% | -29% | 2.13 | $448,782,217.20 |
| X64 | Ten Sixty Four | 11% | 2% | -1% | -20% | 0.66 | $147,031,814.15 |
| DRE | Dreadnought Resources | 11% | 47% | 76% | 71% | 0.072 | $198,872,348.57 |
| TLM | Talisman Mining | 11% | 7% | -9% | -28% | 0.155 | $29,099,622.04 |
| GMD | Genesis Minerals | 11% | 21% | -14% | 96% | 1.46 | $426,404,090.70 |
| RDT | Red Dirt Metals | 10% | 6% | -41% | 183% | 0.425 | $130,958,403.18 |
| KCC | Kincora Copper | 10% | 39% | -38% | -68% | 0.075 | $5,518,808.93 |
| BGL | Bellevue Gold | 10% | 34% | 14% | -19% | 0.8825 | $867,663,121.65 |
| KRM | Kingsrose Mining | 10% | -2% | -25% | 8% | 0.057 | $42,894,011.58 |
| CMM | Capricorn Metals | 10% | 27% | 27% | 89% | 4.13 | $1,495,139,243.70 |
| ZAG | Zuleika Gold | 10% | -8% | -41% | -26% | 0.023 | $11,474,113.75 |
| RED | Red 5 Limited | 9% | 18% | 0% | 53% | 0.29 | $659,896,367.20 |
| RSG | Resolute Mining | 9% | 31% | 4% | -47% | 0.295 | $314,702,520.17 |
| BAT | Battery Minerals | 9% | 0% | -48% | -65% | 0.006 | $17,426,838.70 |
| DCN | Dacian Gold | 9% | 30% | -35% | -51% | 0.12 | $151,123,438.00 |
| NST | Northern Star | 9% | 16% | -4% | -21% | 8.2 | $9,297,707,251.56 |
| LRL | Labyrinth Resources | 9% | -4% | -36% | -29% | 0.025 | $19,214,068.61 |
| CTO | Citigold Corp | 8% | 8% | -28% | -41% | 0.0065 | $17,001,954.55 |
| EVN | Evolution Mining | 8% | 11% | -25% | -35% | 2.73 | $4,857,470,359.95 |
| HMG | Hamelingoldlimited | 8% | 18% | -24% | 0% | 0.13 | $14,300,000.00 |
| HMG | Hamelingoldlimited | 8% | 18% | -24% | 0% | 0.13 | $14,300,000.00 |
| MEI | Meteoric Resources | 8% | 18% | -13% | -72% | 0.013 | $19,841,865.82 |
| NES | Nelson Resources. | 8% | 8% | -48% | -71% | 0.013 | $3,825,863.13 |
| PNR | Pantoro Limited | 8% | 0% | -35% | -7% | 0.195 | $299,468,044.19 |
| XAM | Xanadu Mines | 8% | 8% | -10% | -16% | 0.026 | $36,718,765.59 |
| RRL | Regis Resources | 8% | 27% | 2% | -29% | 1.8375 | $1,343,859,750.64 |
| GOR | Gold Road Res | 8% | 29% | 5% | 6% | 1.4475 | $1,530,875,704.93 |
| BRB | Breaker Res NL | 8% | 3% | -11% | 24% | 0.205 | $65,168,185.80 |
| NVA | Nova Minerals | 8% | 24% | 9% | -26% | 0.89 | $160,380,033.65 |
| IGO | IGO Limited | 8% | 16% | -5% | 21% | 11.52 | $8,428,390,758.69 |
| G88 | Golden Mile Res | 8% | -3% | -48% | -55% | 0.028 | $5,500,780.58 |
| ENR | Encounter Resources | 7% | 12% | 4% | -6% | 0.145 | $44,410,355.64 |
| TTM | Titan Minerals | 7% | -2% | -47% | -45% | 0.058 | $78,972,349.85 |
| WWI | West Wits Mining | 7% | 0% | -42% | -64% | 0.022 | $39,195,552.98 |
| WGX | Westgold Resources. | 7% | 9% | -29% | -28% | 1.33 | $601,500,867.10 |
| DEX | Duke Exploration | 7% | -3% | -56% | -74% | 0.075 | $6,765,836.40 |
| GMR | Golden Rim Resources | 7% | -12% | -43% | -50% | 0.06 | $18,520,890.36 |
| MVL | Marvel Gold Limited | 7% | 0% | -47% | -44% | 0.03 | $21,129,581.10 |
| WAF | West African Res | 7% | 13% | 20% | 21% | 1.4 | $1,424,336,491.49 |
| ANX | Anax Metals | 7% | 4% | -15% | 9% | 0.08 | $32,044,624.64 |
| GBZ | GBM Rsources | 7% | 5% | -49% | -51% | 0.064 | $33,889,924.47 |
| SVY | Stavely Minerals | 6% | -18% | -65% | -63% | 0.165 | $51,773,061.42 |
| HXG | Hexagon Energy | 6% | -15% | -70% | -75% | 0.017 | $8,206,654.42 |
| RDN | Raiden Resources | 6% | 21% | -53% | -66% | 0.0085 | $12,756,979.19 |
| YRL | Yandal Resources | 6% | 13% | -52% | -64% | 0.17 | $19,735,564.01 |
| TIE | Tietto Minerals | 6% | 43% | -12% | 43% | 0.515 | $474,959,035.98 |
| MEU | Marmota Limited | 6% | -13% | 13% | 8% | 0.052 | $52,988,671.10 |
| HRZ | Horizon | 6% | 0% | -40% | -40% | 0.072 | $43,289,057.28 |
| NAG | Nagambie Resources | 6% | 48% | 48% | -5% | 0.074 | $37,972,815.69 |
| AME | Alto Metals Limited | 6% | -5% | -22% | -25% | 0.0665 | $33,141,325.74 |
| CXU | Cauldron Energy | 6% | 19% | -50% | -68% | 0.0095 | $5,354,112.77 |
| VMC | Venus Metals Cor | 6% | 12% | 3% | 0% | 0.19 | $30,414,949.77 |
| LM8 | Lunnonmetalslimited | 5% | 43% | 25% | 87% | 0.97 | $105,481,081.92 |
| FEG | Far East Gold | 5% | 26% | 0% | 0% | 0.39 | $46,984,325.85 |
| RML | Resolution Minerals | 5% | 11% | -41% | -63% | 0.01 | $7,491,465.72 |
| AMI | Aurelia Metals | 5% | 3% | -37% | -22% | 0.2725 | $321,634,678.82 |
| MM8 | Medallion Metals. | 5% | -2% | -10% | -19% | 0.19 | $19,633,616.36 |
| SLR | Silver Lake Resource | 5% | 18% | 0% | -1% | 1.5175 | $1,347,252,370.99 |
| KIN | KIN Min NL | 5% | 27% | -10% | -35% | 0.09 | $77,952,055.23 |
| NWM | Norwest Minerals | 5% | 67% | -26% | -35% | 0.045 | $8,127,332.42 |
| PNT | Panthermetals | 5% | 2% | -6% | 0% | 0.225 | $6,597,500.00 |
| GIB | Gibb River Diamonds | 5% | 15% | -38% | -23% | 0.046 | $9,940,943.92 |
| AUT | Auteco Minerals | 4% | 9% | -47% | -53% | 0.049 | $101,297,806.23 |
| MTC | Metalstech | 4% | 12% | 42% | 108% | 0.37 | $63,332,544.20 |
| ALK | Alkane Resources | 4% | 22% | -2% | -31% | 0.8025 | $455,621,316.30 |
| MZZ | Matador Mining | 4% | -4% | -59% | -71% | 0.13 | $33,366,231.47 |
| BNZ | Benzmining | 4% | -7% | -41% | -49% | 0.4 | $20,813,274.04 |
| BMO | Bastion Minerals | 4% | -10% | -33% | -25% | 0.135 | $9,870,803.80 |
| FML | Focus Minerals | 4% | -10% | -47% | -51% | 0.135 | $38,685,417.08 |
| MEG | Megado Minerals | 4% | 1% | -5% | -26% | 0.081 | $8,614,855.04 |
| RGL | Riversgold | 4% | 4% | 47% | -19% | 0.028 | $21,178,527.97 |
| OKU | Oklo Resources | 4% | 4% | 32% | 12% | 0.145 | $73,151,989.46 |
| S2R | S2 Resources | 4% | 0% | -24% | -15% | 0.145 | $51,674,353.98 |
| NCM | Newcrest Mining | 3% | -7% | -15% | -28% | 19.26 | $16,978,272,925.47 |
| MLS | Metals Australia | 3% | 20% | 50% | 50% | 0.06 | $31,810,026.70 |
| BYH | Bryah Resources | 3% | 11% | -45% | -44% | 0.031 | $7,012,422.43 |
| MRZ | Mont Royal Resources | 3% | 2% | -7% | 59% | 0.31 | $20,781,144.81 |
| A1G | African Gold | 3% | 1% | -59% | -45% | 0.094 | $11,941,032.80 |
| SFR | Sandfire Resources | 3% | 1% | -34% | -33% | 4.52 | $1,795,720,691.34 |
| CHN | Chalice Mining | 3% | 30% | -39% | -29% | 4.88 | $1,813,752,475.08 |
| KSN | Kingston Resources | 3% | 3% | -34% | -53% | 0.099 | $39,213,096.71 |
| KWR | Kingwest Resources | 3% | 12% | -65% | -12% | 0.066 | $16,279,192.68 |
| BRV | Big River Gold | 3% | 3% | 52% | -8% | 0.35 | $87,002,562.50 |
| KAU | Kaiser Reef | 3% | 13% | -15% | -19% | 0.175 | $23,371,328.52 |
| VRC | Volt Resources | 3% | -3% | -12% | -31% | 0.0185 | $56,451,284.21 |
| SVL | Silver Mines Limited | 3% | 31% | -7% | -17% | 0.19 | $238,988,946.46 |
| LCY | Legacy Iron Ore | 3% | 11% | 5% | 43% | 0.02 | $128,136,523.98 |
| VAN | Vango Mining | 2% | 0% | -5% | -36% | 0.042 | $52,917,380.54 |
| PRU | Perseus Mining | 2% | 2% | 11% | 4% | 1.7 | $2,272,542,186.33 |
| IVR | Investigator Res | 2% | 23% | -20% | -30% | 0.049 | $59,954,114.57 |
| GCY | Gascoyne Res | 2% | 9% | -4% | -21% | 0.25 | $104,378,637.23 |
| GCY | Gascoyne Res | 2% | 9% | -4% | -21% | 0.25 | $104,378,637.23 |
| GSM | Golden State Mining | 2% | 16% | -44% | -66% | 0.05 | $6,170,329.91 |
| ICG | Inca Minerals | 2% | -39% | -44% | -42% | 0.056 | $26,986,105.38 |
| NML | Navarre Minerals | 2% | 20% | -34% | -35% | 0.059 | $83,295,786.56 |
| STN | Saturn Metals | 2% | -5% | -21% | -42% | 0.3 | $38,969,753.10 |
| MAT | Matsa Resources | 1% | 3% | -14% | -31% | 0.0455 | $16,332,435.21 |
| ERM | Emmerson Resources | 1% | 10% | -20% | 45% | 0.1 | $54,470,978.80 |
| RMS | Ramelius Resources | 1% | 18% | -20% | -38% | 1.105 | $906,417,438.91 |
| DDD | 3D Resources Limited | 0% | 0% | -33% | -50% | 0.002 | $8,863,744.18 |
| AVM | Advance Metals | 0% | 25% | -41% | -37% | 0.01 | $4,778,774.02 |
| AL8 | Alderan Resource | 0% | -18% | -64% | -82% | 0.009 | $4,784,094.72 |
| AQI | Alicanto Min | 0% | -21% | -45% | -57% | 0.058 | $22,255,389.79 |
| AQX | Alice Queen | 0% | -14% | -63% | -78% | 0.003 | $6,798,058.70 |
| AUC | Ausgold Limited | 0% | 7% | 2% | 27% | 0.047 | $95,385,303.43 |
| BMR | Ballymore Resources | 0% | 11% | 18% | 0% | 0.2 | $14,695,616.20 |
| BGD | Bartongoldholdings | 0% | -5% | -24% | 0% | 0.19 | $15,472,660.14 |
| BEZ | Besragoldinc | 0% | -17% | -59% | 0% | 0.039 | $5,671,048.68 |
| CBY | Canterbury Resources | 0% | 2% | -41% | -58% | 0.044 | $5,420,735.32 |
| CWX | Carawine Resources | 0% | 36% | -31% | -50% | 0.11 | $15,161,778.17 |
| CHZ | Chesser Resources | 0% | 0% | -2% | -32% | 0.095 | $55,871,695.45 |
| CGN | Crater Gold Min | 0% | 0% | 0% | 0% | 0.017 | $21,063,473.65 |
| DLCDA | Delecta Limited | 0% | 0% | 10% | 100% | 0.0275 | $13,253,995.76 |
| E2M | E2 Metals | 0% | 32% | -45% | -56% | 0.145 | $24,891,540.38 |
| EMU | EMU NL | 0% | 9% | -37% | -59% | 0.012 | $6,597,773.81 |
| FFX | Firefinch | 0% | 0% | -10% | 44% | 0.2 | $236,248,644.20 |
| GML | Gateway Mining | 0% | 0% | -31% | -51% | 0.009 | $20,340,957.30 |
| GTR | Gti Energy | 0% | 21% | -19% | 2% | 0.017 | $25,372,220.84 |
| HAV | Havilah Resources | 0% | 4% | 41% | 24% | 0.26 | $80,732,798.55 |
| KGM | Kalnorth Gold | 0% | 0% | 0% | 0% | 0.013 | $11,625,120.78 |
| MHC | Manhattan Corp | 0% | 11% | -29% | -23% | 0.01 | $15,262,786.93 |
| MXR | Maximus Resources | 0% | 11% | -29% | -36% | 0.05 | $17,166,911.47 |
| MI6 | Minerals260Limited | 0% | 13% | -55% | 0% | 0.265 | $57,200,000.00 |
| NAE | New Age Exploration | 0% | 17% | -56% | -36% | 0.007 | $10,051,292.37 |
| NPM | Newpeak Metals | 0% | 0% | 0% | -50% | 0.001 | $8,853,750.03 |
| OZM | Ozaurum Resources | 0% | -13% | 13% | -4% | 0.135 | $9,411,660.00 |
| PNM | Pacific Nickel Mines | 0% | 11% | -16% | 51% | 0.08 | $21,702,068.48 |
| PF1 | Pathfinder Resources | 0% | 0% | 25% | 72% | 0.5 | $26,560,505.00 |
| POL | Polymetals Resources | 0% | 67% | 11% | 7% | 0.15 | $6,008,484.90 |
| SFM | Santa Fe Minerals | 0% | -11% | -58% | 1% | 0.085 | $6,189,597.07 |
| SI6 | SI6 Metals Limited | 0% | 7% | -32% | -38% | 0.0075 | $10,417,323.55 |
| SAU | Southern Gold | 0% | 3% | -44% | -50% | 0.033 | $7,039,848.95 |
| TAR | Taruga Minerals | 0% | 25% | -38% | -55% | 0.025 | $14,451,206.00 |
| TMX | Terrain Minerals | 0% | -13% | 0% | -13% | 0.007 | $5,325,327.06 |
| TBR | Tribune Res | 0% | -8% | -20% | -32% | 3.7 | $204,100,819.53 |
| TRY | Troy Resources | 0% | 0% | 0% | -10% | 0.0295 | $50,138,963.94 |
| TRM | Truscott Mining Corp | 0% | 2% | 53% | 32% | 0.049 | $7,735,656.66 |
| VKA | Viking Mines | 0% | 17% | -50% | -67% | 0.007 | $7,176,809.02 |
| WMC | Wiluna Mining Corp | 0% | -13% | -77% | -76% | 0.205 | $74,238,030.68 |
| SSR | SSR Mining Inc. | -1% | -8% | -2% | 4% | 22.51 | $393,930,587.50 |
| PDI | Predictive Disc | -1% | 17% | -11% | 31% | 0.2225 | $382,830,450.30 |
| BBX | BBX Minerals | -1% | -22% | -56% | -65% | 0.074 | $35,965,589.15 |
| RND | Rand Mining | -1% | 10% | -5% | -4% | 1.45 | $82,470,143.45 |
| AAJ | Aruma Resources | -1% | 0% | -25% | 27% | 0.066 | $10,359,459.20 |
| LEX | Lefroy Exploration | -2% | 31% | -9% | -44% | 0.295 | $45,221,147.08 |
| MEK | Meeka Metals Limited | -2% | 2% | 21% | 4% | 0.051 | $47,860,033.78 |
| DTR | Dateline Resources | -2% | 3% | 20% | 18% | 0.098 | $49,573,032.00 |
| LYN | Lycaonresources | -2% | -18% | -38% | 0% | 0.245 | $7,660,500.00 |
| KZR | Kalamazoo Resources | -2% | 31% | -30% | -37% | 0.23 | $34,846,649.76 |
| SMI | Santana Minerals | -2% | 31% | 121% | 740% | 0.84 | $121,071,694.80 |
| HAW | Hawthorn Resources | -2% | 1% | -7% | 84% | 0.083 | $30,016,405.17 |
| AAR | Astral Resources | -3% | 10% | -26% | -10% | 0.078 | $46,501,980.64 |
| CEL | Challenger Exp | -3% | -5% | -33% | -30% | 0.185 | $195,265,580.20 |
| QML | Qmines Limited | -3% | 3% | -31% | -52% | 0.17 | $10,643,468.64 |
| CST | Castile Resources | -3% | -6% | -14% | -17% | 0.15 | $30,955,068.76 |
| BCN | Beacon Minerals | -3% | 4% | -9% | -9% | 0.029 | $105,602,645.20 |
| OGC | OceanaGold Corp. | -3% | -7% | 19% | 0% | 2.59 | $169,446,924.07 |
| TUL | Tulla Resources | -4% | -2% | -6% | 5% | 0.54 | $85,716,026.52 |
| KTA | Krakatoa Resources | -4% | -13% | 0% | 4% | 0.049 | $17,235,495.85 |
| BC8 | Black Cat Syndicate | -4% | 24% | -42% | -44% | 0.36 | $74,771,961.25 |
| EM2 | Eagle Mountain | -4% | 4% | -62% | -68% | 0.24 | $63,042,289.81 |
| FG1 | Flynngold | -4% | -4% | -44% | -45% | 0.096 | $6,342,043.95 |
| MAU | Magnetic Resources | -4% | -20% | -34% | -34% | 0.96 | $216,298,026.24 |
| TAM | Tanami Gold NL | -4% | 2% | -17% | -34% | 0.048 | $55,229,561.16 |
| GED | Golden Deeps | -4% | -12% | -4% | 5% | 0.0115 | $13,862,720.57 |
| GWR | GWR Group | -4% | -23% | -47% | -72% | 0.092 | $29,551,932.26 |
| ICL | Iceni Gold | -4% | -2% | -28% | -49% | 0.09 | $11,537,678.52 |
| AGG | AngloGold Ashanti | -4% | -9% | -23% | -26% | 4.01 | $363,075,603.55 |
| BNR | Bulletin Res | -4% | -4% | -4% | 93% | 0.11 | $30,722,065.50 |
| BTR | Brightstar Resources | -5% | 27% | -42% | -32% | 0.021 | $13,584,078.25 |
| GUL | Gullewa Limited | -5% | 3% | -13% | -22% | 0.061 | $12,217,798.40 |
| ARN | Aldoro Resources | -5% | 48% | -46% | -62% | 0.2 | $19,917,463.40 |
| WRM | White Rock Min | -5% | -9% | -53% | -77% | 0.1 | $19,103,605.84 |
| CAZ | Cazaly Resources | -5% | 0% | -14% | -27% | 0.038 | $14,832,871.72 |
| SMS | Starmineralslimited | -5% | 8% | -53% | 0% | 0.095 | $2,750,940.00 |
| THR | Thor Mining PLC | -5% | 6% | -37% | -37% | 0.0095 | $10,689,009.73 |
| GAL | Galileo Mining | -5% | -22% | 447% | 193% | 1.04 | $211,226,838.20 |
| CYL | Catalyst Metals | -5% | -1% | -39% | -39% | 1.21 | $119,131,939.08 |
| GSN | Great Southern | -5% | -15% | -36% | -38% | 0.035 | $20,035,052.89 |
| SRN | Surefire Rescs NL | -6% | -35% | 42% | 6% | 0.017 | $25,301,815.63 |
| ALY | Alchemy Resource | -6% | 14% | 33% | 26% | 0.016 | $14,296,110.86 |
| MDI | Middle Island Res | -6% | -22% | -22% | -15% | 0.094 | $11,507,312.87 |
| CPM | Coopermetalslimited | -6% | 6% | -1% | 0% | 0.455 | $12,857,162.50 |
| IPT | Impact Minerals | -6% | -6% | -45% | -40% | 0.0075 | $18,610,279.17 |
| MKR | Manuka Resources. | -6% | -17% | -49% | -44% | 0.15 | $47,193,362.87 |
| TBA | Tombola Gold | -6% | -21% | 0% | -38% | 0.03 | $27,702,240.55 |
| CDR | Codrus Minerals | -7% | 4% | -45% | -57% | 0.071 | $2,840,000.00 |
| GRL | Godolphin Resources | -7% | -15% | -38% | -49% | 0.084 | $7,489,145.39 |
| PRX | Prodigy Gold NL | -7% | 17% | -53% | -62% | 0.014 | $8,156,786.48 |
| RVR | Red River Resources | -7% | -7% | -28% | -22% | 0.14 | $72,585,028.32 |
| AZS | Azure Minerals | -7% | 0% | -49% | -18% | 0.205 | $62,147,144.20 |
| TMZ | Thomson Res | -7% | 24% | -60% | -75% | 0.026 | $16,921,605.89 |
| A8G | Australasian Metals | -8% | 17% | -55% | 66% | 0.24 | $10,292,623.50 |
| RMX | Red Mount Min | -8% | 9% | -40% | -40% | 0.006 | $9,854,183.15 |
| ZNC | Zenith Minerals | -8% | 15% | -17% | 36% | 0.3 | $99,981,060.91 |
| HCH | Hot Chili | -8% | -11% | -58% | -63% | 0.67 | $81,819,966.11 |
| MKG | Mako Gold | -8% | 0% | -23% | -25% | 0.067 | $26,756,912.14 |
| GNM | Great Northern | -8% | 38% | -8% | -50% | 0.0055 | $9,399,780.37 |
| LCL | Los Cerros Limited | -8% | 14% | -71% | -78% | 0.033 | $22,772,709.93 |
| OAU | Ora Gold Limited | -8% | 22% | -31% | -47% | 0.011 | $10,826,544.11 |
| AGC | AGC | -9% | 1% | -33% | -55% | 0.07 | $4,740,909.88 |
| M2R | Miramar | -9% | 18% | -49% | -38% | 0.1 | $6,739,599.62 |
| TSO | Tesoro Gold | -9% | -15% | -47% | -65% | 0.04 | $32,459,231.16 |
| NXM | Nexus Minerals | -9% | 12% | -28% | 179% | 0.24 | $66,625,372.13 |
| HRN | Horizon Gold | -10% | 9% | -11% | 0% | 0.38 | $48,863,490.41 |
| PGO | Pacgold | -10% | -3% | -37% | 153% | 0.57 | $31,328,234.55 |
| STK | Strickland Metals | -10% | 0% | -16% | 33% | 0.056 | $76,866,880.02 |
| ASR | Asra Minerals | -10% | -36% | -40% | -33% | 0.018 | $24,883,946.08 |
| LNY | Laneway Res | -10% | -10% | -6% | 4% | 0.0045 | $31,510,082.05 |
| PUA | Peak Minerals | -10% | 0% | -31% | -44% | 0.009 | $8,330,966.01 |
| CLZ | Classic Minerals | -10% | -51% | -51% | -1% | 3% | $6,500,000.00 |
| PUR | Pursuit Minerals | -11% | 13% | -29% | -73% | 0.017 | $15,892,787.10 |
| DTM | Dart Mining NL | -11% | 38% | -10% | -34% | 0.073 | $9,873,991.68 |
| ADV | Ardiden | -11% | 14% | -50% | 0% | 0.008 | $21,346,682.85 |
| FAU | First Au | -11% | -27% | -20% | -33% | 0.008 | $7,451,287.59 |
| KNB | Koonenberrygold | -11% | 0% | -45% | 0% | 0.08 | $5,980,727.04 |
| REZ | Resourc & En Grp | -11% | 0% | -54% | -20% | 0.024 | $11,995,338.94 |
| XTC | Xantippe Res | -11% | 14% | -20% | 300% | 0.008 | $64,107,788.51 |
| AAU | Antilles Gold | -11% | -11% | -30% | -32% | 0.054 | $18,377,057.97 |
| AM7 | Arcadia Minerals | -13% | -18% | -40% | -18% | 0.14 | $6,304,215.42 |
| AVW | Avira Resources | -14% | -14% | -33% | -40% | 0.003 | $6,356,370.00 |
| ADN | Andromeda Metals | -15% | 25% | -53% | -44% | 0.089 | $286,120,775.74 |
| WCN | White Cliff Min | -15% | -8% | -56% | -15% | 0.011 | $7,189,636.98 |
| HMX | Hammer Metals | -16% | 47% | 13% | -21% | 0.069 | $53,000,650.50 |
| ARL | Ardea Resources | -16% | 29% | 38% | 116% | 0.99 | $172,283,838.58 |
| NMR | Native Mineral Res | -17% | -20% | -43% | -49% | 0.125 | $5,736,697.20 |
| CLA | Celsius Resource | -19% | -32% | -55% | -55% | 0.013 | $15,879,054.98 |
| KAL | Kalgoorliegoldmining | -19% | 8% | -24% | 0% | 0.13 | $9,416,498.00 |
| SNG | Siren Gold | -20% | -15% | -21% | -13% | 0.225 | $18,576,783.06 |
| ASO | Aston Minerals | -20% | -11% | -56% | -45% | 0.08 | $92,423,067.52 |
| NSM | Northstaw | -22% | 0% | -48% | -61% | 0.14 | $5,617,780.00 |
| AWV | Anova Metals | -23% | 11% | -41% | -52% | 0.01 | $14,980,942.00 |
| MTH | Mithril Resources | -29% | 0% | -64% | -74% | 0.005 | $17,581,398.25 |
| ANL | Amani Gold | -33% | -33% | 0% | 0% | 0.001 | $47,386,882.25 |
| SIH | Sihayo Gold Limited | -33% | 0% | -75% | -80% | 0.002 | $12,204,256.18 |
WEEKLY ASX SMALL CAP STANDOUTS
Creasy-backed Peregrine Gold (ASX:PGD) flew out of the blocks Friday on news of ‘spectacular’ gold mineralisation found in shallow drill core at its Peninsula prospect, 30km west of the town of Newman in WA.
And speccy it was:
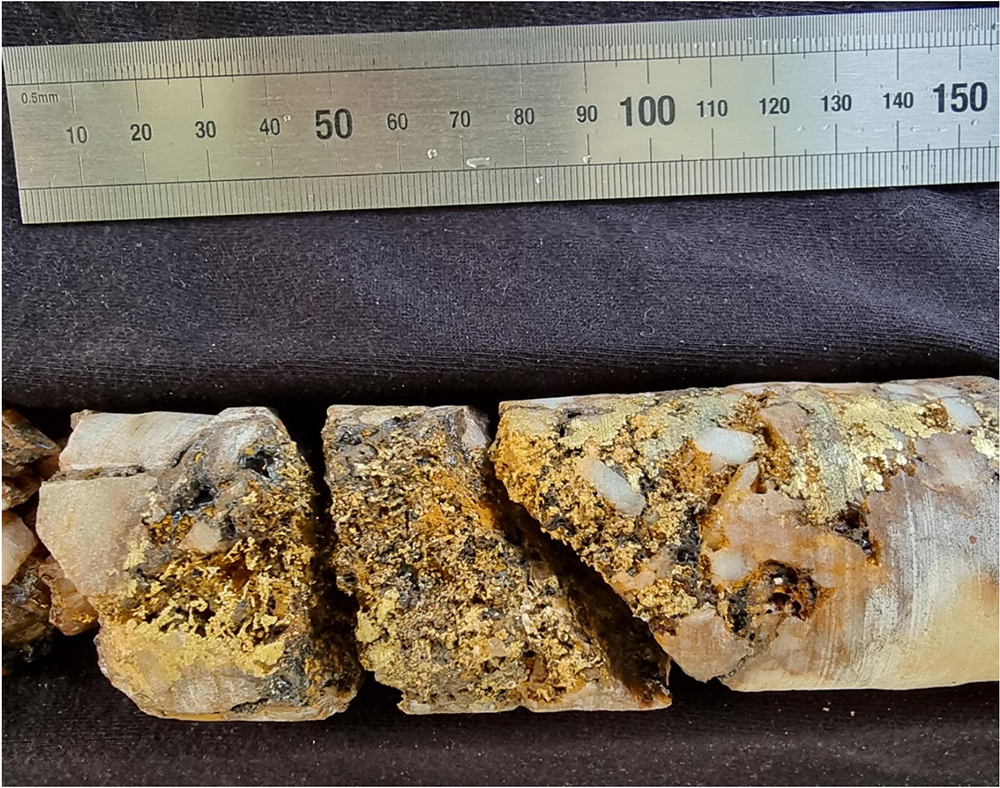
In fact, there’s gold all over the joint, they say, just sitting at surface:
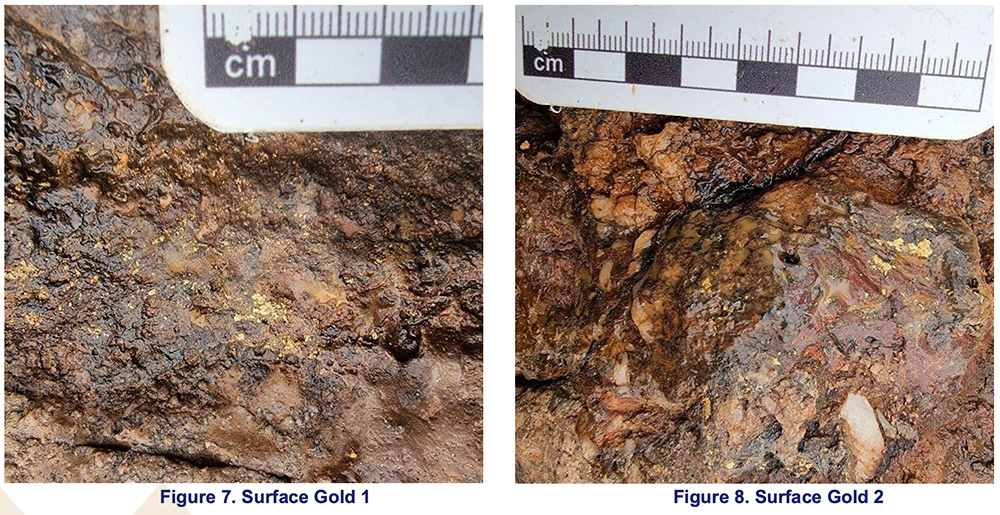
“’It is very rare for a greenfield exploration program in WA to encounter mineralisation of this nature sitting undisturbed at surface,” PGD technical director George Merhi says.
“In addition to being a very impressive demonstration of the high-grade potential of this system it also highlights just how underexplored the area is.
“Peninsula and the other Newman prospects due to be drilled have been uncovered as a result of systematic exploration over a small portion of our overall project area.
“In 2022 we have expanded this effort and look forward to updating the market on potentially new discoveries in this exciting district.”
Related Topics

Related Stories


UNLOCK INSIGHTS
Discover the untold stories of emerging ASX stocks.
Daily news and expert analysis, it's free to subscribe.
By proceeding, you confirm you understand that we handle personal information in accordance with our Privacy Policy.


