Gold Digger: There’s a sector of the market doing EVEN BETTER than gold producers

In a case of Revenge of the Nerds, humble gold developers have outperformed cash printing miners in 2025. Pic: Getty Images
- Gold developers are beginning to outperform gold producers, even as the giants of the industry print cash
- Lion Selection Group says ASX developer/assessors are sitting on +80% gains in 2025
- Evolution pumps up dividend after record year
This week has been notable for the start of the gold’s financial reporting season – the big one with the ASX’s gold mining class uploading their financial year results to a thirsty shareholder base baying for dividends on the back of a year of record gold prices and profits.
Back to that in a few pars, but for now, we’re taking a look at a quarterly report that may have slipped through to the keeper for some.
It’s the Lion Selection Group (ASX:LSX) investor update, which has a pretty interesting statistic enclosed.
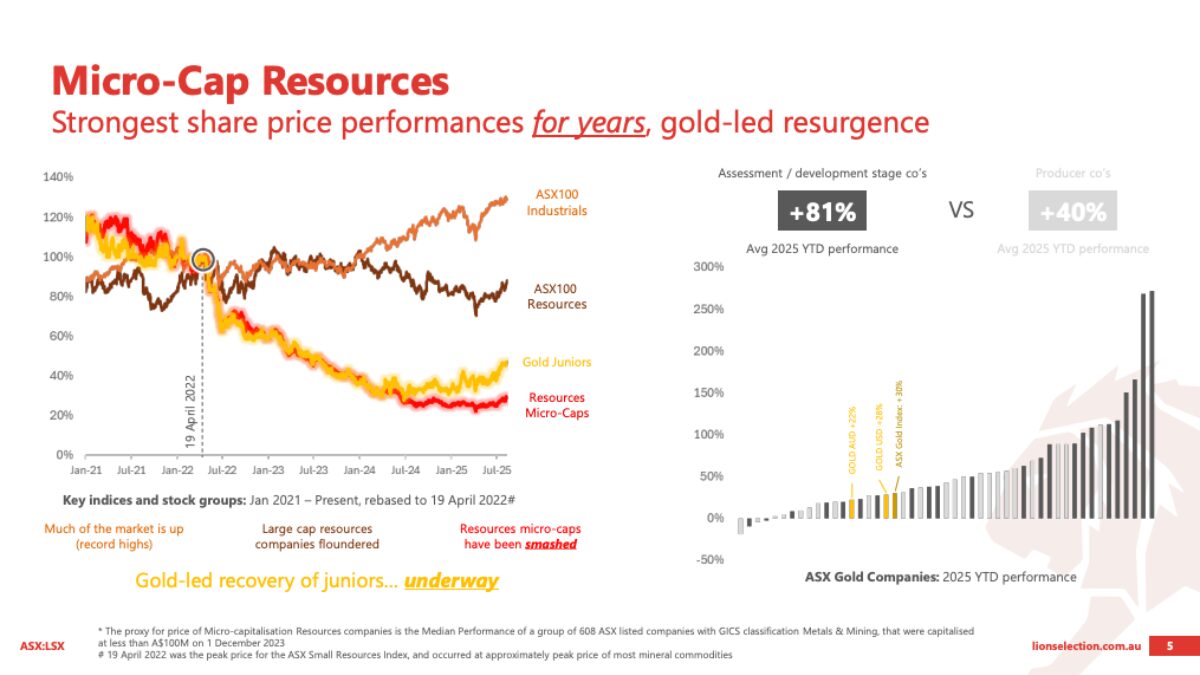
Gold juniors, and resources microcaps in general have been left in the mud by large caps since the end of the post-Covid boom in 2022.
But they’re just starting to lead a resurgence according to some sleuthing from Lion, which has backed that sector of the market heavily in recent years.
Gold producers have had a good run in 2025, outpacing the 28% lift in USD gold and 22% in AUD gold with a 40% YTD rise.
But assessment and development stage companies, those looking to bring deposits into production in the coming months and years, have doubled that growth in percentage terms, lifting a heady 81% so far this year.
To put that into context, the ASX All Ords gold sub-index is now looking at a 43% YTD return.
Revenge of the nerds
Lion CEO Hedley Widdup has largely been deploying the cash earned from the sale a few years ago of a stake in an Indonesian gold project into Australian gold names with development potential in recent years.
Since January 2022 it’s boasted 89% portfolio gains, with $40.9m in cash still in hand to deploy.
A few months ago the fundie moved the needle on his patented mining investment clock to 5 o’clock, a sign that the next boom and end of the most recent (and relatively short-lived) bust could be near.
According to the Lion clock, 6 o’clock is the point when the next upcycle begins, with midnight heralding the peak of the market and a coming bust.
Lion’s portfolio includes one junior producer in Brightstar Resources (ASX:BTR), with advanced developers in Medallion Metals (ASX:MM8), Saturn Metals (ASX:STN) and Antipa Minerals (ASX:AZY) all among its big winners so far this year.
At the earlier stage, its gold investments include Queensland gold and copper explorer Sunshine Metals (ASX:SHN), Great Boulder Resources (ASX:GBR), NSW market darling Koonenberry Gold (ASX:KNB) and the unlisted Plutonic.
Lion holds $17.9m in cash in legacy investments, largely companies with overseas projects outside the gold space, with investments made since January 2022 amounting to $73.5m.
Speaking to Stockhead last week, Widdup said the market was beginning to wake up to the need to head down the ladder and look at juniors developers to access the next phase of gains for the gold sector, with commodity prices in excess of $5000/oz for months now.
“I think that’s probably the market waking up, maybe, to the bargain – maybe saying I’ve got my money in the producers and I’m recycling some money out of them into the next risk level down and I’m doing it with a perspective around who’s most likely to get developed or bought,” he said in an interview.
M&A is one of the value drivers for these companies. Warriedar Resources (ASX:WA8) is being hunted by Capricorn Metals (ASX:CMM) in a $189 million scrip bid, the latest in a slew of deals announced across the WA gold space.
Warriedar’s Golden Range gold and antimony resource, including the large Ricciardo deposit, is 3km from 29Metals’ Golden Grove copper, gold, silver and zinc mine and located to the northwest of CMM’s Mt Gibson development.
“I think that’s probably helping the juniors across the space, you know, there’s speculation sneaking in about M&A, the gold price set up is great already, but then that sentiment is starting to filter through.”
Widdup says the most strategic developer M&A targets are those juniors with more than 1Moz in resources and proximity to a growth hungry mid-tier – either geographically or via a big brother on its register.
He views Antipa as a natural target for Greatland Resources (ASX:GGP), with its 2.5Moz Minyari Dome project located in the Paterson province near the massive Telfer gold mine.
Another is Medallion, which has Alkane Resources (ASX:ALK) on board as a significant shareholder.
It’s eyeing ASX 300 inclusion after a merger with TSX-listed Mandalay Resources which will marry its Tomingley mine in NSW with the Costerfield gold-antimony mine in Victoria and Bjorkdall gold mine in Sweden.
The firm also has the large Boda porphyry in its back pocket, but Medallion’s Ravensthorpe gold project shapes as a much speedier, if smaller scale development with the company signing binding terms on the acquisition of IGO’s Forrestania nickel plant ahead of a late 2025 FID.
The other one Widdup is looking at closely, outside of Lion’s portfolio this time, is Magnetic Resources (ASX:MAU) and its Laverton project, which is located next door to Genesis Minerals’ (ASX:GMD) Laverton mill.
“Genesis has just put its foot on everything that surrounds (MAU MD) George Sakalidis. So, you know, that was an easy one to speculate about as well,” Widdup said.
While MAU has been up a more pedestrian 21% YTD, MM8 and AZY have been leading lights among gold small caps, lifting 162% and 111% YTD respectively.
Evolutionary science
And now to the large caps, where Evolution Mining (ASX:EVN) has delivered the first major hit of financial reporting season, nearly tripling its final dividend to 13c.
The $260 million payout was a positive start for gold bulls, coming on top of a 7c interim dividend and 260% higher than the 5c divvie paid out at the end of FY24.
Evolution’s profit after tax shined bright, up 119% to $926.17m.
It’s a tasty entree for ASX gold investors, with reporting season to get much busier from the start of next week.
The gold and copper miner noted its average price for the year came in around $800 below current spot, with each $100m lift in the gold price equating to $70-80m in profit.
The ~$400 million paid out over the interim and final dividends clocked up to ~40% of all dividends ever paid by the company to 2024. Talk about a gold boom.
Those strong cash flows are expected to continue into 2026, with MD Lawrie Conway resisting the temptation other miners have given in to, keeping prices for resource and reserve shells where they are to preserve margins.
He previously issued a note of caution to the gold sector at this month’s Diggers and Dealers mining forum, warning that while gold prices were strong today they shouldn’t just be chased higher and that at some point they will reverse.
Winners and losers
Here’s how ASX-listed precious metals stocks are performing:
| CODE | COMPANY | PRICE | WEEK % | MONTH % | 6 MONTH %% | YEAR % | YTD % | MARKET CAP |
|---|---|---|---|---|---|---|---|---|
| MRR | Minrex Resources Ltd | 0.008 | -6% | 0% | 0% | -6% | 14% | $ 9,763,807.53 |
| NPM | Newpeak Metals | 0.02 | 0% | -23% | 33% | 43% | 82% | $ 6,582,866.48 |
| MTC | Metalstech Ltd | 0.175 | 25% | 25% | 59% | -10% | 25% | $ 38,859,618.00 |
| GED | Golden Deeps | 0.036 | 38% | 71% | 50% | 20% | 44% | $ 5,845,148.13 |
| G88 | Golden Mile Res Ltd | 0.009 | 0% | -10% | 0% | -10% | 0% | $ 4,353,982.84 |
| LAT | Latitude 66 Limited | 0.036 | 6% | -10% | -51% | -62% | -5% | $ 4,875,623.97 |
| NMR | Native Mineral Res | 0.135 | -4% | -16% | 101% | 611% | 246% | $ 132,119,373.92 |
| AQX | Alice Queen Ltd | 0.004 | 0% | 0% | -43% | -43% | -50% | $ 4,154,088.57 |
| SLZ | Sultan Resources Ltd | 0.006 | 0% | 20% | -25% | 0% | 0% | $ 1,566,501.38 |
| KSN | Kingston Resources | 0.13 | -2% | -7% | 57% | 78% | 83% | $ 113,405,451.71 |
| AMI | Aurelia Metals Ltd | 0.19 | -3% | -3% | -21% | 6% | 12% | $ 313,125,938.40 |
| GIB | Gibb River Diamonds | 0.046 | -2% | 31% | 24% | 18% | 15% | $ 10,081,943.92 |
| KCN | Kingsgate Consolid. | 2.91 | 7% | 12% | 119% | 117% | 126% | $ 729,437,288.36 |
| TMX | Terrain Minerals | 0.003 | 20% | 50% | -40% | 0% | 0% | $ 7,595,442.82 |
| BNR | Bulletin Res Ltd | 0.048 | -8% | -23% | 26% | 2% | 23% | $ 14,093,439.50 |
| NXM | Nexus Minerals Ltd | 0.06 | -2% | -12% | 2% | 62% | 33% | $ 35,621,817.17 |
| SKY | SKY Metals Ltd | 0.074 | 1% | 14% | 48% | 131% | 37% | $ 60,218,873.00 |
| LM8 | Lunnonmetalslimited | 0.26 | -2% | 18% | 18% | 73% | 4% | $ 56,260,184.37 |
| CST | Castile Resources | 0.07 | 15% | 23% | 0% | -1% | -13% | $ 21,402,400.60 |
| YRL | Yandal Resources | 0.145 | -12% | -26% | -28% | 4% | -17% | $ 49,477,597.12 |
| FAU | First Au Ltd | 0.0055 | 10% | 38% | 175% | 175% | 175% | $ 13,840,665.89 |
| ARL | Ardea Resources Ltd | 0.4 | -5% | -5% | -2% | -10% | 21% | $ 86,269,295.15 |
| GWR | GWR Group Ltd | 0.115 | 10% | 15% | 32% | 40% | 44% | $ 37,214,765.33 |
| IVR | Investigator Res Ltd | 0.027 | 8% | -4% | 8% | -33% | 35% | $ 46,783,248.60 |
| GTR | Gti Energy Ltd | 0.004 | 33% | 0% | 33% | 33% | 14% | $ 11,167,964.42 |
| IPT | Impact Minerals | 0.009 | 0% | 50% | -5% | -27% | -5% | $ 37,019,969.71 |
| BNZ | Benzmining | 1.08 | 30% | 83% | 143% | 700% | 213% | $ 195,267,871.35 |
| MOH | Moho Resources | 0.004 | -20% | -20% | 0% | -11% | -20% | $ 2,981,656.11 |
| MRZ | Mont Royal Resources | 0.041 | 0% | 0% | 0% | -23% | -5% | $ 3,486,221.51 |
| SMS | Starmineralslimited | 0.044 | 83% | 63% | 38% | 43% | 22% | $ 8,232,692.73 |
| MVL | Marvel Gold Limited | 0.018 | 29% | 38% | 64% | 125% | 100% | $ 22,290,651.25 |
| PRX | Prodigy Gold NL | 0.002 | -20% | -20% | 0% | 12% | 0% | $ 16,854,656.71 |
| AAU | Antilles Gold Ltd | 0.005 | 0% | 0% | 0% | 25% | 67% | $ 12,562,840.08 |
| CWX | Carawine Resources | 0.083 | 0% | -13% | -8% | -9% | -17% | $ 19,598,412.27 |
| RND | Rand Mining Ltd | 1.81 | 0% | -4% | -1% | 22% | 19% | $ 102,945,489.41 |
| CAZ | Cazaly Resources | 0.023 | 5% | 10% | 48% | 28% | 64% | $ 10,148,665.80 |
| BMR | Ballymore Resources | 0.155 | -3% | -9% | 7% | 35% | 29% | $ 31,958,356.17 |
| DRE | Dreadnought Resources Ltd | 0.012 | 0% | 20% | 9% | -25% | 0% | $ 66,033,500.00 |
| ZNC | Zenith Minerals Ltd | 0.05 | 35% | 52% | 19% | 22% | 25% | $ 23,825,497.37 |
| REZ | Resourc & En Grp Ltd | 0.017 | 13% | -19% | -37% | -26% | -26% | $ 13,454,506.58 |
| LEX | Lefroy Exploration | 0.13 | 0% | 18% | 53% | 73% | 86% | $ 28,568,315.87 |
| ERM | Emmerson Resources | 0.19 | 0% | 52% | 65% | 252% | 147% | $ 120,780,690.36 |
| ADT | Adriatic Metals | 6.17 | 3% | 4% | 47% | 131% | 58% | $ 1,837,440,190.53 |
| AS1 | Asara Resources Ltd | 0.061 | 2% | 13% | 85% | 510% | 221% | $ 83,964,810.85 |
| CYL | Catalyst Metals | 6.76 | 6% | 36% | 57% | 223% | 162% | $ 1,732,403,532.32 |
| CHN | Chalice Mining Ltd | 1.69 | 5% | -6% | 41% | 72% | 53% | $ 645,915,281.06 |
| KAL | Kalgoorliegoldmining | 0.038 | 0% | -17% | -55% | 58% | 111% | $ 14,507,868.84 |
| MLS | Metals Australia | 0.02 | 0% | 18% | -5% | 0% | -13% | $ 13,845,670.96 |
| SRN | Surefire Rescs NL | 0.0015 | -25% | -25% | -49% | -70% | -49% | $ 5,635,288.88 |
| WA8 | Warriedarresourltd | 0.155 | 3% | 41% | 210% | 172% | 252% | $ 178,189,257.75 |
| HMX | Hammer Metals Ltd | 0.0255 | -2% | -6% | -20% | -31% | -23% | $ 23,081,726.20 |
| WCN | White Cliff Min Ltd | 0.026 | 4% | 13% | 37% | 86% | 63% | $ 60,959,653.65 |
| AVM | Advance Metals Ltd | 0.038 | -12% | -5% | -31% | 90% | 12% | $ 11,902,040.32 |
| ASR | Asra Minerals Ltd | 0.002 | 0% | 0% | -33% | -64% | -33% | $ 6,000,297.01 |
| ARI | Arika Resources | 0.042 | 14% | 14% | 12% | 110% | 56% | $ 34,460,975.64 |
| CTO | Citigold Corp Ltd | 0.004 | 0% | 0% | 0% | -20% | 0% | $ 12,000,000.00 |
| SMI | Santana Minerals Ltd | 0.6 | -5% | 5% | 1% | 35% | 24% | $ 448,085,578.50 |
| M2R | Miramar | 0.004 | 0% | -20% | 0% | -33% | 33% | $ 3,987,293.14 |
| MHC | Manhattan Corp Ltd | 0.023 | -4% | 15% | 15% | 15% | 21% | $ 12,819,593.31 |
| GRL | Godolphin Resources | 0.015 | 25% | 50% | -12% | 15% | 3% | $ 6,284,226.37 |
| SVG | Savannah Goldfields | 0.019 | 19% | -10% | -17% | -28% | 3% | $ 19,406,809.66 |
| EMC | Everest Metals Corp | 0.11 | -8% | -24% | -33% | -12% | -19% | $ 25,775,094.33 |
| GUL | Gullewa Limited | 0.071 | 3% | 3% | 27% | 9% | 27% | $ 15,479,574.21 |
| CY5 | Cygnus Metals Ltd | 0.088 | -2% | 4% | -39% | 57% | -12% | $ 94,630,333.84 |
| G50 | G50Corp Ltd | 0.285 | -15% | 54% | 73% | 84% | 84% | $ 41,755,391.34 |
| ADV | Ardiden Ltd | 0.165 | 6% | 6% | 3% | 32% | 22% | $ 10,315,388.49 |
| AAR | Astral Resources NL | 0.17 | 3% | 13% | 26% | 136% | 26% | $ 235,541,611.80 |
| VMC | Venus Metals Cor Ltd | 0.098 | -2% | -20% | 11% | 46% | 46% | $ 19,612,868.30 |
| NAE | New Age Exploration | 0.003 | 0% | -14% | -40% | -33% | -14% | $ 8,117,734.22 |
| VKA | Viking Mines Ltd | 0.006 | -25% | -14% | -25% | -25% | -25% | $ 9,407,641.24 |
| LCL | LCL Resources Ltd | 0.006 | -14% | 0% | -25% | -14% | -40% | $ 7,195,542.91 |
| MTH | Mithril Silver Gold | 0.52 | 6% | 5% | 41% | 352% | 30% | $ 94,433,132.66 |
| ADG | Adelong Gold Limited | 0.005 | -17% | -9% | -17% | 25% | 11% | $ 11,243,383.37 |
| RMX | Red Mount Min Ltd | 0.009 | 0% | 0% | 13% | -10% | 0% | $ 4,643,996.33 |
| PRS | Prospech Limited | 0.022 | -4% | 0% | -15% | -37% | -24% | $ 8,334,169.51 |
| TTM | Titan Minerals | 0.41 | 21% | 22% | -12% | -12% | 8% | $ 106,889,339.46 |
| AKA | Aureka Limited | 0.094 | -2% | 3% | -48% | -99% | -30% | $ 11,974,776.70 |
| AAM | Aumegametals | 0.037 | -3% | 32% | -20% | -18% | -12% | $ 21,817,825.09 |
| KZR | Kalamazoo Resources | 0.135 | 23% | 50% | 67% | 121% | 82% | $ 30,760,045.55 |
| BCN | Beacon Minerals | 1.71 | 32% | 61% | 64% | 78% | 94% | $ 180,680,629.77 |
| MAU | Magnetic Resources | 1.37 | -11% | -3% | 2% | -12% | 24% | $ 368,970,633.63 |
| BC8 | Black Cat Syndicate | 0.885 | 1% | 8% | 17% | 164% | 57% | $ 626,233,855.26 |
| EM2 | Eagle Mountain | 0.006 | 0% | 0% | -25% | -85% | -33% | $ 6,810,223.73 |
| EMR | Emerald Res NL | 3.53 | -1% | -4% | -16% | -2% | 9% | $ 2,296,069,628.04 |
| BYH | Bryah Resources Ltd | 0.005 | 11% | -29% | 25% | 0% | 67% | $ 5,142,662.66 |
| HCH | Hot Chili Ltd | 0.675 | 11% | 3% | -11% | -15% | -3% | $ 99,529,481.54 |
| WAF | West African Res Ltd | 2.77 | 4% | 20% | 55% | 102% | 93% | $ 3,112,103,955.87 |
| MEU | Marmota Limited | 0.043 | 16% | 10% | -22% | 8% | 10% | $ 48,310,537.39 |
| NVA | Nova Minerals Ltd | 0.295 | -13% | -2% | -8% | 119% | -20% | $ 120,450,425.10 |
| SVL | Silver Mines Limited | 0.125 | 0% | -11% | 39% | -19% | 60% | $ 251,353,847.04 |
| PGD | Peregrine Gold | 0.285 | 2% | 50% | 128% | 54% | 104% | $ 25,454,322.30 |
| ICL | Iceni Gold | 0.074 | 20% | 9% | -19% | 68% | 4% | $ 23,001,192.93 |
| FG1 | Flynngold | 0.029 | 0% | -6% | -3% | 4% | 16% | $ 11,348,177.63 |
| WWI | West Wits Mining Ltd | 0.033 | 32% | 65% | 120% | 136% | 136% | $ 92,577,777.29 |
| RML | Resolution Minerals | 0.057 | -10% | 27% | 533% | 185% | 375% | $ 69,205,352.22 |
| AAJ | Aruma Resources Ltd | 0.009 | 20% | 13% | -10% | -40% | -25% | $ 2,951,464.73 |
| HWK | Hawk Resources. | 0.015 | -12% | -17% | -42% | -44% | -32% | $ 4,334,871.18 |
| GMN | Gold Mountain Ltd | 0.063 | 3% | -58% | -50% | -64% | -58% | $ 7,448,868.97 |
| MEG | Megado Minerals Ltd | 0.031 | -18% | -3% | 138% | 196% | 82% | $ 19,370,497.86 |
| HMG | Hamelingoldlimited | 0.051 | -6% | -24% | -19% | -47% | -20% | $ 10,906,696.41 |
| BM8 | Battery Age Minerals | 0.085 | 25% | 52% | 8% | -29% | -19% | $ 11,536,938.55 |
| TBR | Tribune Res Ltd | 4.8 | 3% | 0% | -3% | 25% | 12% | $ 246,599,961.90 |
| FML | Focus Minerals Ltd | 0.43 | 13% | 19% | 105% | 207% | 153% | $ 106,026,698.65 |
| VRC | Volt Resources Ltd | 0.005 | 25% | 25% | 67% | 67% | 67% | $ 18,739,397.64 |
| ARV | Artemis Resources | 0.005 | 25% | -17% | -50% | -44% | -38% | $ 11,462,688.66 |
| HRN | Horizon Gold Ltd | 0.485 | 0% | -1% | -8% | 71% | 2% | $ 73,700,963.43 |
| CLA | Celsius Resource Ltd | 0.007 | 0% | 17% | -36% | -46% | -36% | $ 18,812,930.71 |
| QML | Qmines Limited | 0.055 | 2% | 20% | 6% | 2% | 2% | $ 26,441,029.72 |
| RDN | Raiden Resources Ltd | 0.004 | 0% | 0% | -50% | -83% | -64% | $ 13,803,565.77 |
| TCG | Turaco Gold Limited | 0.495 | 3% | 1% | 36% | 96% | 94% | $ 525,284,633.50 |
| KCC | Kincora Copper | 0.065 | 14% | 12% | 110% | 35% | 141% | $ 15,461,327.90 |
| GBZ | GBM Rsources Ltd | 0.031 | -6% | 55% | 288% | 343% | 288% | $ 127,349,172.32 |
| DTM | Dart Mining NL | 0.0025 | -17% | -17% | -58% | -82% | -72% | $ 2,995,138.95 |
| MKR | Manuka Resources. | 0.046 | 2% | -6% | 68% | 62% | 68% | $ 49,007,703.24 |
| AUC | Ausgold Limited | 0.615 | 1% | 3% | 34% | 73% | 46% | $ 256,353,611.69 |
| ANX | Anax Metals Ltd | 0.006 | -14% | -25% | -45% | -68% | -50% | $ 5,296,845.40 |
| EMU | EMU NL | 0.023 | 5% | -15% | -23% | 21% | -15% | $ 4,858,714.76 |
| SFM | Santa Fe Minerals | 0.245 | 2% | 2% | 562% | 581% | 690% | $ 17,840,603.31 |
| PNR | Pantoro Gold Limited | 4.31 | 6% | 46% | 69% | 141% | 182% | $ 1,689,361,596.78 |
| CMM | Capricorn Metals | 9.88 | 1% | 6% | 24% | 66% | 57% | $ 4,183,827,726.20 |
| VRL | Verity Resources | 0.024 | 0% | -4% | 54% | -38% | 23% | $ 6,711,131.23 |
| HAW | Hawthorn Resources | 0.053 | 2% | -4% | 15% | -13% | 29% | $ 17,420,811.88 |
| BGD | Bartongoldholdings | 0.795 | -2% | 6% | 152% | 231% | 224% | $ 176,342,429.05 |
| SVY | Stavely Minerals Ltd | 0.0125 | -17% | -31% | -40% | -48% | -26% | $ 8,836,832.97 |
| AGC | AGC Ltd | 0.18 | 3% | 16% | 29% | -35% | 16% | $ 47,177,499.96 |
| RGL | Riversgold | 0.004 | 14% | -20% | -20% | 0% | 0% | $ 6,734,850.37 |
| TSO | Tesoro Gold Ltd | 0.035 | 13% | 13% | 30% | 25% | 75% | $ 70,513,947.25 |
| GUE | Global Uranium | 0.064 | 3% | 3% | -23% | 19% | 7% | $ 29,104,299.07 |
| CPM | Coopermetalslimited | 0.057 | 8% | 50% | 24% | -16% | 24% | $ 4,466,272.05 |
| MM8 | Medallion Metals. | 0.315 | 13% | 21% | 91% | 443% | 163% | $ 171,292,801.40 |
| FFM | Firefly Metals Ltd | 1.185 | 11% | 10% | 15% | 59% | 28% | $ 787,450,346.83 |
| CBY | Canterbury Resources | 0.021 | -13% | -16% | -25% | -43% | -5% | $ 4,356,258.82 |
| SLA | Solara Minerals | 0.23 | -2% | 35% | 67% | -12% | 156% | $ 15,104,879.87 |
| SFR | Sandfire Resources | 12.18 | 7% | 10% | 12% | 48% | 31% | $ 5,366,550,043.40 |
| TAM | Tanami Gold NL | 0.057 | -2% | -10% | 90% | 97% | 90% | $ 68,155,628.67 |
| NWM | Norwest Minerals | 0.014 | 8% | 0% | 36% | -26% | 17% | $ 14,421,497.31 |
| ALK | Alkane Resources Ltd | 0.88 | 6% | 29% | 38% | 102% | 73% | $ 1,139,672,848.61 |
| BMO | Bastion Minerals | 0.0015 | 0% | 0% | -52% | -73% | -52% | $ 3,307,429.64 |
| IDA | Indiana Resources | 0.044 | 22% | 22% | 38% | 112% | 72% | $ 27,680,495.69 |
| GSM | Golden State Mining | 0.008 | 0% | 0% | -11% | -33% | 0% | $ 2,234,965.04 |
| NSM | Northstaw | 0.032 | 3% | -6% | 62% | 164% | 102% | $ 10,910,312.64 |
| GSN | Great Southern | 0.027 | 8% | -4% | 23% | 64% | 80% | $ 27,910,520.12 |
| VAU | Vault Minerals Ltd | 0.43 | 2% | 8% | 4% | 21% | 30% | $ 2,891,051,187.35 |
| CDR | Codrus Minerals Ltd | 0.027 | 35% | 0% | 35% | -7% | 59% | $ 5,581,828.23 |
| MDI | Middle Island Res | 0.021 | 11% | 11% | 24% | 62% | 75% | $ 5,571,445.45 |
| WTM | Waratah Minerals Ltd | 0.72 | 11% | 132% | 251% | 78% | 365% | $ 188,927,950.50 |
| POL | Polymetals Resources | 0.77 | -3% | 1% | -4% | 208% | -3% | $ 205,546,997.10 |
| RDS | Redstone Resources | 0.0045 | 13% | 13% | 50% | 13% | 80% | $ 4,137,069.42 |
| NAG | Nagambie Resources | 0.014 | -18% | -13% | -7% | 40% | -22% | $ 11,642,930.48 |
| BGL | Bellevue Gold Ltd | 0.875 | -2% | -3% | -31% | -36% | -22% | $ 1,316,007,582.45 |
| GBR | Greatbould Resources | 0.06 | 3% | -9% | -6% | 22% | 40% | $ 53,315,686.50 |
| KAI | Kairos Minerals Ltd | 0.025 | -4% | -17% | 32% | 150% | 108% | $ 69,816,383.57 |
| KAU | Kaiser Reef | 0.175 | 6% | -5% | 9% | 13% | 9% | $ 100,902,845.50 |
| HRZ | Horizon | 0.049 | -2% | -4% | -32% | 23% | 23% | $ 138,665,581.63 |
| CDT | Castle Minerals | 0.06 | 0% | -3% | -33% | -43% | 0% | $ 6,960,574.20 |
| RSG | Resolute Mining | 0.72 | 10% | 7% | 106% | 13% | 82% | $ 1,490,787,209.10 |
| EVN | Evolution Mining Ltd | 8.01 | 7% | 6% | 26% | 97% | 67% | $ 15,987,862,581.52 |
| CXU | Cauldron Energy Ltd | 0.008 | -6% | -20% | -29% | -56% | -32% | $ 14,329,288.06 |
| DLI | Delta Lithium | 0.165 | 0% | -6% | -8% | -21% | -3% | $ 118,343,245.68 |
| ALY | Alchemy Resource Ltd | 0.0055 | 0% | 10% | -31% | -8% | -21% | $ 5,890,381.28 |
| NH3 | Nh3Cleanenergyltd | 0.063 | 3% | 15% | 250% | 294% | 250% | $ 40,055,122.44 |
| OBM | Ora Banda Mining Ltd | 0.705 | 3% | 0% | -30% | 57% | 8% | $ 1,280,996,523.56 |
| AVW | Avira Resources Ltd | 0.007 | 0% | 0% | -22% | -65% | -65% | $ 1,610,000.00 |
| LCY | Legacy Iron Ore | 0.0085 | -6% | 6% | -15% | -41% | -15% | $ 82,977,361.96 |
| PDI | Predictive Disc Ltd | 0.455 | 1% | 7% | 32% | 133% | 98% | $ 1,193,222,910.88 |
| MAT | Matsa Resources | 0.073 | -1% | 14% | 38% | 192% | 109% | $ 55,480,692.73 |
| ZAG | Zuleika Gold Ltd | 0.022 | -4% | 38% | 83% | 83% | 69% | $ 16,431,358.39 |
| GML | Gateway Mining | 0.027 | 0% | 2% | 13% | 29% | 29% | $ 10,629,327.67 |
| SBM | St Barbara Limited | 0.355 | 15% | 22% | 45% | 65% | 58% | $ 378,996,219.35 |
| SBR | Sabre Resources | 0.011 | 10% | 22% | 22% | -15% | 10% | $ 3,944,619.33 |
| STK | Strickland Metals | 0.15 | 7% | 0% | 114% | 43% | 76% | $ 328,042,170.57 |
| CEL | Challenger Gold Ltd | 0.11 | 15% | 28% | 104% | 150% | 134% | $ 206,675,918.90 |
| GG8 | Gorilla Gold Mines | 0.4 | -11% | 14% | 63% | 279% | 54% | $ 264,952,695.26 |
| NST | Northern Star | 18.32 | 5% | 11% | -1% | 29% | 19% | $ 25,713,874,782.00 |
| OZM | Ozaurum Resources | 0.067 | -7% | -26% | -46% | 52% | 123% | $ 15,808,029.24 |
| TG1 | Techgen Metals Ltd | 0.02 | 5% | -19% | -42% | -30% | -40% | $ 3,173,314.20 |
| XAM | Xanadu Mines Ltd | 0.08 | 1% | 1% | 60% | 45% | 63% | $ 183,296,895.12 |
| AQI | Alicanto Min Ltd | 0.026 | -7% | 0% | -33% | 73% | -30% | $ 23,748,003.33 |
| KTA | Krakatoa Resources | 0.015 | 25% | 36% | 67% | 36% | 58% | $ 11,627,010.38 |
| ARN | Aldoro Resources | 0.325 | -7% | -7% | 3% | 333% | -14% | $ 70,761,375.75 |
| WGX | Westgold Resources. | 3.09 | 7% | 9% | 22% | 6% | 9% | $ 2,840,444,027.12 |
| MBK | Metal Bank Ltd | 0.01 | -17% | -9% | -38% | -40% | -33% | $ 5,969,507.98 |
| A8G | Australasian Metals | 0.088 | 24% | 31% | 28% | 1% | 11% | $ 4,225,949.93 |
| TAR | Taruga Minerals | 0.01 | 11% | 43% | 0% | 67% | 0% | $ 7,137,540.58 |
| DTR | Dateline Resources | 0.19 | 58% | 92% | 6233% | 3700% | 5329% | $ 639,838,858.00 |
| GOR | Gold Road Res Ltd | 3.31 | 0% | 4% | 27% | 86% | 61% | $ 3,595,980,888.60 |
| S2R | S2 Resources | 0.084 | 20% | 22% | 20% | -24% | 25% | $ 42,123,399.28 |
| NES | Nelson Resources. | 0.003 | 0% | 0% | 0% | 0% | 0% | $ 6,515,782.98 |
| TLM | Talisman Mining | 0.145 | -6% | 0% | -26% | -34% | -29% | $ 29,189,654.10 |
| BEZ | Besragoldinc | 0.04 | -13% | -17% | -32% | -60% | -56% | $ 16,619,928.20 |
| PRU | Perseus Mining Ltd | 3.6 | 1% | 0% | 27% | 45% | 40% | $ 4,820,209,060.04 |
| SPQ | Superior Resources | 0.005 | 0% | 0% | -29% | -38% | -17% | $ 14,225,896.35 |
| PUR | Pursuit Minerals | 0.063 | -3% | -16% | -14% | -58% | -34% | $ 6,558,540.95 |
| RMS | Ramelius Resources | 2.81 | 0% | 15% | 6% | 38% | 36% | $ 5,315,905,975.32 |
| PKO | Peako Limited | 0.003 | 20% | 20% | 0% | -25% | 0% | $ 4,463,225.88 |
| RKB | Rokeby Resources Ltd | 0.011 | -21% | 10% | 57% | 175% | 120% | $ 19,618,333.68 |
| A1G | African Gold Ltd. | 0.275 | 22% | 17% | 244% | 1046% | 400% | $ 147,525,832.16 |
| NMG | New Murchison Gold | 0.019 | 6% | 12% | 58% | 280% | 111% | $ 188,599,272.28 |
| GNM | Great Northern | 0.016 | 0% | 14% | 7% | 45% | 14% | $ 2,474,065.23 |
| KRM | Kingsrose Mining Ltd | 0.042 | 0% | 20% | 14% | 8% | 20% | $ 30,894,587.28 |
| BTR | Brightstar Resources | 0.395 | -8% | -19% | -28% | -1% | -21% | $ 228,804,504.85 |
| RRL | Regis Resources | 4.51 | 4% | 0% | 40% | 175% | 77% | $ 3,340,651,487.68 |
| M24 | Mamba Exploration | 0.013 | 0% | -7% | -13% | 30% | 8% | $ 4,279,901.35 |
| TRM | Truscott Mining Corp | 0.05 | 0% | 2% | -33% | -17% | -36% | $ 9,784,428.00 |
| TNC | True North Copper | 0.355 | -3% | -12% | -11% | -91% | -88% | $ 46,494,717.62 |
| KNB | Koonenberrygold | 0.04 | -2% | -23% | 25% | 208% | 233% | $ 40,063,140.51 |
| AWJ | Auric Mining | 0.165 | -6% | -8% | -46% | -25% | -51% | $ 30,686,881.83 |
| ENR | Encounter Resources | 0.33 | 14% | 18% | 32% | -32% | 2% | $ 172,083,350.06 |
| SNG | Siren Gold | 0.059 | 7% | 18% | -5% | 5% | -9% | $ 12,262,354.10 |
| STN | Saturn Metals | 0.435 | 6% | 7% | 71% | 142% | 112% | $ 202,426,497.68 |
| USL | Unico Silver Limited | 0.39 | -3% | -8% | 77% | 129% | 100% | $ 172,987,783.23 |
| PNM | Pacific Nickel Mines | 0.024 | 0% | 0% | 0% | 0% | 0% | $ 10,103,834.52 |
| AYM | Australia United Min | 0.002 | -20% | -33% | -33% | -33% | -50% | $ 3,685,154.97 |
| HAV | Havilah Resources | 0.18 | -8% | -3% | -12% | 0% | -20% | $ 62,066,133.36 |
| SPR | Spartan Resources | 2.13 | 0% | 7% | 58% | 69% | 51% | $ 2,847,436,934.76 |
| PNT | Panthermetalsltd | 0.008 | -20% | -27% | 0% | -68% | -27% | $ 3,009,045.48 |
| MEK | Meeka Metals Limited | 0.145 | 7% | 4% | 21% | 169% | 88% | $ 408,198,723.80 |
| GMD | Genesis Minerals | 4.32 | 8% | 5% | 31% | 96% | 75% | $ 4,770,912,800.54 |
| PGO | Pacgold | 0.064 | 3% | 2% | 7% | -39% | -15% | $ 14,478,411.01 |
| FEG | Far East Gold | 0.185 | 6% | 9% | 9% | 23% | 3% | $ 66,064,941.54 |
| MI6 | Minerals260Limited | 0.13 | 13% | 13% | 0% | 0% | 0% | $ 258,416,666.63 |
| IGO | IGO Limited | 5.45 | 15% | 14% | 14% | 8% | 14% | $ 4,066,528,155.81 |
| GAL | Galileo Mining Ltd | 0.145 | -3% | -3% | 12% | -9% | 16% | $ 28,655,614.42 |
| RXL | Rox Resources | 0.31 | 0% | 0% | 38% | 121% | 55% | $ 227,794,202.59 |
| PTN | Patronus Resources | 0.061 | -2% | -9% | -6% | 9% | 24% | $ 101,518,663.85 |
| CLZ | Classic Min Ltd | 0.001 | 0% | 0% | 0% | 0% | 0% | $ 3,017,699.21 |
| TGM | Theta Gold Mines Ltd | 0.17 | 3% | -6% | 6% | 21% | -6% | $ 163,786,723.63 |
| FAL | Falconmetalsltd | 0.8 | 23% | 80% | 493% | 181% | 596% | $ 111,861,103.41 |
| SPD | Southernpalladium | 0.655 | -5% | 9% | 66% | 63% | 9% | $ 66,843,750.00 |
| ORN | Orion Minerals Ltd | 0.011 | 0% | 10% | -21% | -27% | -27% | $ 80,097,996.76 |
| TMB | Tambourahmetals | 0.041 | 11% | 86% | 46% | -7% | 95% | $ 7,115,469.89 |
| TMS | Tennant Minerals Ltd | 0.006 | -8% | 0% | -56% | -70% | -33% | $ 7,461,232.91 |
| AZY | Antipa Minerals Ltd | 0.57 | 6% | 4% | 58% | 396% | 119% | $ 359,342,926.82 |
| PXX | Polarx Limited | 0.018 | 0% | 80% | 100% | 125% | 177% | $ 40,383,516.63 |
| TRE | Toubani Res Ltd | 0.33 | -14% | 14% | 144% | 89% | 94% | $ 115,830,536.58 |
| AUN | Aurumin | 0.093 | -5% | 0% | 41% | 166% | 41% | $ 47,530,364.57 |
| GPR | Geopacific Resources | 0.03 | 3% | 0% | 30% | 34% | 50% | $ 95,473,959.78 |
| FXG | Felix Gold Limited | 0.18 | 3% | 20% | 0% | 463% | 114% | $ 74,610,077.87 |
| ILT | Iltani Resources Lim | 0.205 | 11% | 3% | -13% | 14% | 0% | $ 14,506,976.44 |
| BRX | Belararoxlimited | 0.092 | 15% | 51% | -46% | -66% | -47% | $ 17,009,892.59 |
| TM1 | Terra Metals Limited | 0.076 | 15% | 62% | 162% | 69% | 171% | $ 36,798,066.38 |
| TOR | Torque Met | 0.305 | 5% | 97% | 205% | 177% | 475% | $ 150,074,486.90 |
| ARD | Argent Minerals | 0.022 | 0% | -12% | -15% | 57% | 29% | $ 31,815,090.56 |
| LM1 | Leeuwin Metals Ltd | 0.145 | -15% | 12% | 12% | 84% | 4% | $ 15,624,989.52 |
| SX2 | Southgold Consol | 5.91 | 7% | -2% | 58% | 0% | 0% | $ 844,986,696.00 |
| UVA | Uvrelimited | 0.12 | -8% | -4% | 46% | 33% | 35% | $ 21,810,727.62 |
| VTX | Vertexmin | 0.235 | 9% | 1% | -25% | 187% | 13% | $ 51,016,619.48 |
| JAV | Javelin Minerals Ltd | 0.003 | 50% | 50% | 0% | 100% | 0% | $ 18,756,674.66 |
| OMX | Orangeminerals | 0.077 | 4% | 7% | 141% | 196% | 166% | $ 12,104,753.16 |
Gold medal performers
Who were some of the top precious metals names this week?
It was a quiet week for the Mid West WA gold explorer, which is planning to start mining at the small Tumblegum South gold project in the first quarter of 2026.
That could be a tidy little money spinner, with pre-production costs of just $700,000 to $1.5 million predicted on a mine that would generate $9.4-19.6m in cash flow on just 11,800-15,900oz of gold production.
And that’s at prices ranging from $3000-3800/oz, well below current levels. Mining approvals are in train, with the new streamlined process for small mining operations under the Mining Amendment Act 2022 to come into effect with the laws on September 9 this year.
There was a touch of intrigue this week, with Star’s creeping share price prompting a trading halt on Thursday.
It’s due to end on Monday when Star exits the halt to respond to not only the speeding ticket, but also with some much anticipated RC drilling results.
Only time will tell what’s in store.
Yet more enthusiasm for Donald Trump’s (apparent) favourite ASX name this week, having ridden the wave of support from the US Department of Defense and Apple for the nearby Mountain Pass rare earths mine higher this year.
Its 1.1Moz Colosseum gold mine in California sits around 10km from MP Materials.
It doesn’t have any rare earths resources yet, in spite of what commentary from the States and the frightfully named Truth Social might have you believe.
But DTR did confirm some high priority rare earths drilling targets in a 3D magnetotelluric survey, identifying a large resistive anomaly with signatures characteristic of carbonatite hosted REE systems.
Dateline, too, copped a speeding ticket this week, telling the ASX there was no new info to report outside the Monday announcement on the MT survey.
We’re now talking a $640m market cap and +5300% gain for DTR this year so far. Good if you can get it.
At Stockhead, we tell it like it is. While Star Minerals, Medallion Metals, Antipa Minerals and Magnetic Resources are Stockhead advertisers, they did not sponsor this article.
Related Stories


UNLOCK INSIGHTS
Discover the untold stories of emerging ASX stocks.
Daily news and expert analysis, it's free to subscribe.
By proceeding, you confirm you understand that we handle personal information in accordance with our Privacy Policy.


