Gold Digger: Physical silver demand is super strong. Why are prices so weak?

Pic: Stockhead/ Westend61, Via Getty Images
- Physical silver demand is reaching record highs
- Another deficit in 2022 means vaults stocks are running low
- Despite this, the silver price has struggled in recent months thanks to cautious outlook from instos
Our Gold Digger column wraps all the news driving ASX stocks with exposure to precious metals.
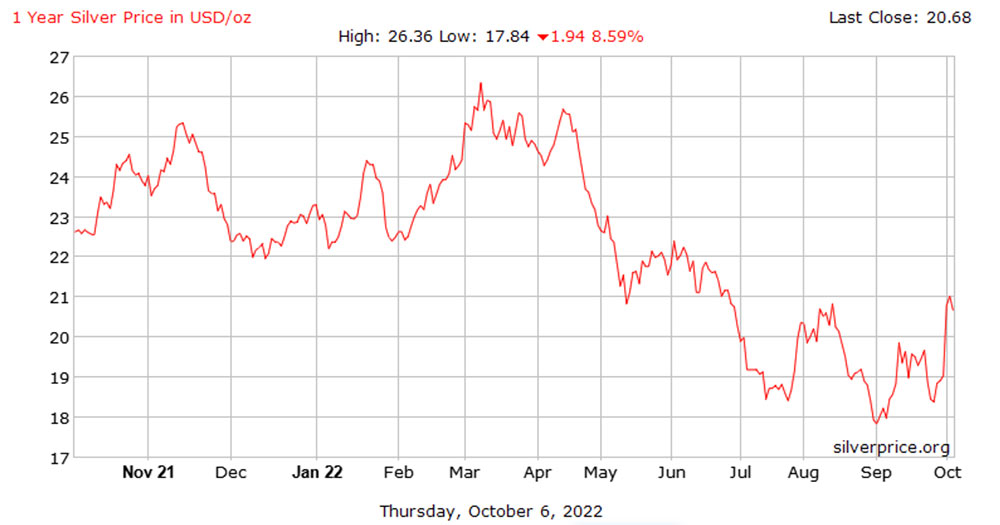
Silver has bounced back 10% over the past few days, handing it the strongest gains of the major precious metals.
Still, the price action remains disappointing for silver bulls, especially given the strength of physical demand at the moment.
Demand is reaching record highs
Metals Focus says India – a major end user — continues to import record volumes of silver bullion for jewellery and silverware.
“August deliveries alone reached 1,056t, bringing the ytd total to 6,239t,” it says.
“This already represents the third highest total on record and, even though the recent price gains may temper near-term imports, the forthcoming festive and wedding season and its associated jewellery and silverware buying mean it seems only a matter of time before India posts a new high, eclipsing 2015’s record of 7,530t.”
Retail investment in the US and Germany, the other two key silver physical investment markets has also remained high.
“Their gains continue a trend which stretches back to 2020, when the pandemic first emerged,” says Metals Focus.
Lastly, industrial demand looks set for another record high as decarbonisation (centred on PV installations and vehicle electrification) helps drive gains in excess of global GDP growth.
Another deficit in 2022 means vault stocks are running low
All this has contributed to another substantial forecasted physical supply deficit in 2022.
This is being reflected in a further decline in bullion stocks, Metals Focus says.
“For example, London vault stocks at 916Moz are at their lowest for the LBMA series, which stretches back to July 2016,” it says.
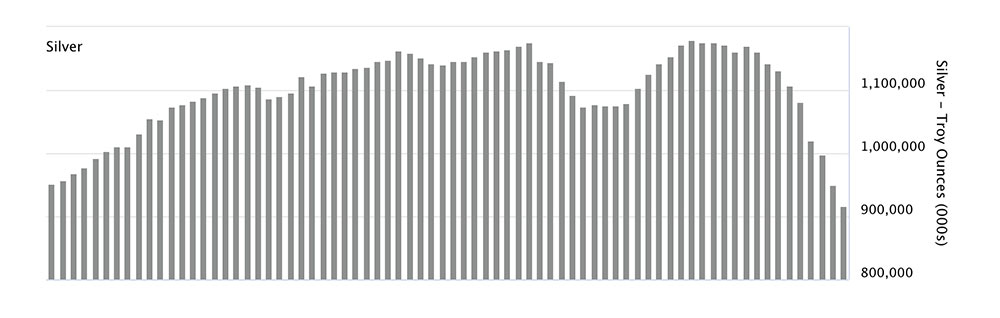
“Similarly, Comex stocks now stand at 313Moz, which is their lowest since June 2020.”
Despite this, the silver price has struggled in recent months. Why?
Negative sentiment from large investors, Metals Focus says.
“Despite the recent pullback in rate expectations and the impetus this has provided to precious metals, institutional investors still remain cautious about the outlook for the complex,” it says.
“In spite of the strength in underlying silver demand, this caution remains the biggest headwind for the silver price.”
While rate expectations have been trimmed, further tightening is still expected, both this year and going into 2023, pushing yields higher and lending further support to the dollar.
“As a result, we believe that silver prices will face renewed selling pressure towards year-end, which is likely to continue into 2023, in spite of an increasingly supportive supply/demand backdrop,” Metals Focus says.
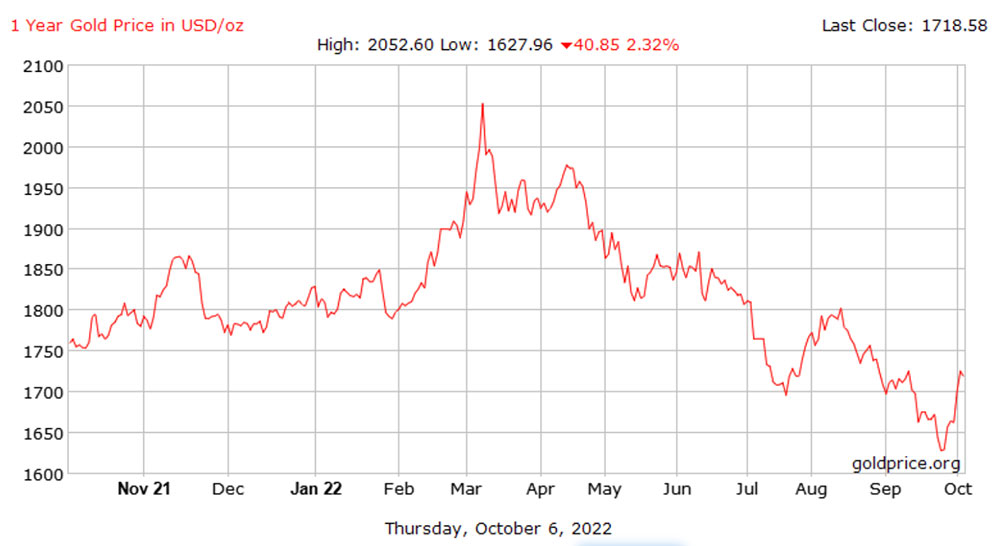
A great week for precious metals. Will it continue?
Gold jumped to $1,729 this week, its highest since 13th September, as US rate expectations were scaled back.
This translated to some healthy gains for ASX listed miners.
Gold is entering consolidation mode as traders await non-farm payrolls (NFP), says OANDA analyst Edward Moya.
“The lead up to NFP Friday saw a mixed round of employment readings that has many bullion investors on standby,” he says.
“A hot labour market and strong wages could keep the bond market selloff going and should decide what will be gold’s next major move.
“If non-farm payrolls does not deliver any major surprises, gold may still be stuck in a trading range between $1700 and $1740 as traders will wait for next week’s inflation report.”
Winners & Losers
Here’s how ASX-listed precious metals stocks are performing:
Scroll or swipe to reveal table. Click headings to sort. Best viewed on a laptop.
Stocks missing from this list? Email [email protected]
| CODE | COMPANY | 1 WEEK RETURN % | 1 MONTH RETURN % | 6 MONTH RETURN % | 1 YEAR RETURN % | PRICE | MARKET CAP |
|---|---|---|---|---|---|---|---|
| ALY | Alchemy Resource Ltd | 65% | 57% | 120% | 160% | 0.033 | $31,451,516 |
| CY5 | Cygnus Gold Limited | 61% | 55% | 156% | 278% | 0.435 | $54,458,567 |
| SIH | Sihayo Gold Limited | 50% | 20% | -40% | -70% | 0.003 | $18,306,384 |
| MI6 | Minerals260Limited | 44% | 9% | -24% | 0% | 0.375 | $83,600,000 |
| OBM | Ora Banda Mining Ltd | 35% | 45% | 69% | -12% | 0.081 | $107,171,010 |
| CMM | Capricorn Metals | 34% | 6% | -7% | 61% | 3.7 | $1,349,869,918 |
| GSN | Great Southern | 33% | 38% | -24% | -36% | 0.044 | $24,487,287 |
| ARV | Artemis Resources | 30% | 91% | -10% | -27% | 0.061 | $83,299,859 |
| AAJ | Aruma Resources Ltd | 29% | 12% | -56% | -12% | 0.073 | $11,458,190 |
| WWI | West Wits Mining Ltd | 27% | 12% | -42% | -54% | 0.019 | $38,190,716 |
| MRR | Minrex Resources Ltd | 26% | 10% | -33% | 194% | 0.053 | $56,314,229 |
| TIE | Tietto Minerals | 26% | 14% | 16% | 35% | 0.555 | $582,944,845 |
| HMG | Hamelingoldlimited | 22% | -7% | -7% | 0% | 0.14 | $15,400,000 |
| VRC | Volt Resources Ltd | 21% | 26% | 45% | 0% | 0.029 | $96,299,250 |
| AZS | Azure Minerals | 20% | 8% | -41% | -33% | 0.21 | $63,700,823 |
| RRL | Regis Resources | 19% | 11% | -13% | -18% | 1.7375 | $1,298,644,591 |
| RSG | Resolute Mining | 18% | -10% | -25% | -47% | 0.23 | $253,970,455 |
| BGD | Bartongoldholdings | 18% | 6% | -33% | 0% | 0.165 | $13,323,680 |
| PNR | Pantoro Limited | 17% | 4% | -35% | -9% | 0.1875 | $299,489,756 |
| BGL | Bellevue Gold Ltd | 17% | 6% | -13% | -4% | 0.825 | $864,210,067 |
| BRB | Breaker Res NL | 17% | 17% | -6% | -13% | 0.245 | $78,201,823 |
| WGX | Westgold Resources. | 16% | 6% | -50% | -47% | 0.92 | $433,364,798 |
| SLR | Silver Lake Resource | 16% | 5% | -36% | -14% | 1.28 | $1,171,477,860 |
| HMX | Hammer Metals Ltd | 16% | 12% | -50% | -2% | 0.057 | $46,743,378 |
| M24 | Mamba Exploration | 16% | 45% | 4% | -28% | 0.145 | $6,115,375 |
| NST | Northern Star | 15% | 17% | -15% | -4% | 8.63 | $9,854,025,928 |
| MAT | Matsa Resources | 15% | -7% | -45% | -33% | 0.039 | $15,616,276 |
| DCX | Discovex Res Ltd | 14% | -20% | -53% | -16% | 0.004 | $13,210,272 |
| PRU | Perseus Mining Ltd | 14% | 10% | -5% | 15% | 1.655 | $2,238,911,931 |
| IVR | Investigator Res Ltd | 14% | 11% | -25% | -20% | 0.049 | $66,615,683 |
| AGG | AngloGold Ashanti | 14% | 17% | -26% | 2% | 4.54 | $386,269,622 |
| GUL | Gullewa Limited | 13% | 13% | -4% | -21% | 0.068 | $12,981,411 |
| NES | Nelson Resources. | 13% | 31% | -11% | -57% | 0.017 | $5,003,052 |
| GOR | Gold Road Res Ltd | 13% | 10% | -7% | 7% | 1.3975 | $1,511,684,879 |
| CAI | Calidus Resources | 13% | -2% | -41% | -3% | 0.565 | $245,157,755 |
| KTA | Krakatoa Resources | 13% | 13% | 21% | 9% | 0.07 | $25,508,534 |
| PNX | PNX Metals Limited | 13% | 0% | -25% | -33% | 0.0045 | $19,998,260 |
| ZNC | Zenith Minerals Ltd | 13% | 0% | -24% | 50% | 0.315 | $106,876,306 |
| NAE | New Age Exploration | 13% | 50% | -36% | -18% | 0.009 | $12,923,090 |
| DTM | Dart Mining NL | 13% | -23% | -2% | -42% | 0.081 | $12,384,813 |
| TSO | Tesoro Gold Ltd | 13% | 0% | -54% | -66% | 0.036 | $31,578,789 |
| BAT | Battery Minerals Ltd | 13% | 0% | -55% | -68% | 0.0045 | $11,700,969 |
| AME | Alto Metals Limited | 12% | -9% | -18% | -24% | 0.067 | $35,814,013 |
| S2R | S2 Resources | 12% | 4% | -19% | 61% | 0.145 | $51,674,354 |
| GMD | Genesis Minerals | 11% | 1% | -38% | -17% | 1.14 | $335,231,867 |
| SBM | St Barbara Limited | 11% | -15% | -43% | -45% | 0.7725 | $628,352,067 |
| SSR | SSR Mining Inc. | 11% | 18% | -16% | 18% | 23.56 | $416,216,591 |
| GBZ | GBM Rsources Ltd | 11% | -30% | -70% | -64% | 0.04 | $22,388,555 |
| RGL | Riversgold | 11% | 11% | -57% | 77% | 0.04 | $30,232,408 |
| NSM | Northstaw | 11% | 0% | -47% | -46% | 0.15 | $18,019,050 |
| IGO | IGO Limited | 11% | 19% | 8% | 80% | 15.465 | $11,495,325,401 |
| BNR | Bulletin Res Ltd | 11% | -9% | -51% | 113% | 0.1275 | $36,573,888 |
| BCN | Beacon Minerals | 11% | 2% | -25% | -20% | 0.0255 | $93,919,204 |
| AAU | Antilles Gold Ltd | 11% | 8% | -24% | -38% | 0.052 | $19,785,155 |
| ALK | Alkane Resources Ltd | 10% | 6% | -35% | -19% | 0.74 | $438,118,256 |
| NCM | Newcrest Mining | 10% | 6% | -32% | -22% | 18.145 | $15,997,387,914 |
| PRX | Prodigy Gold NL | 10% | -12% | -44% | -68% | 0.011 | $11,333,692 |
| SAU | Southern Gold | 10% | -3% | -40% | -48% | 0.033 | $6,826,520 |
| M2R | Miramar | 10% | -13% | -43% | -49% | 0.1 | $6,418,666 |
| KAI | Kairos Minerals Ltd | 10% | 21% | 13% | 13% | 0.034 | $70,707,366 |
| E2M | E2 Metals | 10% | -2% | -39% | -47% | 0.1425 | $25,887,202 |
| WRM | White Rock Min Ltd | 10% | -11% | -62% | -71% | 0.08 | $16,196,867 |
| BNZ | Benzmining | 9% | -17% | -34% | -31% | 0.48 | $33,265,682 |
| SVL | Silver Mines Limited | 9% | 3% | -22% | -8% | 0.18 | $232,529,786 |
| SBR | Sabre Resources | 9% | 0% | 9% | 20% | 0.006 | $15,344,208 |
| DCN | Dacian Gold Ltd | 9% | 0% | -59% | -49% | 0.1 | $120,463,293 |
| TUL | Tulla Resources | 9% | -8% | -20% | 12% | 0.4775 | $77,705,183 |
| CHN | Chalice Mining Ltd | 8% | -5% | -39% | -25% | 4.16 | $1,569,159,299 |
| GCY | Gascoyne Res Ltd | 8% | -31% | -7% | -34% | 0.26 | $119,289,871 |
| CPM | Coopermetalslimited | 8% | -27% | -18% | 0% | 0.33 | $12,271,600 |
| BMR | Ballymore Resources | 8% | 8% | 5% | -22% | 0.2 | $14,695,616 |
| KZR | Kalamazoo Resources | 8% | -13% | -41% | -40% | 0.2 | $29,763,875 |
| ADT | Adriatic Metals | 8% | 1% | -15% | -30% | 2.14 | $462,139,029 |
| SMS | Starmineralslimited | 8% | 36% | -53% | 0% | 0.095 | $2,706,570 |
| NWM | Norwest Minerals | 8% | -32% | -34% | -47% | 0.041 | $9,106,403 |
| WAF | West African Res Ltd | 8% | -10% | -14% | 0% | 1.075 | $1,102,736,182 |
| AQI | Alicanto Min Ltd | 8% | -19% | -59% | -61% | 0.043 | $17,656,386 |
| GED | Golden Deeps | 7% | 0% | -35% | 50% | 0.015 | $17,328,401 |
| MEI | Meteoric Resources | 7% | 15% | 0% | -38% | 0.015 | $19,841,866 |
| AWV | Anova Metals Ltd | 7% | 11% | 7% | -32% | 0.015 | $23,971,413 |
| CLA | Celsius Resource Ltd | 7% | 15% | -46% | -38% | 0.015 | $22,542,436 |
| AUC | Ausgold Limited | 7% | 2% | -34% | 18% | 0.045 | $89,296,880 |
| CBY | Canterbury Resources | 7% | 22% | -35% | -57% | 0.045 | $6,031,059 |
| RDS | Redstone Resources | 7% | -6% | -42% | -32% | 0.0075 | $5,526,243 |
| MXR | Maximus Resources | 7% | -13% | -37% | -41% | 0.047 | $15,945,288 |
| GAL | Galileo Mining Ltd | 7% | 20% | 473% | 404% | 1.26 | $286,241,977 |
| NML | Navarre Minerals Ltd | 7% | 14% | -43% | -48% | 0.048 | $70,456,078 |
| EMR | Emerald Res NL | 6% | -1% | 0% | 18% | 1.155 | $682,526,130 |
| XTC | Xantippe Res Ltd | 6% | -6% | -43% | 325% | 0.0085 | $65,161,839 |
| KAU | Kaiser Reef | 6% | -3% | -19% | -26% | 0.17 | $22,722,125 |
| HXG | Hexagon Energy | 6% | 6% | -60% | -78% | 0.017 | $8,719,570 |
| SPQ | Superior Resources | 6% | 4% | 9% | 364% | 0.051 | $86,762,241 |
| ASO | Aston Minerals Ltd | 6% | 8% | -49% | -25% | 0.09 | $94,650,129 |
| KRM | Kingsrose Mining Ltd | 6% | 10% | -30% | 9% | 0.055 | $42,894,012 |
| SFR | Sandfire Resources | 5% | 4% | -30% | -23% | 3.95 | $1,661,235,512 |
| MZZ | Matador Mining Ltd | 5% | -9% | -60% | -71% | 0.105 | $29,633,621 |
| ARL | Ardea Resources Ltd | 5% | 16% | -41% | 143% | 0.97 | $164,645,639 |
| EVN | Evolution Mining Ltd | 5% | -6% | -50% | -43% | 2.08 | $3,871,668,825 |
| CST | Castile Resources | 5% | -8% | -37% | -50% | 0.11 | $27,804,401 |
| RML | Resolution Minerals | 5% | 38% | -35% | -45% | 0.011 | $10,524,208 |
| MRZ | Mont Royal Resources | 4% | -11% | -38% | -35% | 0.24 | $15,418,269 |
| KIN | KIN Min NL | 4% | -3% | -20% | -31% | 0.072 | $77,590,592 |
| BYH | Bryah Resources Ltd | 4% | -11% | -51% | -54% | 0.025 | $7,260,590 |
| FML | Focus Minerals Ltd | 4% | -11% | -49% | -50% | 0.125 | $35,819,831 |
| KAL | Kalgoorliegoldmining | 4% | -7% | -16% | 0% | 0.13 | $9,416,498 |
| CDT | Castle Minerals | 4% | -10% | -61% | 86% | 0.026 | $24,987,325 |
| STN | Saturn Metals | 4% | -2% | -32% | -35% | 0.26 | $32,474,794 |
| HCH | Hot Chili Ltd | 4% | 1% | -35% | -49% | 0.97 | $115,861,850 |
| QML | Qmines Limited | 3% | 3% | -50% | -61% | 0.15 | $11,193,235 |
| MKR | Manuka Resources. | 3% | -3% | -49% | -53% | 0.15 | $41,472,955 |
| XAM | Xanadu Mines Ltd | 3% | 0% | -19% | 11% | 0.03 | $40,955,546 |
| A8G | Australasian Metals | 3% | 11% | -41% | -29% | 0.3 | $12,351,148 |
| KSN | Kingston Resources | 3% | 2% | -44% | -54% | 0.092 | $38,445,886 |
| MEK | Meeka Metals Limited | 3% | -6% | 32% | 38% | 0.062 | $64,564,978 |
| SVY | Stavely Minerals Ltd | 3% | 3% | -63% | -56% | 0.16 | $51,672,745 |
| POL | Polymetals Resources | 3% | -6% | 33% | 14% | 0.16 | $6,589,231 |
| HRN | Horizon Gold Ltd | 3% | -6% | -19% | -5% | 0.34 | $36,928,584 |
| AGC | AGC Ltd | 3% | -4% | -19% | -44% | 0.07 | $4,876,364 |
| CLZ | Classic Min Ltd | 3% | 14% | -88% | -88% | 0.0175 | $7,611,316 |
| A1G | African Gold Ltd. | 3% | -14% | -61% | -68% | 0.073 | $8,716,954 |
| PDI | Predictive Disc Ltd | 3% | 0% | -10% | -21% | 0.185 | $315,970,703 |
| TTM | Titan Minerals | 3% | 36% | -23% | -25% | 0.075 | $105,845,489 |
| PNT | Panthermetalsltd | 3% | 6% | -16% | 0% | 0.19 | $5,795,000 |
| PGD | Peregrine Gold | 3% | -6% | 22% | 53% | 0.61 | $23,232,934 |
| AMI | Aurelia Metals Ltd | 3% | -13% | -57% | -33% | 0.205 | $266,049,001 |
| SLZ | Sultan Resources Ltd | 2% | -10% | -44% | -55% | 0.09 | $7,495,595 |
| TAM | Tanami Gold NL | 2% | 5% | -23% | -35% | 0.046 | $54,054,464 |
| DRE | Dreadnought Resources Ltd | 2% | -23% | 122% | 178% | 0.1 | $319,466,023 |
| DEX | Duke Exploration | 2% | -28% | -68% | -76% | 0.05 | $4,510,558 |
| DEG | De Grey Mining | 2% | 10% | -12% | -4% | 1.065 | $1,495,443,670 |
| RMS | Ramelius Resources | 2% | -3% | -49% | -52% | 0.6925 | $595,760,043 |
| TLM | Talisman Mining | 2% | -10% | -22% | -13% | 0.14 | $26,283,530 |
| HAV | Havilah Resources | 2% | -13% | 55% | 63% | 0.31 | $99,741,351 |
| TBR | Tribune Res Ltd | 1% | -3% | -29% | -29% | 3.52 | $181,539,546 |
| AXE | Archer Materials | 1% | -3% | -15% | -47% | 0.77 | $192,562,085 |
| AAR | Astral Resources NL | 1% | -7% | -27% | -1% | 0.079 | $49,780,966 |
| RVR | Red River Resources | 1% | -27% | -65% | -49% | 0.084 | $41,477,159 |
| GML | Gateway Mining | 1% | -6% | -27% | -51% | 0.088 | $19,888,965 |
| PNM | Pacific Nickel Mines | 1% | 0% | -22% | 13% | 0.09 | $24,414,827 |
| PGO | Pacgold | 1% | 15% | -29% | 87% | 0.485 | $25,557,244 |
| NPM | Newpeak Metals | 0% | 0% | 0% | -50% | 0.001 | $8,853,750 |
| FFX | Firefinch Ltd | 0% | 0% | -48% | -1% | 0.2 | $236,248,644 |
| AQX | Alice Queen Ltd | 0% | 0% | -57% | -70% | 0.003 | $6,600,750 |
| GIB | Gibb River Diamonds | 0% | 10% | -8% | -25% | 0.055 | $11,633,019 |
| TMX | Terrain Minerals | 0% | -22% | -42% | -13% | 0.007 | $5,325,327 |
| SKY | SKY Metals Ltd | 0% | -29% | -47% | -49% | 0.05 | $19,592,740 |
| YRL | Yandal Resources | 0% | -9% | -40% | -69% | 0.15 | $17,413,733 |
| IPT | Impact Minerals | 0% | -13% | -48% | -52% | 0.007 | $18,610,279 |
| BBX | BBX Minerals Ltd | 0% | -23% | -52% | -70% | 0.06 | $29,203,289 |
| CWX | Carawine Resources | 0% | -5% | -55% | -51% | 0.095 | $13,094,263 |
| CAZ | Cazaly Resources | 0% | 3% | -14% | -18% | 0.037 | $12,978,763 |
| REZ | Resourc & En Grp Ltd | 0% | -26% | -58% | -51% | 0.02 | $9,996,116 |
| SRN | Surefire Rescs NL | 0% | -7% | -24% | -7% | 0.013 | $20,557,725 |
| WCN | White Cliff Min Ltd | 0% | -19% | -42% | 75% | 0.021 | $15,699,671 |
| ASR | Asra Minerals Ltd | 0% | 56% | -4% | -7% | 0.025 | $36,606,538 |
| CTO | Citigold Corp Ltd | 0% | -14% | -25% | -40% | 0.006 | $14,168,295 |
| SMI | Santana Minerals Ltd | 0% | -18% | 10% | 288% | 0.66 | $95,964,237 |
| GRL | Godolphin Resources | 0% | -1% | -37% | -39% | 0.088 | $10,416,511 |
| TRY | Troy Resources Ltd | 0% | 0% | 0% | 0% | 0.0295 | $62,920,961 |
| CGN | Crater Gold Min Ltd | 0% | 0% | 0% | 0% | 0.017 | $21,063,474 |
| LNY | Laneway Res Ltd | 0% | 9% | 0% | 4% | 0.006 | $34,019,227 |
| TSC | Twenty Seven Co. Ltd | 0% | 0% | -29% | -43% | 0.002 | $10,041,254 |
| ADV | Ardiden Ltd | 0% | 0% | -50% | -30% | 0.007 | $18,678,347 |
| VKA | Viking Mines Ltd | 0% | -13% | -36% | -56% | 0.007 | $7,176,809 |
| DDD | 3D Resources Limited | 0% | -33% | -75% | -75% | 0.001 | $4,431,872 |
| PRS | Prospech Limited | 0% | 10% | -33% | -53% | 0.033 | $2,150,973 |
| FG1 | Flynngold | 0% | 16% | -42% | -39% | 0.11 | $7,046,716 |
| AL8 | Alderan Resource Ltd | 0% | -18% | -68% | -78% | 0.009 | $5,204,395 |
| MEG | Megado Minerals Ltd | 0% | -20% | -20% | -14% | 0.08 | $8,723,904 |
| TBA | Tombola Gold Ltd | 0% | 9% | -24% | -13% | 0.035 | $38,216,946 |
| PF1 | Pathfinder Resources | 0% | 0% | 0% | 59% | 0.5 | $26,560,505 |
| SFM | Santa Fe Minerals | 0% | 0% | -35% | 0% | 0.085 | $6,189,597 |
| X64 | Ten Sixty Four Ltd | 0% | 4% | -28% | -19% | 0.6 | $142,472,688 |
| SI6 | SI6 Metals Limited | 0% | -14% | -40% | -50% | 0.006 | $8,929,134 |
| OKR | Okapi Resources | 0% | -16% | -18% | -49% | 0.245 | $34,664,406 |
| WMC | Wiluna Mining Corp | 0% | 0% | -73% | -77% | 0.205 | $74,238,031 |
| BMO | Bastion Minerals | 0% | -25% | -57% | -68% | 0.079 | $7,498,412 |
| GBR | Greatbould Resources | 0% | -5% | -20% | -41% | 0.1 | $42,287,217 |
| LCY | Legacy Iron Ore | 0% | 0% | -5% | 36% | 0.019 | $121,729,698 |
| STK | Strickland Metals | 0% | -25% | -27% | -33% | 0.04 | $53,916,278 |
| CEL | Challenger Exp Ltd | 0% | -15% | -49% | -41% | 0.165 | $172,410,356 |
| MBK | Metal Bank Ltd | 0% | -13% | -42% | -59% | 0.0035 | $7,823,454 |
| TAR | Taruga Minerals | 0% | 3% | 29% | -38% | 0.031 | $17,341,447 |
| PUR | Pursuit Minerals | 0% | 0% | -62% | -64% | 0.013 | $11,978,150 |
| PKO | Peako Limited | 0% | 5% | 0% | -17% | 0.02 | $7,583,639 |
| OAU | Ora Gold Limited | 0% | 0% | -53% | -47% | 0.008 | $7,873,850 |
| GNM | Great Northern | 0% | -11% | -33% | -50% | 0.004 | $6,836,204 |
| BTR | Brightstar Resources | 0% | 25% | -43% | -43% | 0.02 | $12,937,217 |
| TRM | Truscott Mining Corp | 0% | -21% | -18% | 14% | 0.033 | $5,209,728 |
| ENR | Encounter Resources | 0% | -27% | -23% | -35% | 0.12 | $40,313,268 |
| AYM | Australia United Min | 0% | -20% | -43% | -50% | 0.004 | $7,370,310 |
| ANL | Amani Gold Ltd | 0% | -33% | -50% | -67% | 0.001 | $35,540,162 |
| RDT | Red Dirt Metals Ltd | -1% | 3% | -9% | -26% | 0.61 | $199,197,494 |
| KNB | Koonenberrygold | -1% | 7% | -10% | -41% | 0.079 | $5,909,003 |
| ERM | Emmerson Resources | -1% | -14% | -44% | 22% | 0.078 | $41,942,654 |
| CHZ | Chesser Resources | -1% | -7% | -29% | -32% | 0.078 | $46,461,726 |
| NVA | Nova Minerals Ltd | -1% | -25% | -28% | -35% | 0.68 | $128,562,893 |
| BC8 | Black Cat Syndicate | -2% | -12% | -49% | -38% | 0.32 | $70,618,078 |
| AM7 | Arcadia Minerals | -2% | 13% | 7% | 51% | 0.295 | $14,476,347 |
| RXL | Rox Resources | -2% | -6% | -36% | -34% | 0.245 | $43,924,646 |
| LM8 | Lunnonmetalslimited | -2% | -7% | -12% | 99% | 0.8375 | $92,021,256 |
| MLS | Metals Australia | -2% | -12% | -66% | 10% | 0.044 | $26,709,592 |
| ADN | Andromeda Metals Ltd | -2% | -21% | -62% | -70% | 0.044 | $146,170,396 |
| GMR | Golden Rim Resources | -2% | -7% | -38% | -52% | 0.043 | $13,184,363 |
| DTR | Dateline Resources | -2% | -10% | -20% | -12% | 0.08 | $43,183,826 |
| VAN | Vango Mining Ltd | -3% | 3% | 11% | -38% | 0.039 | $49,137,568 |
| SNG | Siren Gold | -3% | -3% | -51% | -30% | 0.19 | $18,756,329 |
| KWR | Kingwest Resources | -3% | -46% | -79% | -73% | 0.037 | $10,705,619 |
| RED | Red 5 Limited | -3% | -18% | -50% | -18% | 0.185 | $437,000,380 |
| AUT | Auteco Minerals | -3% | -20% | -52% | -51% | 0.036 | $74,442,107 |
| CDR | Codrus Minerals Ltd | -3% | -18% | -24% | -55% | 0.069 | $2,760,000 |
| HRZ | Horizon | -3% | -11% | -55% | -41% | 0.065 | $40,391,982 |
| CYL | Catalyst Metals | -3% | -9% | -34% | -34% | 1.255 | $121,101,062 |
| ANX | Anax Metals Ltd | -3% | -14% | -37% | -33% | 0.062 | $25,148,946 |
| HAW | Hawthorn Resources | -3% | 0% | -3% | 48% | 0.09 | $30,016,405 |
| VMC | Venus Metals Cor Ltd | -3% | -19% | -22% | -17% | 0.145 | $23,211,409 |
| TG1 | Techgen Metals Ltd | -3% | -36% | -3% | -24% | 0.145 | $8,486,088 |
| KCN | Kingsgate Consolid. | -4% | 0% | -9% | -6% | 1.555 | $344,153,304 |
| MEU | Marmota Limited | -4% | -4% | 9% | 12% | 0.048 | $49,763,627 |
| FEG | Far East Gold | -4% | 78% | 163% | 0% | 0.71 | $89,087,163 |
| MGV | Musgrave Minerals | -4% | -10% | -30% | -24% | 0.235 | $132,440,373 |
| TCG | Turaco Gold Limited | -4% | -20% | -60% | -65% | 0.044 | $18,819,533 |
| LRL | Labyrinth Resources | -5% | -9% | -51% | -40% | 0.021 | $18,340,702 |
| MTC | Metalstech Ltd | -5% | 49% | 24% | -35% | 0.41 | $69,165,805 |
| RND | Rand Mining Ltd | -5% | 1% | -9% | -5% | 1.43 | $81,332,624 |
| TMZ | Thomson Res Ltd | -5% | -17% | -61% | -76% | 0.02 | $16,933,705 |
| GSM | Golden State Mining | -5% | -28% | -65% | -71% | 0.039 | $4,563,554 |
| THR | Thor Mining PLC | -5% | -5% | -44% | -44% | 0.0095 | $9,892,470 |
| ZAG | Zuleika Gold Ltd | -5% | -14% | -42% | -28% | 0.018 | $9,387,911 |
| GTR | Gti Energy Ltd | -6% | -24% | -38% | -43% | 0.016 | $24,087,737 |
| MDI | Middle Island Res | -6% | -9% | -53% | -33% | 0.063 | $7,589,930 |
| ICL | Iceni Gold | -6% | -14% | -18% | -63% | 0.09 | $11,537,679 |
| G88 | Golden Mile Res Ltd | -7% | -20% | -56% | -40% | 0.028 | $5,728,513 |
| LEX | Lefroy Exploration | -7% | -3% | -10% | -27% | 0.28 | $40,844,907 |
| ARN | Aldoro Resources | -7% | -22% | -29% | -44% | 0.21 | $20,913,337 |
| MOH | Moho Resources | -7% | -18% | -52% | -56% | 0.027 | $5,606,880 |
| LCL | Los Cerros Limited | -7% | -24% | -76% | -80% | 0.026 | $16,916,870 |
| RMX | Red Mount Min Ltd | -8% | 0% | -33% | -33% | 0.006 | $9,854,183 |
| EM2 | Eagle Mountain | -8% | 8% | -53% | -71% | 0.21 | $57,676,989 |
| CXU | Cauldron Energy Ltd | -8% | 0% | -33% | -60% | 0.012 | $6,424,935 |
| MKG | Mako Gold | -8% | -24% | -47% | -49% | 0.047 | $17,583,114 |
| MAU | Magnetic Resources | -8% | -12% | -38% | -44% | 0.9 | $213,617,110 |
| AWJ | Auric Mining | -8% | -13% | -11% | -45% | 0.0715 | $5,506,816 |
| NXM | Nexus Minerals Ltd | -10% | -17% | -58% | -47% | 0.19 | $60,506,129 |
| ICG | Inca Minerals Ltd | -10% | -23% | -75% | -70% | 0.037 | $17,354,262 |
| RDN | Raiden Resources Ltd | -10% | 13% | -47% | -64% | 0.009 | $11,876,415 |
| IDA | Indiana Resources | -10% | -17% | -1% | 8% | 0.0575 | $29,028,289 |
| NMR | Native Mineral Res | -10% | 0% | -35% | -35% | 0.13 | $6,539,875 |
| MVL | Marvel Gold Limited | -11% | -17% | -47% | -63% | 0.025 | $16,907,865 |
| NAG | Nagambie Resources | -11% | 3% | 44% | 9% | 0.075 | $38,485,962 |
| PUA | Peak Minerals Ltd | -11% | -20% | -58% | -40% | 0.008 | $8,330,966 |
| MCT | Metalicity Limited | -11% | -11% | -31% | -58% | 0.004 | $12,105,471 |
| MHC | Manhattan Corp Ltd | -11% | 0% | -41% | -27% | 0.008 | $12,210,230 |
| LYN | Lycaonresources | -11% | -5% | -31% | 0% | 0.275 | $8,618,063 |
| MM8 | Medallion Metals. | -11% | -18% | -45% | -25% | 0.155 | $21,693,034 |
| OZM | Ozaurum Resources | -12% | -35% | -38% | -48% | 0.075 | $5,228,700 |
| EMU | EMU NL | -13% | -22% | -73% | -73% | 0.007 | $4,398,516 |
| GWR | GWR Group Ltd | -13% | -24% | -61% | -50% | 0.068 | $21,842,733 |
| MOM | Moab Minerals Ltd | -13% | -53% | -53% | -53% | 0.013 | $8,865,525 |
| KCC | Kincora Copper | -14% | -10% | -55% | -59% | 0.056 | $4,364,040 |
| AVM | Advance Metals Ltd | -15% | -8% | -35% | -45% | 0.011 | $5,256,651 |
| FAU | First Au Ltd | -17% | -17% | -67% | -62% | 0.005 | $4,657,055 |
| G50 | Gold50Limited | -17% | -14% | -49% | -45% | 0.12 | $6,833,160 |
| BEZ | Besragoldinc | -21% | -37% | -48% | 0% | 0.031 | $8,435,092 |
| GMN | Gold Mountain Ltd | -22% | 0% | -13% | -65% | 0.007 | $10,382,044 |
| MTH | Mithril Resources | -25% | -18% | -59% | -68% | 0.0045 | $14,701,165 |
| GSR | Greenstone Resources | -39% | -40% | 3% | 56% | 0.039 | $70,581,397 |
| AVW | Avira Resources Ltd | -40% | -25% | -57% | -50% | 0.003 | $6,356,370 |

Related Stories


UNLOCK INSIGHTS
Discover the untold stories of emerging ASX stocks.
Daily news and expert analysis, it's free to subscribe.
By proceeding, you confirm you understand that we handle personal information in accordance with our Privacy Policy.


