Gold Digger: How inflation and geopolitical risks will sustain gold demand as a hedge

Pic: Andreas Berheide / EyeEm / EyeEm via Getty Images
- The World Gold Council has released its mid-year outlook for the metal
- Gold’s strategic and tactical role remain relevant to investors while uncertainty stays elevated
- The metal typically outperforms other commodities during higher inflationary periods
Our Gold Digger column wraps all the news driving ASX stocks with exposure to precious metals.
The World Gold Council (WGC) has released its mid-year outlook for the metal and it’s no surprise it reckons inflation and geopolitical risks will likely sustain demand for gold as a hedge in H2.
Plus, the WGC says more rate hikes are already priced into the market and that the underperformance of stocks and bonds in a potential stagflationary environment may also be positive for gold.
“Gold’s both strategic and tactical role will likely remain relevant to investors, particularly while uncertainty stays elevated,” the report said.
Geopolitics, heightened inflation and monetary policy uncertainty are all top of mind for investors in the second half of 2022. We analyzed this in our mid-year outlook, released today, and recapped gold’s likely behavior during this volatile time: https://t.co/Uk0K3R8sR0 pic.twitter.com/orNFCfz2Ty
— Juan Carlos Artigas (@JCArtigas_WGC) July 7, 2022
Monetary policy uncertainty will ramp up volatility
Most central banks were expected to lift policy rates this year, but many have stepped up their actions in response to persistently high inflation which is being felt in financial markets.
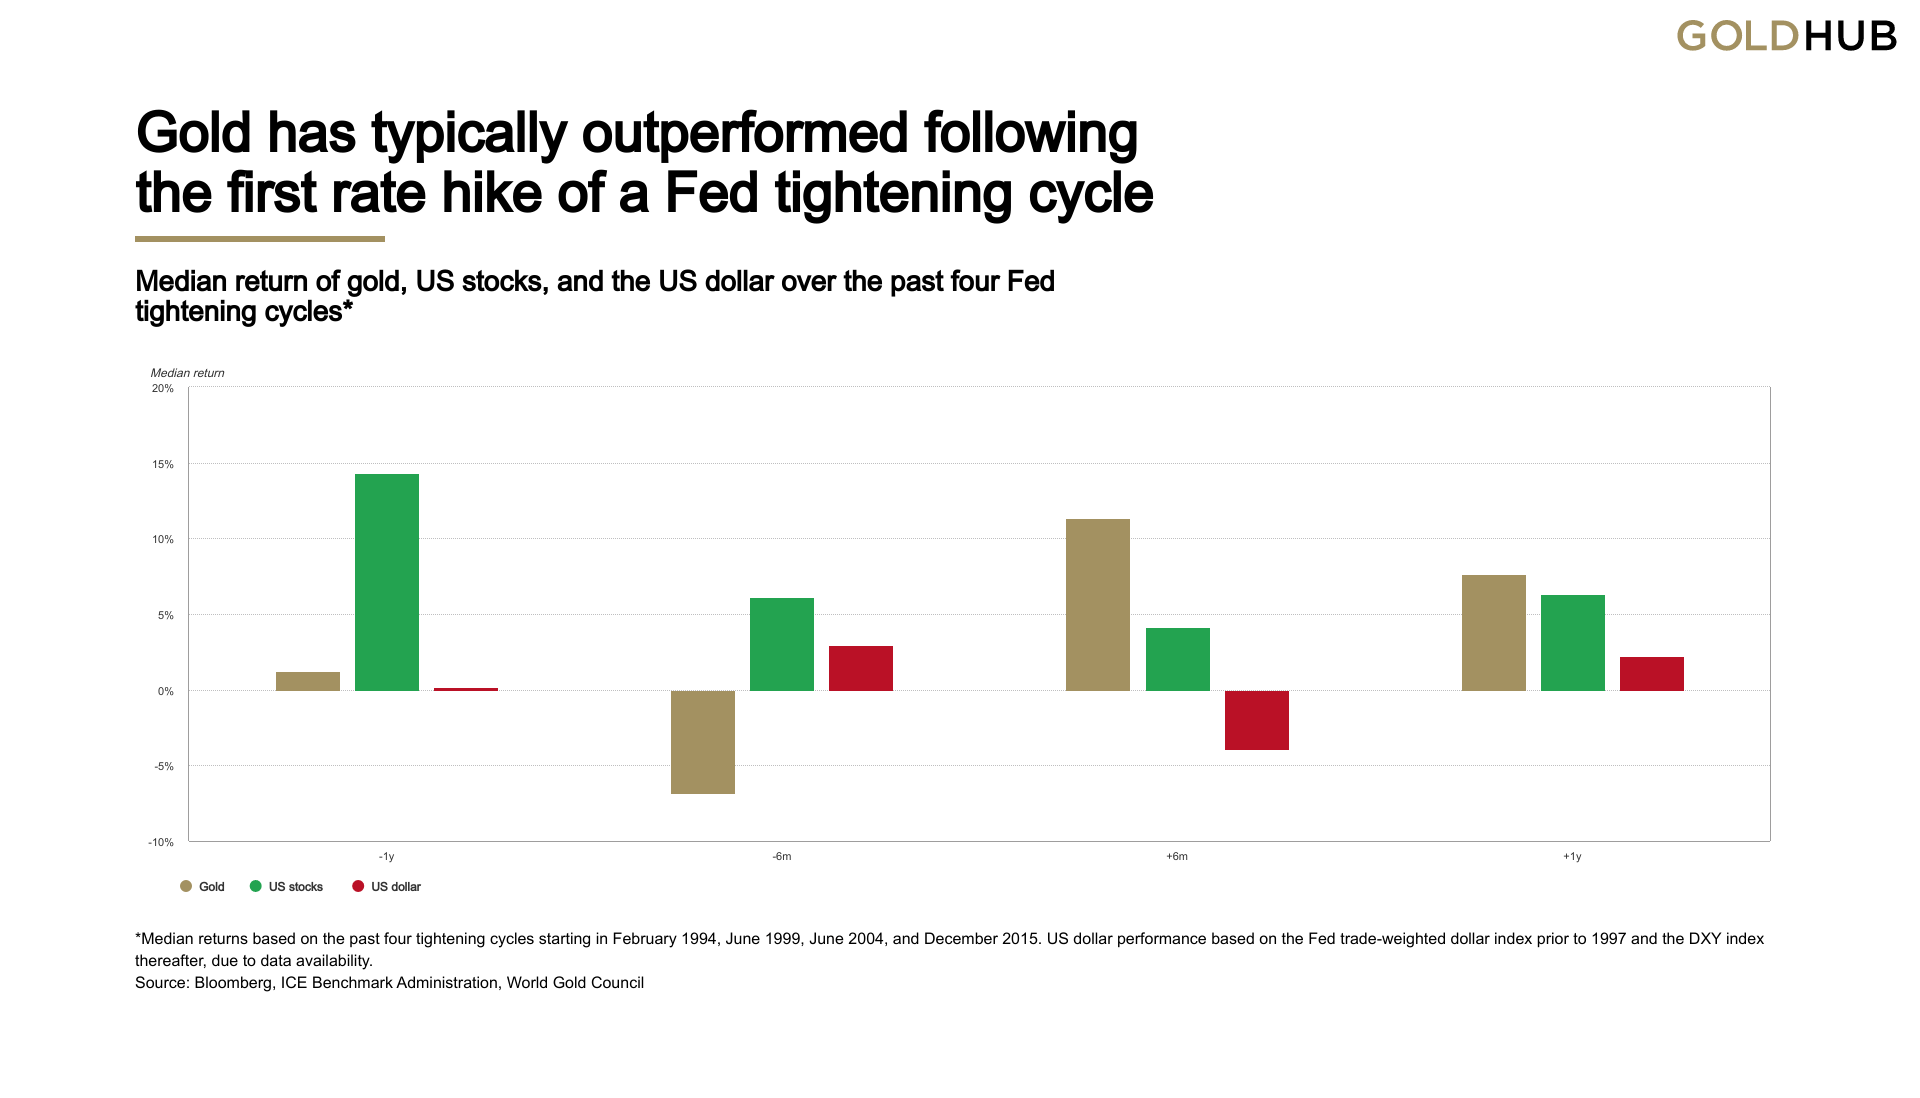
The WGC says that investor expectations of future monetary policy decisions, expressed through bond yields, have historically been a key influence on gold price performance.
But, while gold has historically underperformed in the months leading up to a Fed tightening cycle, it actually outperforms in the months following the first rate hike.
Gold outperforms in higher inflationary periods
While investors expect inflation to cool down eventually, the WGC believes it will remain high due to lingering commodity-related supply-chain disruptions from the pandemic and the Ukraine war, which have caused a surge in key energy and commodity prices.
Added to this, tight labour markets are causing concerns that wages/labour costs may rise further.
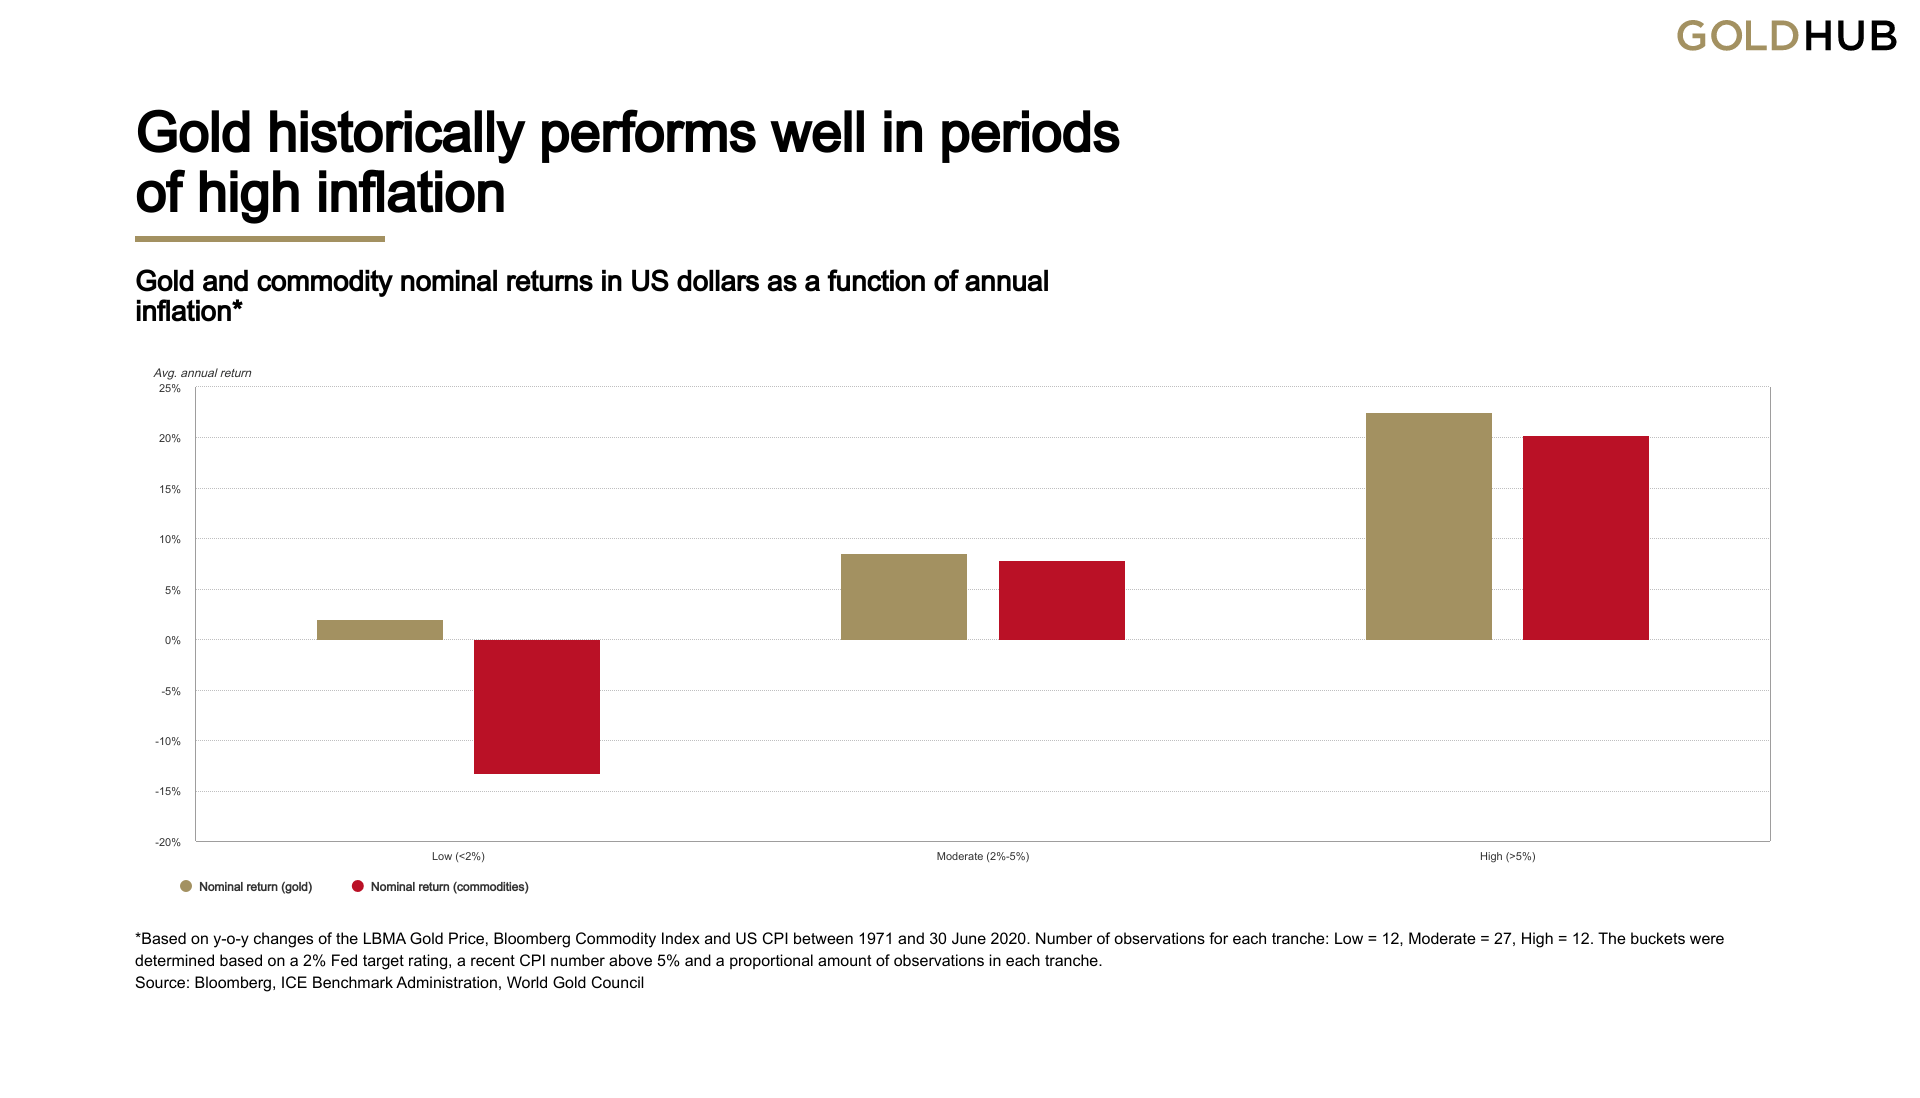
“Gold has historically performed well amid high inflation,” the report said.
“In years when inflation was higher than 3%, gold’s price increased 14% on average, and in periods where US CPI averaged over 5% on a y-o-y basis – currently at ~8% – gold has averaged nearly 25%.”
“Also, gold has outperformed other commodities in higher inflationary periods, which has yet to happen this time around.
“However, our analysis suggests that gold lags other commodities in commodity-led inflationary periods, and catches up and outperforms over the subsequent 12-18 months.”
The ‘death cross’ for gold?
In contrast, FxPro senior market analyst Alex Kuptsikevich says gold is drowning.
The metal fell more than 2.3% on Tuesday, the second steepest daily drop a year after falling 2.5% on June 13.
“The most obvious factor is the sharp rise in the dollar on forex, where the DXY index (a basket of the world’s six most popular currencies) has renewed its highs over the last 20 years,” he said.
“Gold often acts as an ‘anti-dollar with leverage’ for investors, so it was unsurprising to see such a market reaction.
“A second possible explanation is a bearish signal, the ‘death cross’.
“The 50-day Moving Average fell below the 200-day MA on Monday, but we saw a full-swing market reaction only after liquidity returned after the long weekend in the USA.
“The third factor was the continuing sell-off in industrial metals and the drop in silver due to the worsening global economic outlook.”
Silver dipped below $19 an ounce on Wednesday morning, the lowest since July 2020.
“The price of gold is now at its low since late last year,” Kuptsikevich said.
“This position simultaneously shows us buyer strength and tremendous potential for a decline.”
Winners & Losers
Here’s how ASX-listed precious metals stocks are performing:
Scroll or swipe to reveal table. Click headings to sort. Best viewed on a laptop.
> Stocks missing from this list? Email [email protected]
| Code | Company | Price | % Year | % Six Month | % Month | % Week | Market Cap |
|---|---|---|---|---|---|---|---|
| OBM | Ora Banda Mining Ltd | 0.049 | -67% | -15% | 48% | 81% | $68,699,365.15 |
| SIH | Sihayo Gold Limited | 0.003 | -73% | -63% | 0% | 50% | $15,255,320.23 |
| ANL | Amani Gold Ltd | 0.0015 | 0% | -25% | 0% | 50% | $34,940,161.69 |
| ASO | Aston Minerals Ltd | 0.115 | -28% | 5% | -12% | 49% | $103,558,376.86 |
| KZR | Kalamazoo Resources | 0.225 | -39% | -38% | -27% | 41% | $29,038,874.80 |
| BAT | Battery Minerals Ltd | 0.0055 | -69% | -56% | -8% | 38% | $14,522,365.59 |
| HXG | Hexagon Energy | 0.023 | -70% | -69% | -18% | 35% | $11,797,065.72 |
| KAL | Kalgoorliegoldmining | 0.13 | 0% | -7% | 18% | 34% | $9,416,498.00 |
| GWR | GWR Group Ltd | 0.12 | -70% | -37% | 9% | 33% | $38,545,998.60 |
| RMX | Red Mount Min Ltd | 0.006 | -40% | -40% | -14% | 33% | $9,854,183.15 |
| CLA | Celsius Resource Ltd | 0.016 | -59% | -38% | -11% | 33% | $19,543,452.29 |
| ALY | Alchemy Resource Ltd | 0.016 | 9% | 23% | -24% | 33% | $14,296,110.86 |
| PUR | Pursuit Minerals | 0.017 | -75% | -35% | -15% | 31% | $16,121,086.30 |
| FG1 | Flynngold | 0.13 | -13% | -19% | 4% | 30% | $8,327,936.50 |
| EMU | EMU NL | 0.013 | -67% | -35% | -13% | 30% | $6,872,681.05 |
| KAI | Kairos Minerals Ltd | 0.022 | -33% | -19% | -8% | 29% | $41,203,963.31 |
| CXU | Cauldron Energy Ltd | 0.009 | -77% | -68% | -31% | 29% | $4,818,701.49 |
| NES | Nelson Resources. | 0.014 | -74% | -61% | -13% | 27% | $3,825,863.13 |
| GSR | Greenstone Resources | 0.052 | 174% | 86% | -10% | 27% | $45,097,962.32 |
| AVM | Advance Metals Ltd | 0.01 | -37% | -41% | -29% | 25% | $4,778,774.02 |
| LNY | Laneway Res Ltd | 0.005 | 30% | -25% | 0% | 25% | $31,510,082.05 |
| DDD | 3D Resources Limited | 0.0025 | -50% | -29% | -17% | 25% | $10,454,680.23 |
| SBR | Sabre Resources | 0.005 | 25% | 0% | 0% | 25% | $11,158,924.03 |
| FEG | Far East Gold | 0.355 | 0% | 0% | 11% | 25% | $40,882,465.35 |
| TIE | Tietto Minerals | 0.385 | 13% | -23% | -1% | 24% | $374,210,149.56 |
| DTM | Dart Mining NL | 0.062 | -54% | -28% | -7% | 24% | $7,168,788.48 |
| XTC | Xantippe Res Ltd | 0.0085 | 325% | -23% | -15% | 21% | $55,623,039.95 |
| BBX | BBX Minerals Ltd | 0.115 | -54% | -30% | -26% | 21% | $64,403,006.50 |
| ARN | Aldoro Resources | 0.15 | -66% | -60% | -29% | 20% | $14,882,038.35 |
| DCN | Dacian Gold Ltd | 0.098 | -65% | -51% | -46% | 20% | $104,167,398.05 |
| CPM | Coopermetalslimited | 0.45 | 0% | 73% | 5% | 18% | $11,483,500.00 |
| AL8 | Alderan Resource Ltd | 0.013 | -76% | -52% | -24% | 18% | $5,532,359.04 |
| CDT | Castle Minerals | 0.026 | 73% | -35% | -21% | 18% | $23,987,831.62 |
| PKO | Peako Limited | 0.013 | -65% | -35% | -19% | 18% | $4,009,903.31 |
| KWR | Kingwest Resources | 0.059 | -34% | -70% | -56% | 18% | $14,335,408.48 |
| SBM | St Barbara Limited | 0.885 | -54% | -33% | -25% | 18% | $677,059,857.44 |
| STN | Saturn Metals | 0.33 | -22% | -18% | -13% | 18% | $42,866,728.41 |
| GBR | Greatbould Resources | 0.083 | -8% | -39% | -6% | 17% | $34,252,646.01 |
| GTR | Gti Energy Ltd | 0.014 | -42% | -42% | -7% | 17% | $19,402,286.53 |
| MOH | Moho Resources | 0.028 | -63% | -52% | -18% | 17% | $4,630,165.03 |
| NVA | Nova Minerals Ltd | 0.7 | -42% | -39% | 19% | 17% | $126,141,599.50 |
| M2R | Miramar | 0.1 | -47% | -44% | -5% | 16% | $5,905,173.00 |
| IVR | Investigator Res Ltd | 0.043 | -45% | -35% | -14% | 16% | $57,289,487.25 |
| TAR | Taruga Minerals | 0.022 | -59% | -45% | -12% | 16% | $12,717,061.28 |
| RRL | Regis Resources | 1.505 | -42% | -18% | -21% | 16% | $1,132,466,082.00 |
| AXE | Archer Materials | 0.635 | -37% | -43% | -14% | 15% | $149,080,324.20 |
| GIB | Gibb River Diamonds | 0.045 | -20% | -42% | -13% | 15% | $9,517,925.03 |
| PRS | Prospech Limited | 0.03 | -79% | -48% | -35% | 15% | $1,955,430.15 |
| WWI | West Wits Mining Ltd | 0.023 | -71% | -30% | -4% | 15% | $40,529,114.14 |
| VRC | Volt Resources Ltd | 0.0195 | -44% | -33% | 3% | 15% | $60,925,661.76 |
| STK | Strickland Metals | 0.063 | 43% | -11% | -6% | 15% | $76,866,880.02 |
| NXM | Nexus Minerals Ltd | 0.2 | 150% | -51% | -20% | 14% | $53,589,973.24 |
| IPT | Impact Minerals | 0.008 | -41% | -41% | -11% | 14% | $19,850,964.45 |
| SI6 | SI6 Metals Limited | 0.008 | -43% | -20% | 14% | 14% | $10,049,988.03 |
| RDS | Redstone Resources | 0.008 | -38% | -47% | 14% | 14% | $5,894,659.17 |
| NAG | Nagambie Resources | 0.056 | -37% | -7% | 6% | 14% | $28,736,184.85 |
| AQI | Alicanto Min Ltd | 0.074 | -54% | -36% | 14% | 14% | $28,011,094.04 |
| MRR | Minrex Resources Ltd | 0.035 | 67% | -47% | -19% | 13% | $34,984,849.71 |
| GRL | Godolphin Resources | 0.098 | -48% | -32% | -15% | 13% | $8,246,474.70 |
| DCX | Discovex Res Ltd | 0.0045 | -6% | -57% | -33% | 13% | $10,274,656.30 |
| SMS | Starmineralslimited | 0.09 | 0% | -57% | -57% | 13% | $2,362,500.00 |
| MHC | Manhattan Corp Ltd | 0.009 | -36% | -25% | -10% | 13% | $13,736,508.24 |
| KSN | Kingston Resources | 0.091 | -56% | -46% | -33% | 12% | $37,562,018.95 |
| CWX | Carawine Resources | 0.091 | -59% | -48% | -43% | 12% | $12,542,925.58 |
| G88 | Golden Mile Res Ltd | 0.032 | -47% | -32% | -35% | 12% | $6,111,978.42 |
| ALK | Alkane Resources Ltd | 0.695 | -42% | -20% | -28% | 12% | $399,040,891.40 |
| LCL | Los Cerros Limited | 0.0325 | -83% | -72% | -45% | 12% | $18,868,816.80 |
| A1G | African Gold Ltd. | 0.105 | -49% | -45% | -13% | 12% | $12,538,084.44 |
| BC8 | Black Cat Syndicate | 0.335 | -44% | -44% | -16% | 12% | $68,362,936.00 |
| AUT | Auteco Minerals | 0.048 | -52% | -34% | -6% | 12% | $93,028,597.56 |
| RGL | Riversgold | 0.029 | -11% | 78% | -24% | 12% | $21,934,903.97 |
| ADN | Andromeda Metals Ltd | 0.078 | -48% | -60% | -15% | 11% | $229,992,623.97 |
| AAR | Astral Resources NL | 0.078 | -4% | -35% | -7% | 11% | $46,501,980.64 |
| MZZ | Matador Mining Ltd | 0.15 | -69% | -57% | -6% | 11% | $32,627,925.75 |
| ICL | Iceni Gold | 0.1 | -47% | -43% | -20% | 11% | $12,563,249.94 |
| TAM | Tanami Gold NL | 0.05 | -33% | -19% | -7% | 11% | $58,754,852.30 |
| THR | Thor Mining PLC | 0.01 | -41% | -17% | -17% | 11% | $10,689,009.73 |
| RSG | Resolute Mining | 0.25 | -58% | -31% | -4% | 11% | $265,012,648.56 |
| SPQ | Superior Resources | 0.04 | 208% | -45% | 8% | 11% | $68,048,816.72 |
| ICG | Inca Minerals Ltd | 0.09 | -18% | -18% | -10% | 11% | $43,370,526.51 |
| TMZ | Thomson Res Ltd | 0.021 | -84% | -67% | -25% | 11% | $14,073,338.24 |
| LEX | Lefroy Exploration | 0.265 | -68% | -20% | -17% | 10% | $37,927,413.68 |
| FAU | First Au Ltd | 0.011 | -21% | 16% | -31% | 10% | $9,008,020.44 |
| WRM | White Rock Min Ltd | 0.11 | -79% | -54% | -15% | 10% | $19,103,605.84 |
| RMS | Ramelius Resources | 0.955 | -43% | -35% | -22% | 10% | $797,994,300.28 |
| SVL | Silver Mines Limited | 0.1425 | -48% | -30% | -23% | 10% | $174,397,339.31 |
| BNR | Bulletin Res Ltd | 0.115 | 78% | 44% | -23% | 10% | $33,647,976.50 |
| NML | Navarre Minerals Ltd | 0.047 | -51% | -40% | -22% | 9% | $64,626,041.30 |
| CBY | Canterbury Resources | 0.047 | -53% | -43% | -3% | 9% | $5,790,330.91 |
| MXR | Maximus Resources | 0.047 | -39% | -41% | -25% | 9% | $14,941,571.10 |
| SRN | Surefire Rescs NL | 0.024 | 71% | 118% | -20% | 9% | $37,952,723.45 |
| AMI | Aurelia Metals Ltd | 0.2775 | -39% | -34% | -13% | 9% | $334,005,243.39 |
| MKG | Mako Gold | 0.064 | -30% | -35% | -21% | 8% | $24,463,462.53 |
| WCN | White Cliff Min Ltd | 0.013 | 8% | -48% | -24% | 8% | $7,843,240.34 |
| CYL | Catalyst Metals | 1.305 | -35% | -33% | -7% | 8% | $128,485,273.14 |
| EM2 | Eagle Mountain | 0.2325 | -73% | -61% | -46% | 8% | $61,700,964.49 |
| PRX | Prodigy Gold NL | 0.014 | -67% | -59% | -22% | 8% | $8,156,786.48 |
| CAI | Calidus Resources | 0.64 | 27% | -8% | -19% | 8% | $256,227,903.54 |
| A8G | Australasian Metals | 0.215 | 48% | -63% | -40% | 8% | $8,439,951.27 |
| VAN | Vango Mining Ltd | 0.044 | -31% | -19% | -15% | 7% | $55,437,255.81 |
| ADV | Ardiden Ltd | 0.0075 | -6% | -38% | -25% | 7% | $18,678,347.49 |
| MEU | Marmota Limited | 0.06 | 30% | 43% | -6% | 7% | $56,844,716.33 |
| HMX | Hammer Metals Ltd | 0.048 | -47% | -11% | -16% | 7% | $38,323,547.28 |
| SAU | Southern Gold | 0.032 | -56% | -42% | -16% | 7% | $5,973,205.17 |
| SLR | Silver Lake Resource | 1.2875 | -26% | -24% | -17% | 6% | $1,170,105,000.41 |
| KTA | Krakatoa Resources | 0.05 | -12% | 0% | -32% | 6% | $16,546,076.02 |
| MI6 | Minerals260Limited | 0.25 | 0% | -55% | -42% | 6% | $53,900,000.00 |
| BGL | Bellevue Gold Ltd | 0.68 | -32% | -17% | -20% | 6% | $665,273,527.77 |
| CHN | Chalice Mining Ltd | 4.015 | -47% | -51% | -28% | 6% | $1,486,960,564.00 |
| MKR | Manuka Resources. | 0.18 | -40% | -41% | -14% | 6% | $21,859,180.42 |
| AGC | AGC Ltd | 0.074 | -47% | -24% | -13% | 6% | $5,011,819.02 |
| AGC | AGC Ltd | 0.074 | -47% | -24% | -13% | 6% | $5,011,819.02 |
| BCN | Beacon Minerals | 0.0285 | -16% | -8% | -8% | 6% | $101,961,174.67 |
| TBA | Tombola Gold Ltd | 0.038 | -5% | 31% | -33% | 6% | $33,433,738.59 |
| BTR | Brightstar Resources | 0.019 | -44% | -63% | -21% | 6% | $12,290,356.51 |
| AZS | Azure Minerals | 0.19 | -25% | -46% | -37% | 6% | $59,039,786.99 |
| BRB | Breaker Res NL | 0.195 | 15% | -30% | -7% | 5% | $63,538,981.16 |
| HMG | Hamelingoldlimited | 0.105 | 0% | -32% | -19% | 5% | $12,100,000.00 |
| HMG | Hamelingoldlimited | 0.105 | 0% | -32% | -19% | 5% | $12,100,000.00 |
| TSO | Tesoro Gold Ltd | 0.046 | -78% | -39% | -29% | 5% | $35,645,776.61 |
| TBR | Tribune Res Ltd | 4.02 | -20% | -15% | 3% | 4% | $215,119,115.70 |
| XAM | Xanadu Mines Ltd | 0.024 | -37% | -11% | -8% | 4% | $33,894,245.16 |
| RXL | Rox Resources | 0.25 | -45% | -26% | -22% | 4% | $41,390,532.02 |
| ENR | Encounter Resources | 0.125 | -19% | -22% | -17% | 4% | $41,238,187.38 |
| RXL | Rox Resources | 0.25 | -45% | -26% | -22% | 4% | $41,390,532.02 |
| ARL | Ardea Resources Ltd | 0.78 | 64% | 71% | -33% | 4% | $131,546,773.30 |
| ANX | Anax Metals Ltd | 0.08 | -1% | -2% | -12% | 4% | $30,827,740.16 |
| MVL | Marvel Gold Limited | 0.028 | -50% | -56% | -22% | 4% | $19,720,942.36 |
| POL | Polymetals Resources | 0.092 | -43% | -41% | -23% | 3% | $3,685,204.07 |
| NSM | Northstaw | 0.155 | -54% | -48% | -18% | 3% | $6,420,320.00 |
| KAU | Kaiser Reef | 0.155 | -41% | -23% | -23% | 3% | $20,125,310.67 |
| OZM | Ozaurum Resources | 0.155 | 24% | 19% | -14% | 3% | $10,805,980.00 |
| RVR | Red River Resources | 0.16 | -30% | -22% | -9% | 3% | $77,769,673.20 |
| DTR | Dateline Resources | 0.099 | 4% | 25% | -33% | 3% | $43,624,268.16 |
| HRZ | Horizon | 0.069 | -45% | -45% | -45% | 3% | $43,788,004.62 |
| EVN | Evolution Mining Ltd | 2.45 | -47% | -35% | -32% | 3% | $4,399,218,439.20 |
| CAZ | Cazaly Resources | 0.037 | -26% | -18% | -5% | 3% | $13,720,406.34 |
| TUL | Tulla Resources | 0.56 | 24% | 7% | -7% | 3% | $87,318,195.24 |
| MAT | Matsa Resources | 0.044 | -41% | -24% | -8% | 2% | $15,794,003.28 |
| SLZ | Sultan Resources Ltd | 0.096 | -48% | -44% | -34% | 2% | $8,328,438.90 |
| HAV | Havilah Resources | 0.245 | 11% | 44% | -8% | 2% | $77,566,806.45 |
| M24 | Mamba Exploration | 0.099 | -55% | -52% | -1% | 2% | $4,175,325.30 |
| MLS | Metals Australia | 0.051 | 28% | 28% | -27% | 2% | $27,265,737.17 |
| MEK | Meeka Gold Limited | 0.051 | -12% | 19% | -18% | 2% | $46,939,648.52 |
| NST | Northern Star | 6.975 | -31% | -23% | -18% | 2% | $8,074,324,718.46 |
| CMM | Capricorn Metals | 3.19 | 64% | -5% | -12% | 2% | $1,130,652,562.40 |
| KCC | Kincora Copper | 0.055 | -76% | -65% | -35% | 2% | $3,899,958.31 |
| IDA | Indiana Resources | 0.056 | -15% | -3% | 0% | 2% | $23,906,123.30 |
| KRM | Kingsrose Mining Ltd | 0.057 | 4% | -32% | -14% | 2% | $39,883,905.51 |
| IGO | IGO Limited | 10.1 | 23% | -14% | -15% | 2% | $7,315,207,073.58 |
| GMR | Golden Rim Resources | 0.065 | -46% | -54% | 5% | 2% | $20,718,284.14 |
| AWJ | Auric Mining | 0.065 | -57% | -41% | -31% | 2% | $3,644,508.21 |
| AGG | AngloGold Ashanti | 4.4 | -17% | -18% | -10% | 1% | $392,514,166.00 |
| PGD | Peregrine Gold | 0.39 | -5% | -35% | -15% | 1% | $13,783,200.84 |
| GSM | Golden State Mining | 0.0405 | -75% | -52% | -33% | 1% | $4,715,063.42 |
| SNG | Siren Gold | 0.2775 | 9% | 3% | -27% | 1% | $21,954,379.98 |
| AAJ | Aruma Resources Ltd | 0.0665 | 4% | -20% | -10% | 1% | $9,888,574.69 |
| PRU | Perseus Mining Ltd | 1.5925 | 0% | 3% | -17% | 0% | $2,147,441,451.75 |
| WGX | Westgold Resources. | 1.19 | -39% | -38% | -10% | 0% | $549,402,366.80 |
| NPM | Newpeak Metals | 0.001 | -50% | -50% | 0% | 0% | $8,853,750.03 |
| FFX | Firefinch Ltd | 0.2 | 49% | -32% | -38% | 0% | $236,248,644.20 |
| GED | Golden Deeps | 0.013 | 0% | 18% | -19% | 0% | $13,862,720.57 |
| NMR | Native Mineral Res | 0.16 | -39% | -32% | -14% | 0% | $7,060,550.40 |
| AQX | Alice Queen Ltd | 0.003 | -77% | -70% | -40% | 0% | $5,948,301.37 |
| PNX | PNX Metals Limited | 0.004 | -54% | -41% | -20% | 0% | $17,776,231.23 |
| YRL | Yandal Resources | 0.15 | -71% | -61% | -23% | 0% | $17,413,732.95 |
| PUA | Peak Minerals Ltd | 0.01 | -44% | -33% | -17% | 0% | $10,413,707.51 |
| RND | Rand Mining Ltd | 1.315 | -9% | -11% | -8% | 0% | $74,791,888.72 |
| MEI | Meteoric Resources | 0.011 | -80% | -39% | -21% | 0% | $17,552,419.77 |
| MCT | Metalicity Limited | 0.003 | -72% | -67% | -25% | 0% | $12,104,376.75 |
| CTO | Citigold Corp Ltd | 0.005 | -55% | -44% | -17% | 0% | $14,168,295.46 |
| TRY | Troy Resources Ltd | 0.037 | -14% | 0% | 0% | 0% | $32,223,563.33 |
| KGM | Kalnorth Gold Ltd | 0.013 | 0% | 0% | 0% | 0% | $11,625,120.78 |
| CGN | Crater Gold Min Ltd | 0.017 | 0% | 0% | 0% | 0% | $21,063,473.65 |
| TSC | Twenty Seven Co. Ltd | 0.003 | -33% | -25% | 0% | 0% | $7,982,441.72 |
| GUL | Gullewa Limited | 0.059 | -28% | -28% | -13% | 0% | $11,263,282.90 |
| G50 | Gold50Limited | 0.15 | 0% | -40% | -25% | 0% | $8,402,700.15 |
| MGV | Musgrave Minerals | 0.245 | -36% | -29% | -20% | 0% | $126,235,643.02 |
| VMC | Venus Metals Cor Ltd | 0.17 | -15% | 0% | -8% | 0% | $25,612,589.28 |
| NAE | New Age Exploration | 0.006 | -50% | -40% | -33% | 0% | $10,051,292.37 |
| VKA | Viking Mines Ltd | 0.006 | -65% | -60% | -25% | 0% | $7,176,809.02 |
| MTH | Mithril Resources | 0.005 | -71% | -67% | -29% | 0% | $14,651,165.21 |
| RML | Resolution Minerals | 0.008 | -69% | -53% | -11% | 0% | $7,491,465.72 |
| GMN | Gold Mountain Ltd | 0.005 | -83% | -67% | -17% | 0% | $5,965,745.85 |
| MEG | Megado Minerals Ltd | 0.08 | -41% | -5% | -33% | 0% | $8,723,903.84 |
| PF1 | Pathfinder Resources | 0.5 | 61% | 67% | 0% | 0% | $26,560,505.00 |
| ARV | Artemis Resources | 0.027 | -55% | -65% | -21% | 0% | $37,484,936.57 |
| QML | Qmines Limited | 0.165 | -54% | -50% | -25% | 0% | $10,976,077.04 |
| RDN | Raiden Resources Ltd | 0.008 | -72% | -60% | -20% | 0% | $11,339,537.06 |
| SFM | Santa Fe Minerals | 0.096 | 7% | -36% | -4% | 0% | $6,990,603.74 |
| MM8 | Medallion Metals. | 0.2 | -20% | -13% | -32% | 0% | $20,694,892.92 |
| BMO | Bastion Minerals | 0.145 | -22% | -41% | -3% | 0% | $11,009,742.70 |
| AVW | Avira Resources Ltd | 0.003 | -40% | -40% | -25% | 0% | $6,356,370.00 |
| ZAG | Zuleika Gold Ltd | 0.022 | -27% | 16% | -33% | 0% | $11,474,113.75 |
| GML | Gateway Mining | 0.008 | -60% | -43% | -27% | 0% | $20,340,957.30 |
| MBK | Metal Bank Ltd | 0.004 | -53% | -43% | -20% | 0% | $10,431,272.64 |
| TLM | Talisman Mining | 0.14 | -26% | -22% | -13% | 0% | $26,283,529.58 |
| OAU | Ora Gold Limited | 0.008 | -56% | -53% | -24% | 0% | $7,873,850.26 |
| GNM | Great Northern | 0.004 | -67% | -38% | -20% | 0% | $6,836,203.90 |
| TRM | Truscott Mining Corp | 0.048 | 33% | 45% | 0% | 0% | $7,293,194.11 |
| DLC | Delecta Limited | 0.011 | 83% | -8% | 0% | 0% | $13,253,995.76 |
| KNB | Koonenberrygold | 0.08 | 0% | -50% | -13% | 0% | $5,980,727.04 |
| E2M | E2 Metals | 0.13 | -65% | -55% | -21% | 0% | $25,887,201.99 |
| AYM | Australia United Min | 0.005 | -44% | -38% | -17% | 0% | $9,212,887.43 |
| DEG | De Grey Mining | 0.8 | -34% | -29% | -23% | -1% | $1,113,861,968.61 |
| GMD | Genesis Minerals | 1.255 | 80% | -28% | -15% | -1% | $301,421,406.97 |
| KCN | Kingsgate Consolid. | 1.315 | 61% | -29% | -17% | -1% | $287,716,588.90 |
| HCH | Hot Chili Ltd | 0.74 | -55% | -56% | -39% | -1% | $87,792,226.41 |
| CDR | Codrus Minerals Ltd | 0.065 | -66% | -52% | -30% | -2% | $2,640,000.00 |
| GOR | Gold Road Res Ltd | 1.1125 | -15% | -23% | -13% | -2% | $1,172,234,128.85 |
| GBZ | GBM Rsources Ltd | 0.06 | -52% | -48% | -35% | -2% | $29,806,922.56 |
| DRE | Dreadnought Resources Ltd | 0.046 | 53% | 12% | 21% | -2% | $130,579,443.35 |
| OGC | OceanaGold Corp. | 2.7 | 5% | 26% | -18% | -2% | $184,915,108.01 |
| BNZ | Benzmining | 0.43 | -52% | -34% | -32% | -2% | $22,543,538.19 |
| SSR | SSR Mining Inc. | 23.98 | 12% | 4% | -13% | -2% | $454,996,984.50 |
| GAL | Galileo Mining Ltd | 1.275 | 364% | 507% | -20% | -2% | $227,980,531.50 |
| CHZ | Chesser Resources | 0.082 | -34% | -34% | -14% | -2% | $48,226,095.02 |
| HAW | Hawthorn Resources | 0.081 | 72% | -19% | -26% | -2% | $27,014,764.65 |
| AAU | Antilles Gold Ltd | 0.0595 | -26% | -20% | -20% | -2% | $20,850,892.70 |
| OKR | Okapi Resources | 0.185 | -16% | -52% | -26% | -3% | $19,913,659.41 |
| LCY | Legacy Iron Ore | 0.0185 | 32% | -23% | -18% | -3% | $115,322,871.58 |
| PGO | Pacgold | 0.555 | 126% | 15% | -11% | -3% | $30,503,807.33 |
| WAF | West African Res Ltd | 1.1775 | 6% | -8% | -12% | -3% | $1,169,079,055.74 |
| ADT | Adriatic Metals | 1.895 | -25% | -24% | -20% | -3% | $385,814,625.46 |
| AGS | Alliance Resources | 0.17 | 16% | 12% | -3% | -3% | $40,123,349.51 |
| BRV | Big River Gold Ltd | 0.335 | -14% | 46% | -1% | -3% | $80,993,215.32 |
| SFR | Sandfire Resources | 4.32 | -33% | -37% | -26% | -3% | $1,717,824,131.67 |
| AM7 | Arcadia Minerals | 0.15 | -14% | -36% | -36% | -3% | $6,771,194.34 |
| CY5 | Cygnus Gold Limited | 0.15 | 30% | -14% | -12% | -3% | $17,697,797.25 |
| BYH | Bryah Resources Ltd | 0.029 | -52% | -41% | -31% | -3% | $6,560,008.08 |
| CST | Castile Resources | 0.14 | -38% | -30% | -18% | -3% | $29,956,518.15 |
| NWM | Norwest Minerals | 0.028 | -65% | -59% | -30% | -3% | $4,515,184.68 |
| OKU | Oklo Resources Ltd | 0.14 | 17% | 22% | -7% | -3% | $70,629,507.06 |
| ASR | Asra Minerals Ltd | 0.027 | 4% | 23% | -25% | -4% | $36,179,347.14 |
| S2R | S2 Resources | 0.13 | -4% | -35% | -28% | -4% | $49,892,479.70 |
| RDT | Red Dirt Metals Ltd | 0.385 | 141% | -49% | -15% | -4% | $115,730,681.88 |
| TG1 | Techgen Metals Ltd | 0.125 | -32% | -17% | -19% | -4% | $5,526,052.00 |
| NCM | Newcrest Mining | 19.81 | -24% | -18% | -17% | -5% | $17,639,184,128.25 |
| BMR | Ballymore Resources | 0.18 | 0% | 0% | -8% | -5% | $13,960,835.39 |
| ERM | Emmerson Resources | 0.09 | 22% | -40% | -9% | -5% | $49,023,880.92 |
| PNR | Pantoro Limited | 0.18 | -16% | -48% | -38% | -5% | $291,383,301.14 |
| BGD | Bartongoldholdings | 0.18 | -12% | -18% | -18% | -5% | $15,472,660.14 |
| CEL | Challenger Exp Ltd | 0.175 | -41% | -44% | -24% | -5% | $174,711,308.60 |
| HRN | Horizon Gold Ltd | 0.33 | -24% | -21% | -13% | -6% | $40,822,662.87 |
| MAU | Magnetic Resources | 1.165 | -25% | -22% | -10% | -6% | $266,967,954.61 |
| BEZ | Besragoldinc | 0.044 | 0% | -60% | -35% | -6% | $7,733,248.20 |
| TCG | Turaco Gold Limited | 0.054 | -51% | -55% | -36% | -7% | $23,096,700.13 |
| MTC | Metalstech Ltd | 0.335 | 80% | 5% | -16% | -7% | $55,832,637.65 |
| RED | Red 5 Limited | 0.2325 | 26% | -17% | -39% | -7% | $542,057,730.20 |
| REZ | Resourc & En Grp Ltd | 0.026 | -10% | -59% | 4% | -7% | $11,995,338.94 |
| LRL | Labyrinth Resources | 0.019 | -56% | -46% | -30% | -7% | $16,593,968.35 |
| MDI | Middle Island Res | 0.125 | 0% | 14% | -24% | -7% | $14,690,186.64 |
| TTM | Titan Minerals | 0.057 | -50% | -43% | -30% | -8% | $86,023,452.51 |
| SKY | SKY Metals Ltd | 0.055 | -48% | -48% | -37% | -8% | $20,723,090.85 |
| WMC | Wiluna Mining Corp | 0.215 | -74% | -78% | -55% | -9% | $79,670,081.70 |
| AME | Alto Metals Limited | 0.063 | -32% | -32% | -18% | -10% | $32,738,325.74 |
| FML | Focus Minerals Ltd | 0.135 | -49% | -58% | -25% | -10% | $38,685,417.08 |
| PDI | Predictive Disc Ltd | 0.18 | 80% | -28% | -5% | -10% | $287,663,351.04 |
| GCY | Gascoyne Res Ltd | 0.22 | -33% | -23% | -15% | -10% | $100,118,284.69 |
| GCY | Gascoyne Res Ltd | 0.22 | -33% | -23% | -15% | -10% | $100,118,284.69 |
| ZNC | Zenith Minerals Ltd | 0.25 | -7% | -14% | -32% | -11% | $86,190,569.75 |
| AUC | Ausgold Limited | 0.041 | -7% | -13% | -29% | -11% | $85,237,930.72 |
| TMX | Terrain Minerals | 0.008 | -20% | 14% | -20% | -11% | $6,846,849.08 |
| AWV | Anova Metals Ltd | 0.008 | -60% | -58% | -33% | -11% | $11,984,753.60 |
| X64 | Ten Sixty Four Ltd | 0.61 | -32% | -14% | -16% | -12% | $137,913,562.11 |
| LYN | Lycaonresources | 0.265 | 0% | -40% | -45% | -12% | $7,979,687.50 |
| LM8 | Lunnonmetalslimited | 0.695 | 51% | 45% | -13% | -12% | $74,715,766.36 |
| SMI | Santana Minerals Ltd | 0.59 | 528% | 84% | -32% | -13% | $77,592,813.48 |
| PNT | Panthermetalsltd | 0.2 | 0% | 0% | 5% | -13% | $5,220,000.00 |
| DGO | DGO Gold Limited | 2.41 | -21% | -9% | -19% | -13% | $202,181,472.07 |
| GSN | Great Southern | 0.034 | -32% | -45% | -11% | -14% | $18,100,480.92 |
| EMR | Emerald Res NL | 0.945 | 8% | -17% | -23% | -14% | $569,616,943.68 |
| DEX | Duke Exploration | 0.062 | -83% | -64% | -38% | -15% | $6,946,258.70 |
| PNM | Pacific Nickel Mines | 0.07 | 19% | -14% | -11% | -16% | $18,989,309.92 |
| MRZ | Mont Royal Resources | 0.285 | 12% | -14% | -7% | -16% | $19,105,246.04 |
| SVY | Stavely Minerals Ltd | 0.165 | -62% | -68% | -48% | -18% | $41,753,832.32 |
| AOP | Apollo Consolidated | 0 | -100% | -100% | -100% | -100% | $177,888,559.90 |
| TRN | Torrens Mining | 0 | -100% | -100% | -100% | -100% | $9,218,941.94 |
| KLA | Kirkland Lake Gold | 0 | -100% | -100% | -100% | -100% | $52,690,000.00 |
| BDC | Bardoc Gold Ltd | 0 | -100% | -100% | -100% | -100% | $154,075,451.40 |
SMALL CAP STANDOUTS
Sihayo owns the Sihayo gold project in Indonesia, where it already has a feasibility study prepared despite its minnow status, and a strategic review process in train with CLSA looking for a potential funding partner for the proposed mine.
Earlier this week the $15m market cap company said its recent high pH (caustic) pre-leaching test work program has the potential to increase overall recoveries of the Sihayo Starter Project from 71.2% to greater than 80%.
Results indicate an uplift in recoveries of between 8% and 61% for transition mineralisation and between 21% and 74% for fresh mineralisation at the Sihayo Starter Project.
The company plans to incorporate these results into an update of the Ore Reserve and feasibility assessment of the project.
Notably, at US$1700/oz gold prices, Sihayo would deliver 551,000oz over its 6.5-year life, but with a capital cost of US$173 million and IRR of just 10.1%, some more exploration may be prudent.
This week the company picked up the 1,609km2 Mt Piper Gold Project from Coda Minerals (ASX: COD),which is adjacent to Agnico Eagle Mine’s (NYSE:AEM) large exploration land tenure and 30km from its the Fosterville gold mine in Central Victoria.
The project is also between Mandalay Resources’ (TSX: MND) high-grade Costerfield gold-antimony mine and the Sunday Creek Project owned by Southern Cross Gold (ASX:SXG) which recently announced significant drilling intersections including 119.2m at 3.2g/t gold.
The plan is to design an initial “low impact” exploration program for high priority target areas.
KZR is a ~$33.4m market cap company with ~$4.27m cash in the bank at the end of the March quarter.
The copper-gold explorer hit a highlight 611.4m-long intersection at 1.39% copper and 0.75g/t gold in drilling at the flagship MCB project in the Philippines this week.
This includes a 77.5m-long high-grade portion grading 2.47% copper and 2.12g/t gold (3.34% copper equivalent) from 232.10m.
This hole (MCB-038) was designed to improve confidence in the existing 1.5 million tonnes copper and 1.47 million ounces gold resource, in addition to defining further higher-grade areas to enhance the upcoming feasibility study.
A Scoping Study for the project announced December 2021 eyed the development of an underground copper-gold operation with a 25-year mine life.
Highlights from the scoping study includes a post-tax NPV (8%) of US$464m and IRR of 35%, assuming a copper price of US$4.00/lb and gold price of US$1,695/oz.
Initial capital expenditure was estimated to be US$253m with a payback period of ~2.7 years.
The $34m market cap stock had $3.5m in the bank at the end of March.
SIH, KZR and CLA share prices today:
Related Topics

Related Stories


UNLOCK INSIGHTS
Discover the untold stories of emerging ASX stocks.
Daily news and expert analysis, it's free to subscribe.
By proceeding, you confirm you understand that we handle personal information in accordance with our Privacy Policy.


