Gold Digger: Gold’s renaissance was short-lived. Have prices bottomed out?

Pic: Carol Yepes/ Moment/ Getty Images
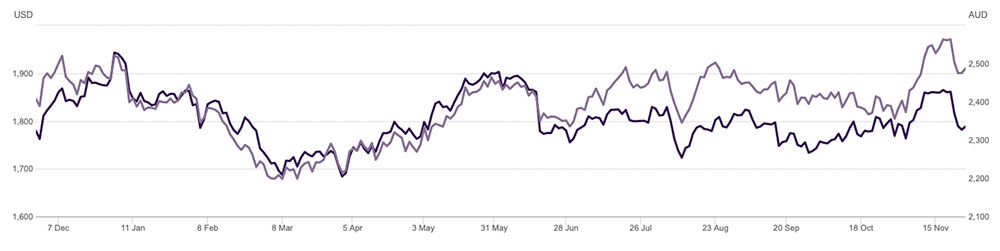
Following a 7.6% surge from late September, the price of gold briefly hit five-month highs of ~$US1,872/oz on fears that current high inflation levels are more than ‘transitional’.
Gold is an ‘inflation hedge’; an investment that ostensibly protects the buyer from decreased purchasing power of a currency due to rising prices.
Which is happening right now, everywhere.
Any jubilation from gold bugs was short-lived however, with the reappointment of Jerome Powell as chair of the US Federal Reserve sending gold crashing back to $US1,785/oz. Ouch.
Why? The market believes that Powell will begin raising interest rates – the cost to borrow money — sooner than if competitor for the job Lael Brainard had been given the chair. Earlier rate hikes dampen inflation expectations.
Brainard, who was appointed vice chair, will still have significant influence.
Former geologist and experienced stockbroker Guy Le Page says it is clear that the broader market is not convinced that gold’s short to medium term price outlook is positive with Swap Dealer Net positions still in decline.
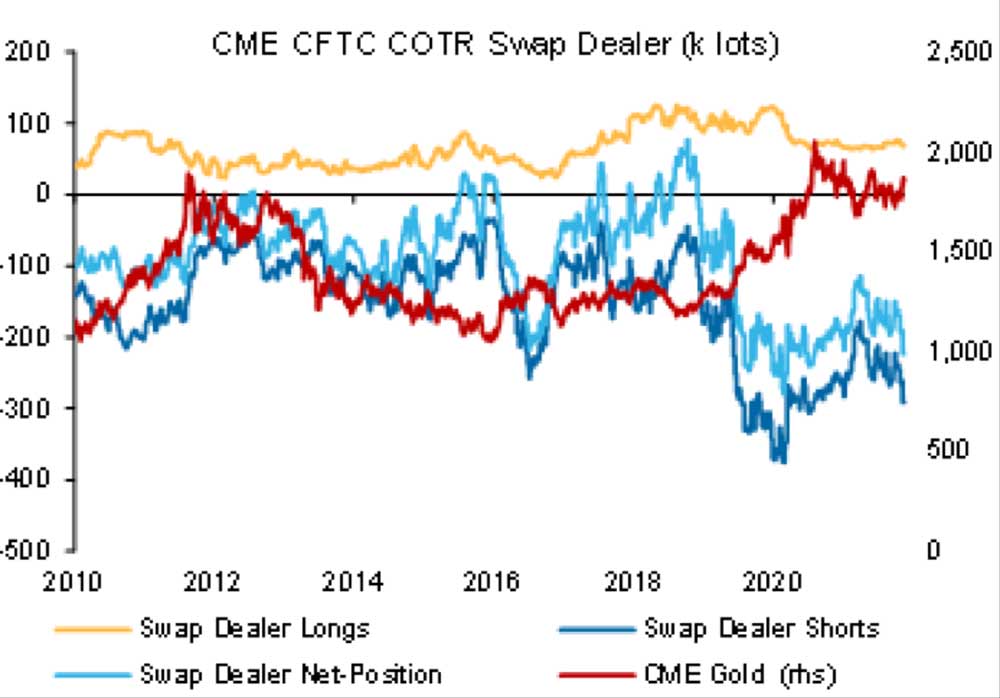
A ‘swap’ is basically a forward contract or a futures contract, he says.
If the position is net long, then it implies that there are more forward contracts (or calls) betting gold will go up. A net short position is basically selling a call, or a futures contract with a view of buying back after gold has fallen.
“So, in this case, even with gold rising, it appears that the long and short positions were closely balanced with probably slightly more short positions in play — i.e., the majority of positions were betting on a decline in the gold price,” he says.
Le Page still reckons “Jerome ‘money printer’ Powell” is good for gold in the long term.
“Given Powell has the US economy sailing on an easy monetary trajectory straight into the eye of an inflation hurricane (already at 6.2%, a 31-year high), I think his appointment will ultimately be good for gold,” he says.
Hang tight, gold bugs.
Winners & Losers
Here’s how ASX-listed gold & silver stocks are performing:
Scroll or swipe to reveal table. Click headings to sort. Best viewed on a laptop
>>> Stocks missing from this list? Email [email protected]
| CODE | COMPANY | 1 WEEK RETURN % | 1 MONTH RETURN % | 6 MONTH RETURN % | 1 YEAR RETURN % | SHARE PRICE [INTRADAY FRI] | MARKET CAP |
|---|---|---|---|---|---|---|---|
| E2M | E2 Metals | 46 | 49 | 3 | -55 | 0.35 | $ 54,169,636.68 |
| WCN | White Cliff Minerals | 38 | 20 | 20 | -44 | 0.018 | $ 8,275,142.38 |
| SFM | Santa Fe Minerals | 35 | 50 | 32 | 9 | 0.12 | $ 8,738,254.68 |
| KNB | Koonenberry Gold | 29 | 0 | 0.18 | $ 12,970,339.90 | ||
| MLS | Metals Australia | 25 | 25 | 25 | 25 | 0.0025 | $ 13,096,393.40 |
| KWR | Kingwest Resources | 24 | 74 | 147 | 47 | 0.235 | $ 50,738,210.25 |
| SRN | Surefire Resources | 20 | -20 | -52 | -61 | 0.012 | $ 13,251,724.91 |
| KRM | Kingsrose Mining | 20 | 55 | 49 | 150 | 0.085 | $ 63,510,639.62 |
| SMI | Santana Minerals | 16 | 34 | 191 | 76 | 0.335 | $ 43,770,305.04 |
| BMR | Ballymore Resources | 15 | -8 | 0 | 0 | 0.23 | $ 15,367,787.42 |
| WWI | West Wits Mining | 15 | -16 | -56 | -51 | 0.036 | $ 58,177,676.13 |
| MDI | Middle Island Res | 14 | 0 | -5 | -65 | 0.105 | $ 12,853,913.31 |
| XTC | Xantippe Res | 13 | 13 | 125 | 125 | 0.0045 | $ 25,478,527.51 |
| SIH | Sihayo Gold Limited | 13 | -10 | -36 | -53 | 0.009 | $ 33,169,152.72 |
| GSR | Greenstone Resources | 11 | 15 | 50 | -3 | 0.03 | $ 23,405,281.98 |
| MKG | Mako Gold | 10 | 10 | 18 | 5 | 0.11 | $ 40,135,368.21 |
| BBX | BBX Minerals | 10 | -8 | -38 | -51 | 0.165 | $ 73,283,436.00 |
| SBR | Sabre Resources | 10 | 10 | 10 | -54 | 0.0055 | $ 9,291,225.07 |
| MHC | Manhattan Corp | 10 | 0 | -15 | -62 | 0.011 | $ 15,262,786.93 |
| MEG | Megado | 10 | 0 | -39 | -41 | 0.1 | $ 4,304,879.80 |
| HRN | Horizon Gold | 10 | -13 | -25 | -3 | 0.4 | $ 42,676,806.40 |
| NWM | Norwest Minerals | 9 | -1 | -15 | -11 | 0.081 | $ 15,171,011.10 |
| RDT | Red Dirt Metals | 9 | 2 | 370 | 131 | 0.705 | $ 182,119,334.93 |
| FG1 | Flynngold | 9 | 27 | 0.19 | $ 12,052,849.50 | ||
| M24 | Mamba Exploration | 7 | 5 | -6 | 0.22 | $ 8,140,000.00 | |
| CAZ | Cazaly Resources | 7 | 2 | -16 | 0 | 0.046 | $ 15,891,220.48 |
| IDA | Indiana Resources | 7 | 12 | -14 | -6 | 0.065 | $ 28,239,052.40 |
| ARL | Ardea Resources | 6 | 5 | 9 | 21 | 0.5 | $ 71,777,793.88 |
| AGS | Alliance Resources | 6 | -13 | 0 | 1 | 0.17 | $ 35,362,912.78 |
| QML | Qmines Limited | 5 | 3 | -1 | 0.39 | $ 21,188,038.56 | |
| CMM | Capricorn Metals | 5 | 17 | 68 | 79 | 2.99 | $ 1,084,994,918.69 |
| BNR | Bulletin Res | 5 | 7 | 18 | 12 | 0.08 | $ 21,307,663.74 |
| VAN | Vango Mining | 5 | 0 | -11 | -14 | 0.062 | $ 78,116,133.18 |
| BGD | Bartongoldholdings | 5 | 24 | 0.21 | $ 18,455,599.14 | ||
| S2R | S2 Resources | 5 | 139 | 31 | -21 | 0.21 | $ 78,402,468.10 |
| OKR | Okapi Resources | 4 | -17 | 133 | 188 | 0.49 | $ 54,885,745.74 |
| ADV | Ardiden | 4 | 14 | 14 | -40 | 0.0125 | $ 25,840,024.27 |
| BTR | Brightstar Resources | 4 | 2 | 59 | -7 | 0.051 | $ 28,967,865.03 |
| PGD | Peregrine Gold | 4 | 0 | 14 | 0.395 | $ 13,271,524.03 | |
| GBR | Greatbould Resources | 4 | -20 | 27 | 166 | 0.14 | $ 51,799,192.31 |
| HRZ | Horizon | 4 | 8 | 17 | 27 | 0.14 | $ 79,516,528.00 |
| CDT | Castle Minerals | 4 | 45 | 81 | 142 | 0.029 | $ 24,621,650.23 |
| SKY | SKY Metals | 4 | -11 | -48 | -54 | 0.088 | $ 33,156,945.36 |
| VRC | Volt Resources | 3 | -3 | -25 | 200 | 0.03 | $ 76,785,537.50 |
| POL | Polymetals Resources | 3 | 15 | 0.15 | $ 5,911,405.20 | ||
| CYL | Catalyst Metals | 3 | 4 | 3 | -14 | 2.17 | $ 213,648,918.91 |
| GML | Gateway Mining | 3 | -6 | -29 | -35 | 0.017 | $ 38,089,182.91 |
| ADN | Andromeda Metals | 3 | -5 | -17 | -40 | 0.175 | $ 397,396,327.36 |
| PUR | Pursuit Minerals | 3 | 4 | -46 | 157 | 0.036 | $ 31,858,473.14 |
| CY5 | Cygnus Gold Limited | 3 | 33 | 20 | -8 | 0.18 | $ 20,953,432.98 |
| RML | Resolution Minerals | 3 | -12 | -26 | -53 | 0.0185 | $ 12,142,782.08 |
| M2R | Miramar | 3 | 5 | 5 | -29 | 0.205 | $ 10,212,079.10 |
| DTR | Dateline Resources | 2 | -1 | 19 | 137 | 0.089 | $ 38,975,926.20 |
| SFR | Sandfire Resources | 2 | 9 | -6 | 48 | 6.17 | $ 2,586,985,744.83 |
| SVY | Stavely Minerals | 2 | 19 | -16 | -39 | 0.525 | $ 139,614,376.82 |
| MOH | Moho Resources | 2 | 0 | -29 | -43 | 0.06 | $ 7,546,524.12 |
| STK | Strickland Metals | 1 | -20 | 184 | -17 | 0.071 | $ 96,369,942.36 |
| EMR | Emerald Res NL | 1 | 9 | 18 | 88 | 1.1 | $ 559,205,969.60 |
| NAG | Nagambie Resources | 1 | 8 | 23 | 62 | 0.081 | $ 37,494,925.95 |
| BNZ | Benzmining | 0 | -9 | -10 | 0.6725 | $ 34,440,673.91 | |
| ZNC | Zenith Minerals | 0 | -6 | -15 | 104 | 0.235 | $ 76,093,976.43 |
| TRM | Truscott Mining Corp | 0 | -9 | 3 | 52 | 0.032 | $ 5,317,954.04 |
| PF1 | Pathfinder Resources | 0 | -12 | -12 | 46 | 0.285 | $ 16,467,513.10 |
| NMR | Native Mineral Res | 0 | -3 | -11 | 14 | 0.25 | $ 8,316,366.00 |
| AYM | Australia United Min | 0 | 0 | 11 | 11 | 0.01 | $ 18,425,774.85 |
| SI6 | SI6 Metals Limited | 0 | -15 | 0 | 10 | 0.011 | $ 15,709,583.84 |
| PKO | Peako Limited | 0 | 9 | -38 | 4 | 0.025 | $ 7,711,352.53 |
| AQI | Alicanto Min | 0 | 0 | 21 | 4 | 0.145 | $ 55,493,474.47 |
| SMS | Starmineralslimited | 0 | 0.175 | $ 4,593,750.00 | |||
| AM7 | Arcadia Minerals | 0 | 13 | 0.22 | $ 7,011,000.00 | ||
| AWJ | Auric Mining | 0 | -7 | -18 | 0.135 | $ 7,569,363.20 | |
| OZM | Ozaurum Resources | 0 | -9 | -19 | 0.15 | $ 8,582,400.00 | |
| KGM | Kalnorth Gold | 0 | 0 | 0 | 0 | 0.013 | $ 11,625,120.78 |
| LNY | Laneway Res | 0 | 20 | 20 | 0 | 0.006 | $ 23,424,395.60 |
| G50 | Gold50Limited | 0 | 13 | 0.27 | $ 14,089,040.28 | ||
| LM8 | Lunnonmetalslimited | 0 | -9 | 0.36 | $ 27,193,055.38 | ||
| NAE | New Age Exploration | 0 | 0 | -31 | -4 | 0.011 | $ 15,794,888.01 |
| RDN | Raiden Resources | 0 | -4 | 4 | -8 | 0.024 | $ 34,383,182.60 |
| PNX | PNX Metals Limited | 0 | -7 | -13 | -13 | 0.007 | $ 23,739,257.82 |
| GED | Golden Deeps | 0 | -8 | 9 | -14 | 0.012 | $ 9,310,217.28 |
| MBK | Metal Bank | 0 | -6 | -6 | -14 | 0.009 | $ 10,701,614.74 |
| KTA | Krakatoa Resources | 0 | -5 | -2 | -15 | 0.057 | $ 16,798,465.27 |
| DCX | Discovex Res | 0 | 0 | -17 | -17 | 0.005 | $ 11,558,988.34 |
| CGN | Crater Gold Min | 0 | 0 | 6 | -19 | 0.017 | $ 20,867,429.74 |
| CTO | Citigold Corp | 0 | 0 | -9 | -23 | 0.01 | $ 28,336,590.91 |
| GUL | Gullewa Limited | 0 | -1 | -8 | -24 | 0.08 | $ 15,229,848.00 |
| TSC | Twenty Seven Co. | 0 | -25 | -10 | -25 | 0.0045 | $ 11,973,662.57 |
| WRM | White Rock Min | 0 | -6 | -45 | -25 | 0.31 | $ 44,164,389.32 |
| ALY | Alchemy Resource | 0 | 0 | -17 | -26 | 0.013 | $ 12,380,483.57 |
| OAU | Ora Gold Limited | 0 | 6 | -26 | -26 | 0.016 | $ 13,473,523.55 |
| BAT | Battery Minerals | 0 | 7 | -21 | -29 | 0.015 | $ 29,444,835.46 |
| SNG | Siren Gold | 0 | -5 | 30 | -30 | 0.37 | $ 30,296,536.29 |
| AAR | Anglo Australian | 0 | 5 | -5 | -33 | 0.09 | $ 54,848,489.99 |
| GWR | GWR Group | 0 | -32 | -56 | -34 | 0.105 | $ 31,792,576.52 |
| GRL | Godolphin Resources | 0 | 0 | -15 | -42 | 0.145 | $ 12,196,134.30 |
| TRY | Troy Resources | 0 | 0 | -21 | -56 | 0.037 | $ 30,073,993.35 |
| AQX | Alice Queen | 0 | 0 | -29 | -66 | 0.01 | $ 13,702,230.10 |
| DGO | DGO Gold Limited | -1 | 2 | -16 | -2 | 2.95 | $ 247,497,890.31 |
| PRS | Prospech Limited | -1 | -4 | -47 | 0 | 0.074 | $ 4,823,394.37 |
| LEX | Lefroy Exploration | -1 | -19 | -70 | 73 | 0.355 | $ 47,391,795.78 |
| SAU | Southern Gold | -2 | -12 | -12 | -34 | 0.065 | $ 13,866,369.14 |
| KAI | Kairos Minerals | -2 | -5 | -14 | -21 | 0.0285 | $ 48,758,894.60 |
| TBR | Tribune Res | -2 | 0 | -2 | -21 | 4.95 | $ 259,716,981.15 |
| GSM | Golden State Mining | -2 | -7 | -27 | -60 | 0.098 | $ 8,308,798.50 |
| DTM | Dart Mining NL | -2 | -17 | -32 | -46 | 0.095 | $ 11,826,638.35 |
| AMI | Aurelia Metals | -3 | -3 | -4 | -4 | 0.39 | $ 481,841,589.84 |
| CWX | Carawine Resources | -3 | -12 | -25 | -28 | 0.19 | $ 25,861,303.37 |
| AAU | Antilles Gold | -3 | -6 | 9 | 29 | 0.074 | $ 22,496,367.11 |
| PRX | Prodigy Gold NL | -3 | 3 | -31 | -32 | 0.036 | $ 20,974,593.82 |
| PAK | Pacific American Hld | -3 | 3 | -6 | -22 | 0.0175 | $ 8,123,915.83 |
| TBA | Tombola Gold | -3 | -21 | -30 | -15 | 0.033 | $ 23,948,903.55 |
| PUA | Peak Minerals | -3 | -13 | -13 | -28 | 0.0165 | $ 14,276,841.92 |
| PNR | Pantoro Limited | -3 | 52 | 31 | 64 | 0.32 | $ 479,229,557.32 |
| NSM | Northstaw | -3 | 7 | -9 | -28 | 0.32 | $ 12,840,640.00 |
| KCN | Kingsgate Consolid. | -3 | -13 | 55 | 112 | 1.42 | $ 312,061,838.73 |
| BCN | Beacon Minerals | -3 | -2 | -13 | -3 | 0.0315 | $ 113,124,689.75 |
| EM2 | Eagle Mountain | -3 | -21 | -44 | 72 | 0.575 | $ 126,281,421.20 |
| XAM | Xanadu Mines | -4 | 0 | -55 | -27 | 0.027 | $ 36,512,094.75 |
| MAT | Matsa Resources | -4 | -8 | -31 | -53 | 0.054 | $ 20,772,967.96 |
| FFX | Firefinch | -4 | 7 | 72 | 368 | 0.655 | $ 605,217,980.90 |
| AUT | Auteco Minerals | -4 | -6 | -21 | -17 | 0.076 | $ 129,989,778.07 |
| AZS | Azure Minerals | -4 | 4 | 47 | -54 | 0.375 | $ 117,699,573.98 |
| HAW | Hawthorn Resources | -4 | 92 | 100 | -4 | 0.096 | $ 36,686,717.43 |
| OBM | Ora Banda Mining | -4 | -23 | -65 | -74 | 0.075 | $ 74,041,062.38 |
| NCM | Newcrest Mining | -4 | -5 | -15 | -9 | 24.01 | $ 19,688,253,175.97 |
| WMC | Wiluna Mining Corp | -4 | 6 | -1 | -20 | 1.1025 | $ 174,938,014.23 |
| TAM | Tanami Gold NL | -4 | -3 | -4 | -5 | 0.069 | $ 81,081,696.17 |
| TNR | Torian Resources | -4 | -18 | -47 | -32 | 0.023 | $ 25,019,529.08 |
| DEG | De Grey Mining | -4 | 9 | -21 | 28 | 1.24 | $ 1,758,029,406.25 |
| MEU | Marmota Limited | -4 | -2 | -2 | 5 | 0.043 | $ 43,123,577.90 |
| BDC | Bardoc Gold | -4 | -7 | -12 | -12 | 0.064 | $ 111,152,472.06 |
| ARV | Artemis Resources | -4 | -15 | 42 | -29 | 0.085 | $ 105,419,802.68 |
| A1G | African Gold . | -5 | -2 | -11 | 62 | 0.205 | $ 24,376,617.24 |
| KAU | Kaiser Reef | -5 | -7 | -31 | -49 | 0.205 | $ 26,320,453.51 |
| AWV | Anova Metals | -5 | -17 | 0 | -26 | 0.02 | $ 28,661,884.00 |
| RGL | Riversgold | -5 | -20 | -52 | -51 | 0.02 | $ 8,080,843.92 |
| ZAG | Zuleika Gold | -5 | -9 | -47 | -67 | 0.02 | $ 9,432,147.58 |
| TSO | Tesoro Resources | -5 | -25 | -54 | -72 | 0.079 | $ 43,608,543.52 |
| FML | Focus Minerals | -5 | 4 | 2 | -18 | 0.295 | $ 53,910,826.68 |
| RND | Rand Mining | -5 | -7 | -2 | -26 | 1.455 | $ 82,754,523.26 |
| AOP | Apollo Consolidated | -5 | 5 | 102 | 119 | 0.625 | $ 183,720,971.70 |
| VKA | Viking Mines | -5 | -5 | -34 | 4 | 0.019 | $ 19,403,910.19 |
| ERM | Emmerson Resources | -5 | 10 | -5 | 0 | 0.076 | $ 37,866,125.16 |
| IVR | Investigator Res | -5 | -3 | -17 | 32 | 0.074 | $ 97,972,048.92 |
| TRN | Torrens Mining | -5 | -19 | -14 | 0.1375 | $ 10,449,740.70 | |
| NML | Navarre Minerals | -5 | -20 | -42 | -61 | 0.073 | $ 89,108,006.70 |
| TLM | Talisman Mining | -5 | 24 | -20 | 50 | 0.18 | $ 32,854,411.98 |
| RED | Red 5 Limited | -5 | 0 | 69 | 20 | 0.27 | $ 647,999,179.30 |
| GMN | Gold Mountain | -5 | -14 | -55 | -53 | 0.018 | $ 19,262,685.06 |
| MKR | Manuka Resources. | -5 | -9 | -7 | -18 | 0.355 | $ 36,029,327.37 |
| STN | Saturn Metals | -5 | 22 | 30 | -25 | 0.52 | $ 61,064,555.40 |
| MEI | Meteoric Resources | -6 | -23 | -72 | -72 | 0.017 | $ 25,590,101.93 |
| TMZ | Thomson Res | -6 | -25 | -50 | -17 | 0.067 | $ 38,325,040.39 |
| SSR | SSR Mining Inc. | -6 | 18 | 6 | 7 | 25.38 | $ 524,736,215.08 |
| HMG | Hamelingoldlimited | -6 | 0.16 | $ 18,150,000.00 | |||
| HMG | Hamelingoldlimited | -6 | 0.16 | $ 18,150,000.00 | |||
| AUC | Ausgold Limited | -6 | 4 | 0 | -4 | 0.048 | $ 74,511,428.43 |
| ARN | Aldoro Resources | -6 | 6 | 45 | 203 | 0.47 | $ 40,455,683.00 |
| CBY | Canterbury Resources | -6 | -4 | 0 | -3 | 0.094 | $ 11,298,661.82 |
| G88 | Golden Mile Res | -6 | -6 | -20 | -11 | 0.047 | $ 7,866,843.09 |
| MVL | Marvel Gold Limited | -6 | 10 | 47 | 37 | 0.078 | $ 40,498,363.75 |
| MAU | Magnetic Resources | -6 | -6 | 8 | 36 | 1.56 | $ 331,623,704.80 |
| CAI | Calidus Resources | -6 | 2 | 49 | 16 | 0.61 | $ 252,061,958.61 |
| RDS | Redstone Resources | -6 | 15 | -12 | 7 | 0.015 | $ 10,784,985.95 |
| THR | Thor Mining PLC | -6 | -17 | -12 | -21 | 0.015 | $ 9,354,185.78 |
| OKU | Oklo Resources | -6 | 11 | 11 | -23 | 0.15 | $ 75,604,471.80 |
| BRV | Big River Gold | -6 | -6 | -44 | -44 | 0.225 | $ 52,666,188.48 |
| RXL | Rox Resources | -6 | -1 | -29 | -50 | 0.375 | $ 59,102,855.25 |
| AGG | AngloGold Ashanti | -6 | 3 | -19 | -7 | 5.31 | $ 496,887,251.05 |
| ENR | Encounter Resources | -6 | -27 | -18 | -8 | 0.145 | $ 49,097,261.07 |
| SVL | Silver Mines Limited | -7 | -2 | -25 | 16 | 0.215 | $ 271,284,750.03 |
| TIE | Tietto Minerals | -7 | -5 | 20 | 12 | 0.415 | $ 194,826,244.62 |
| MRZ | Mont Royal Resources | -7 | -14 | 6 | 6 | 0.345 | $ 12,878,083.10 |
| CHN | Chalice Mining | -7 | 37 | 16 | 151 | 9.47 | $ 3,340,466,037.40 |
| MTC | Metalstech | -7 | -36 | 149 | 74 | 0.27 | $ 42,499,470.45 |
| CXU | Cauldron Energy | -7 | -4 | -33 | -18 | 0.027 | $ 13,264,928.01 |
| CLA | Celsius Resource | -7 | -7 | -36 | -31 | 0.027 | $ 27,227,930.11 |
| KLA | Kirkland Lake Gold | -7 | -7 | 2 | 2 | 56.78 | $ 56,870,000.00 |
| MXR | Maximus Resources | -7 | -27 | -23 | -52 | 0.065 | $ 21,615,026.18 |
| BMO | Bastion Minerals | -7 | -4 | 31 | 0.255 | $ 17,592,043.70 | |
| WGX | Westgold Resources. | -7 | 0 | -9 | -5 | 2.03 | $ 880,777,063.62 |
| GSN | Great Southern | -7 | -11 | 17 | -17 | 0.063 | $ 31,859,126.46 |
| NST | Northern Star | -7 | 1 | -14 | -22 | 9.71 | $ 11,401,543,638.21 |
| CPM | Coopermetalslimited | -8 | 0.185 | $ 5,268,900.00 | |||
| HCH | Hot Chili | -8 | -17 | 15 | -16 | 2.07 | $ 179,476,372.50 |
| PNM | Pacific Nickel Mines | -8 | -19 | 87 | 76 | 0.097 | $ 23,277,264.71 |
| MML | Medusa Mining | -8 | 6 | -2 | 11 | 0.785 | $ 163,180,541.29 |
| GBZ | GBM Rsources | -8 | -14 | -8 | -14 | 0.12 | $ 60,817,116.84 |
| MZZ | Matador Mining | -8 | -13 | -10 | 9 | 0.355 | $ 77,244,838.92 |
| MTH | Mithril Resources | -8 | 17 | 9 | -30 | 0.0175 | $ 43,863,961.70 |
| KZR | Kalamazoo Resources | -8 | -8 | -21 | -38 | 0.35 | $ 47,107,001.90 |
| EMU | EMU NL | -8 | -23 | -47 | -49 | 0.023 | $ 12,645,733.13 |
| BC8 | Black Cat Syndicate | -8 | -2 | -23 | -12 | 0.57 | $ 80,260,452.27 |
| RVR | Red River Resources | -8 | -12 | -10 | -25 | 0.1975 | $ 103,692,897.60 |
| ADT | Adriatic Metals | -8 | -10 | 1 | 18 | 2.57 | $ 619,039,995.98 |
| EVN | Evolution Mining | -8 | 6 | -23 | -17 | 4.035 | $ 7,441,733,330.64 |
| DRE | Drednought Resources | -8 | 7 | 76 | 100 | 0.044 | $ 127,433,795.49 |
| RMX | Red Mount Min | -8 | 10 | 22 | -8 | 0.011 | $ 14,644,583.02 |
| FAU | First Au | -8 | -8 | -45 | -42 | 0.011 | $ 7,682,859.40 |
| DEX | Duke Exploration | -9 | 13 | -46 | -36 | 0.215 | $ 18,944,341.92 |
| KAL | Kalgoorliegoldmining | -9 | 0.16 | $ 11,589,536.00 | |||
| AME | Alto Metals Limited | -9 | 5 | 15 | 5 | 0.105 | $ 53,649,042.51 |
| SLZ | Sultan Resources | -9 | -21 | -43 | -34 | 0.155 | $ 11,125,502.24 |
| GIB | Gibb River Diamonds | -9 | -4 | 8 | -41 | 0.082 | $ 17,766,793.38 |
| PRU | Perseus Mining | -9 | 1 | 22 | 53 | 1.675 | $ 2,067,696,475.45 |
| AGC | AGC | -9 | -17 | -38 | 0.1 | $ 6,772,728.40 | |
| AGC | AGC | -9 | -17 | -38 | 0.1 | $ 6,772,728.40 | |
| ICL | Iceni Gold | -9 | -22 | 0 | 0.2 | $ 23,357,098.64 | |
| WAF | West African Res | -9 | -5 | 23 | 62 | 1.33 | $ 1,281,347,746.90 |
| TG1 | Techgen Metals | -9 | -7 | -13 | 0.195 | $ 7,513,113.08 | |
| CDR | Codrus Minerals | -9 | 4 | 0.145 | $ 6,000,000.00 | ||
| RMS | Ramelius Resources | -10 | 0 | -16 | -4 | 1.6275 | $ 1,403,263,745.81 |
| AAJ | Aruma Resources | -10 | -23 | 19 | -24 | 0.074 | $ 9,321,151.22 |
| SPQ | Superior Resources | -10 | 38 | 64 | 29 | 0.018 | $ 26,147,311.40 |
| LYN | Lycaonresources | -10 | 0.45 | $ 12,015,000.00 | |||
| KSN | Kingston Resources | -10 | -10 | -20 | -29 | 0.18 | $ 62,423,297.48 |
| CHZ | Chesser Resources | -10 | -7 | -4 | -40 | 0.135 | $ 67,496,938.13 |
| IPT | Impact Minerals | -10 | -4 | -16 | -41 | 0.0135 | $ 28,333,128.87 |
| GMR | Golden Rim Resources | -10 | 0 | -45 | -45 | 0.09 | $ 22,022,233.65 |
| MCT | Metalicity Limited | -10 | -10 | -31 | -47 | 0.009 | $ 19,293,943.79 |
| BYH | Bryah Resources | -10 | 2 | -28 | -24 | 0.053 | $ 12,667,601.80 |
| ANX | Anax Metals | -10 | -21 | -11 | 21 | 0.087 | $ 32,917,285.66 |
| BEZ | Besragoldinc | -10 | -16 | 0.13 | $ 22,340,494.80 | ||
| CEL | Challenger Exp | -10 | 7 | 7 | 58 | 0.3 | $ 306,942,433.88 |
| GOR | Gold Road Res | -11 | 10 | -2 | 28 | 1.485 | $ 1,327,109,061.71 |
| YRL | Yandal Resources | -11 | -5 | -39 | -13 | 0.39 | $ 40,204,372.65 |
| RRL | Regis Resources | -11 | -17 | -25 | -47 | 1.9 | $ 1,456,718,255.14 |
| DCN | Dacian Gold | -11 | -18 | -33 | -39 | 0.205 | $ 203,160,300.84 |
| MM8 | Medallion Metals. | -11 | -9 | -30 | 0.2 | $ 15,789,166.77 | |
| DDD | 3D Resources Limited | -11 | 0 | -20 | -3 | 0.004 | $ 15,521,488.37 |
| TMX | Terrain Minerals | -11 | 0 | -27 | -27 | 0.008 | $ 5,886,088.07 |
| SLR | Silver Lake Resource | -11 | 1 | -15 | -1 | 1.67 | $ 1,491,892,753.71 |
| ASO | Aston Minerals | -12 | -8 | -28 | 174 | 0.115 | $ 104,961,717.19 |
| ALK | Alkane Resources | -12 | -6 | 1 | -12 | 0.84 | $ 497,312,155.70 |
| MGV | Musgrave Minerals | -12 | -9 | -23 | -12 | 0.34 | $ 185,324,667.41 |
| SBM | St Barbara Limited | -12 | -11 | -26 | -44 | 1.395 | $ 982,694,962.87 |
| VMC | Venus Metals Cor | -12 | -3 | -3 | -14 | 0.18 | $ 27,194,162.94 |
| GNM | Great Northern | -13 | -22 | -56 | -59 | 0.007 | $ 9,672,407.81 |
| AL8 | Alderan Resource | -13 | -20 | -41 | -64 | 0.035 | $ 15,320,378.88 |
| TTM | Titan Minerals | -13 | -17 | -17 | -9 | 0.096 | $ 133,566,095.81 |
| NES | Nelson Resources. | -13 | -21 | -47 | -45 | 0.034 | $ 6,800,226.83 |
| MRR | Minrex Resources | -13 | 0 | -17 | -17 | 0.02 | $ 12,272,128.16 |
| GTR | Gti Resources | -13 | -21 | 22 | 56 | 0.026 | $ 29,348,311.93 |
| LCL | Los Cerros Limited | -13 | -4 | -21 | 8 | 0.13 | $ 82,721,126.15 |
| TAR | Taruga Minerals | -14 | -10 | -50 | -1 | 0.0415 | $ 23,042,700.27 |
| NXM | Nexus Minerals | -14 | 12 | 467 | 304 | 0.505 | $ 142,538,229.41 |
| LCY | Legacy Iron Ore | -14 | 85 | 71 | 300 | 0.024 | $ 153,713,724.41 |
| TCG | Turaco Gold Limited | -14 | -20 | 33 | 100 | 0.12 | $ 42,370,833.88 |
| AVW | Avira Resources | -14 | 0 | 0 | -33 | 0.006 | $ 10,312,740.00 |
| HXG | Hexagon Energy | -14 | -5 | -14 | 34 | 0.083 | $ 39,695,230.60 |
| PDI | Predictive Disc | -15 | 27 | 180 | 305 | 0.235 | $ 327,375,026.88 |
| LRL | Labyrinth Resources | -15 | 11 | -25 | 67 | 0.04 | $ 36,521,570.36 |
| CST | Castile Resources | -16 | -29 | -31 | -24 | 0.185 | $ 37,944,922.99 |
| HMX | Hammer Metals | -16 | -33 | -57 | 17 | 0.042 | $ 37,420,752.66 |
| RSG | Resolute Mining | -16 | -16 | -39 | -52 | 0.365 | $ 413,974,320.00 |
| NVA | Nova Minerals | -16 | -16 | -4 | -37 | 0.13 | $ 234,264,882.41 |
| KCC | Kincora Copper | -17 | -11 | -62 | 0.125 | $ 8,808,434.28 | |
| REZ | Resourc & En Grp | -17 | -2 | 55 | -10 | 0.045 | $ 23,490,872.08 |
| BGL | Bellevue Gold | -17 | -6 | -14 | -31 | 0.8075 | $ 844,713,273.16 |
| BRB | Breaker Res NL | -17 | 5 | 89 | 100 | 0.34 | $ 123,819,553.02 |
| DLC | Delecta Limited | -19 | -13 | 117 | 86 | 0.013 | $ 16,868,721.87 |
| ICG | Inca Minerals | -19 | -19 | -34 | 75 | 0.105 | $ 47,613,546.78 |
| A8G | Australasian Gold | -20 | -10 | 200 | 0.51 | $ 19,389,394.53 | |
| AXE | Archer Materials | -24 | -20 | 59 | 135 | 1.21 | $ 317,995,361.00 |
| ANL | Amani Gold | -25 | -25 | 50 | 50 | 0.0015 | $ 36,851,128.21 |
| NPM | Newpeak Metals | -33 | 0 | -60 | -67 | 0.001 | $ 7,424,685.10 |
Weekly Small Cap Standouts
KNB’s main game is its namesake project in NSW, where a soil sampling program has uncovered a new 1.8km long target called ‘Vegas’.
There has been no previous exploration at Vegas, the company says.
KNB intends to initially follow up with more soils to close the current gaps and define the geometry in readiness for drilling.
Mini-bulk rock chip samples were collected from this area, and concentrates are currently being assayed, with results due in early December.
“The portfolio of geochemical targets is expanding, and we continue to delineate multiple targets for further work and build more information to feed into the geological model to help us design the drill programme due to start in the next quarter,” KNB chief exec Karen O’Neill says.
The stock had a cash balance of $7.5m at the end of September.
In mid-September it announced a gold discovery under a WA Salt Lake called ‘Goongarrie’.
Exploring for gold underneath salt lakes is tough, which is probably why so many remain underexplored — regardless of how prospective they are.
That’s because the lake sediments have been washed around over time, making early-stage soil sampling to help find mineralised anomalies redundant. That makes it hard to dial in on a potential discovery.
The high-grade Invincible gold deposit, which forms the backbone of Gold Fields’ St Ives camp near Kalgoorlie, almost went undiscovered due to the low tenor gold results and small geochemical footprint.
In other words, you either hit something with drilling, or you don’t.
That is why early results like 3m @ 6.5g/t gold and 3m @ 4.1g/t gold from Kingwest’s ‘Sir Laurence’ prospect are so important.
Subsequent results have also been exciting, with 29 of the 80 holes drilled so far hitting significant gold up to 800m away from the discovery line.
Highlights from this shallow, early-stage drilling include 28m @ 1.9g/t gold from 20m (16m in bedrock) and 8m @ 2.2g/t Au from 12m in.
“These excellent results including 28m @ 1.9g/t Au from 20m in follow up drilling at Sir Laurence, are very significant in that they are 800m south of, and along strike of, the discovery Line 5 but mineralisation is at a much shallower depth and includes bedrock mineralisation,” CEO Ed Turner says.
“Significant bedrock mineralisation has also been intersected on Lines B and C.
“This reinforces our interpretation of Sir Laurence as having the potential to be a large mineralised system.
“Line A is the first line of drilling within the current program, and we eagerly anticipate results from all of the remaining drill holes within the Sir Laurence Prospect.”
1,000m of deeper diamond drilling at Sir Laurence will kick off within the next two weeks, while a 2,000m aircore program focussing on Lake Goongarrie targets outside Sir Laurence is imminent.
Related Topics

Related Stories


UNLOCK INSIGHTS
Discover the untold stories of emerging ASX stocks.
Daily news and expert analysis, it's free to subscribe.
By proceeding, you confirm you understand that we handle personal information in accordance with our Privacy Policy.


