Gold Digger: Gold shrugs off hot US inflation data as price soars and juniors wake up

"I know what you're thinking, but this is a family show." (Pic via Getty Images)
Gold… GOLD… GOLD!
Yep, that pretty much sums it up for a summary. And we’ll see you here this time next week.
Okay, a few more words, then…
- Gold bullion hits record price highs again this week/today in US and Aussie dollar denoms
- Sprott analysis suggests gold stocks are undervalued compared with the surging gold prices
- ASX gold stocks faring particularly well this week include: NewPeak and Krakatoa
It seems there’s no stopping gold right now. Not US inflation, not cautious Federal Reserve governors. Not even the All Blacks. And that’d be because they’re not playing the Wallabies until September. Good times.
Gold investors have more times of goodness to look forward to in coming months, too – and this is according to analysts at Sprott – a prominent global assests management firm specialising in precious metals. We’ll get to that in a tick, but first…
The price of gold right today has been doing this:
That’s right – ingesting a cocktail of booze and amphetamines, letting loose on the set of what looks like a kids’ television show and probably setting its beard on fire with a sparkler.
But still, it’s having a bonza time, and has actually been hitting all-time highs again. A very happy habit of late, and it’s now up more than 15% YTD.
The current price in US dollars as we close out another working week: US$2,392. Which looks even more impressive in the Aussie variety: about a stonking AUD $3,665.
Gold prices have hit a RECORD high for an eighth consecutive session.
The gold juniors are still asleep.
The market is slowly waking up.
— Gold Telegraph ⚡ (@GoldTelegraph_) April 9, 2024
But hang on, didn’t Fed wowsers cause it to dip the other day?
Yeah, they did. On the back of hotter-than-expected US inflation-related data. But that’s yesterday’s news. This commodity du jour is robust as hell right now, and it has some banker analysts reaching for the red pen to make adjustments to prior forecasts.
For instance, Francisco Blanch, head of Commodities and Derivatives Research at Bank of America Securities, told Yahoo Finance this:
“In the case of gold, I think there’s a really big structural trend towards more gold purchases driven by the major geopolitical fracture that we have in the world today between the US and Europe on one side, and Russia China on the other. It’s really been central banks not trusting central banks that has been behind the buy-the-dip mentality in the gold market.”
He added that although the Bank of America still expects three rate cuts in 2024, gold prices could tumble if the Fed doesn’t deliver that outcome.
“We are still calling for a rate cut in June, and two more in the second half of the year, so based on that, we think prices continue to go higher, but there is definitely a challenge for the gold market if the Fed doesn’t cut rates this year, or as some people have claimed, if the Fed hikes rates.”
If that happens, it’ll be a “challenge” for most markets, one would’ve thought.
Other Bank of America bods also said this, this week:
“Gold remains one of our favorite metals and we expect prices to average US$2,500/oz by the fourth quarter, potentially hitting US$3,000/oz by 2025. Notably, demand from central banks and China’s retail buyers has been strong. If Western investors join the party on rate cuts, the yellow metal will move a leg higher; this may also be necessary, if sentiment in China improves, and less investment flows into gold.”
Here’s another take…
Junior gold stocks are waking up with gold price: Sprott
John Hathaway, managing partner with Sprott Asset Managment in the USA, has put together some analysis this week amid the surging gold prices.
Gold mining and exploration stock folks, particularly juniors, will probably be nodding heads sagely, as one of Hathaway’s chief takeaways pertains to them.
“Gold mining stocks, which have been lackluster, are beginning to respond but they remain historically inexpensive to the gold price,” wrote the Sprott man, referring to this Bloomberg chart among others, bearing in mind it has an American lens:
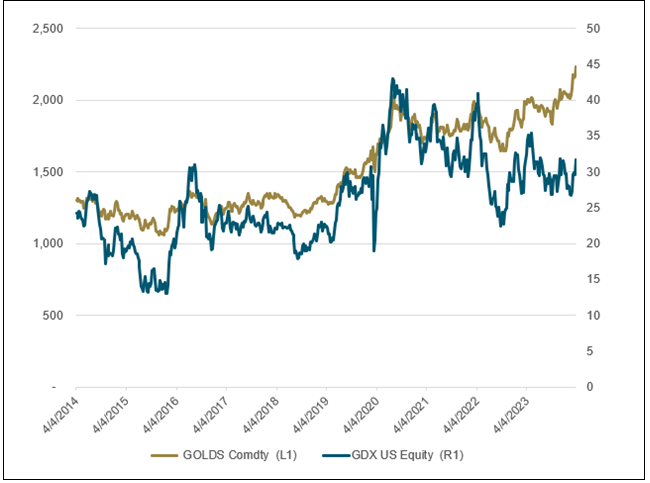
“In our view, gold mining stocks offer upside potential disproportionate to that of bullion,” added Hathaway.
“To be sure, persistent inflation might short-circuit consensus expectations for a 2024 rate cut,” he noted. “However, we believe it is only a matter of time before investors discover that the Federal Reserve is trapped between a weakening economy and its inflation-fighting mandate.
“While attention is focused on interest rate cuts, at Fed Chairman Powell’s last press conference, he stated that it could be ‘appropriate to slow the pace of asset runoff fairly soon…if there were a significant weakening of the labor market,’ a clear tilt toward QE (quantitative easing).”
In other words: Money. Printer. Goes. Brrrrrrrrr.
But wait, he said more. (It’s a good piece, btw – read it in full > here).
Gold’s price is ‘no fluke’
The Sprott exec also suggested that, regarding gold’s continued surge, there has been more “widespread recognition that gold bullion’s strength is not a fluke and that the current level is either sustainable at current levels or that significant upside potential remains.”
Searching for a reason for that, or indeed another catalyst for continued up/right price action, he speculated that there’s a growing loss of trust in the US dollar as a store of value, and indeed US Treasury bonds as a safe place to park money.
Like the Bank of America analysis further above, he cites the record bank-hoarding from global central banks, which continue to gobble up the precious metal (1,037 tonnes in 2023 – an unprecedented level).
All the while, the US government debt just continues to spiral and spiral into a further abyss of dollar decay.
“Loss of trust in the US dollar as a safe and useful asset is no longer a hypothetical concern,” writes Hathaway. “Abandonment of the US dollar is a reality, and the pace is picking up steam. Repercussions for the financial markets and real economy are unlikely to be negligible. There are numerous potential catalysts for the general rush into gold by the investment mainstream.”
In short, those catalysts consist of: geopolitical tension (wars/conflict), inflation and rising oil prices, potential recession, “an impotent and mistake-prone” Federal Reserve, and more.
“The investment public remains asleep to the risks. Yet the breakout in gold bullion could signal the possibility of a significant reset of world financial markets.”
ASX Winners & Losers
Here’s how ASX-listed precious metals stocks are performing, circa 3pm April 12:
Scroll or swipe to reveal table. Click headings to sort. Best viewed on a laptop.
Stocks missing from this list? Please email [email protected]Notable weekly gainers
| Code | Company | Price | % Week | % Month | % Year | Market Cap |
|---|---|---|---|---|---|---|
| MRR | Minrex Resources Ltd | 0.014 | 8% | 8% | -13% | $14,103,278 |
| NPM | Newpeak Metals | 0.025 | 127% | 127% | -75% | $1,099,469 |
| ASO | Aston Minerals Ltd | 0.012 | -14% | -25% | -90% | $15,540,771 |
| MTC | Metalstech Ltd | 0.185 | 9% | 6% | -47% | $34,956,599 |
| FFX | Firefinch Ltd | 0.2 | 0% | 0% | 0% | $236,569,315 |
| GED | Golden Deeps | 0.044 | -2% | 7% | -45% | $5,082,983 |
| G88 | Golden Mile Res Ltd | 0.013 | 8% | 8% | -54% | $5,345,897 |
| DCX | Discovex Res Ltd | 0.002 | 0% | 0% | -50% | $6,605,136 |
| NMR | Native Mineral Res | 0.028 | 40% | 12% | -18% | $5,875,814 |
| AQX | Alice Queen Ltd | 0.007 | 40% | 40% | -59% | $4,836,930 |
| SLZ | Sultan Resources Ltd | 0.011 | -15% | -59% | -73% | $2,173,451 |
| MKG | Mako Gold | 0.0145 | -3% | 4% | -63% | $14,640,123 |
| KSN | Kingston Resources | 0.072 | -10% | -7% | -35% | $44,992,293 |
| AMI | Aurelia Metals Ltd | 0.1925 | 20% | 33% | 35% | $321,055,807 |
| PNX | PNX Metals Limited | 0.005 | 11% | -9% | 67% | $26,903,124 |
| GIB | Gibb River Diamonds | 0.032 | 14% | 14% | -32% | $6,768,302 |
| KCN | Kingsgate Consolid. | 1.52 | 3% | 11% | -5% | $371,162,436 |
| TMX | Terrain Minerals | 0.0035 | -13% | -30% | -36% | $5,726,683 |
| BNR | Bulletin Res Ltd | 0.05 | -23% | -30% | -44% | $14,387,053 |
| NXM | Nexus Minerals Ltd | 0.072 | 20% | 100% | -56% | $28,401,389 |
| SKY | SKY Metals Ltd | 0.04 | 29% | -5% | -11% | $22,716,037 |
| LM8 | Lunnonmetalslimited | 0.265 | 2% | 15% | -76% | $54,459,059 |
| CST | Castile Resources | 0.089 | 24% | 24% | -4% | $21,045,511 |
| YRL | Yandal Resources | 0.17 | 55% | 55% | 85% | $40,171,142 |
| FAU | First Au Ltd | 0.002 | 0% | -33% | -67% | $3,323,987 |
| ARL | Ardea Resources Ltd | 0.715 | 7% | 29% | 64% | $137,911,841 |
| GWR | GWR Group Ltd | 0.1 | 0% | 6% | 41% | $30,515,582 |
| IVR | Investigator Res Ltd | 0.055 | 10% | 31% | -4% | $90,281,136 |
| GTR | Gti Energy Ltd | 0.0065 | -7% | -19% | -28% | $14,349,630 |
| IPT | Impact Minerals | 0.016 | 7% | 10% | 45% | $45,835,262 |
| BNZ | Benzmining | 0.15 | 15% | 20% | -63% | $16,691,696 |
| MOH | Moho Resources | 0.006 | 0% | 0% | -60% | $3,235,069 |
| BCM | Brazilian Critical | 0.021 | -5% | -9% | -78% | $15,539,093 |
| PUA | Peak Minerals Ltd | 0.0035 | 17% | 17% | -13% | $3,124,130 |
| MRZ | Mont Royal Resources | 0.067 | 18% | -1% | -36% | $6,547,294 |
| SMS | Starmineralslimited | 0.04 | 14% | 18% | -44% | $3,036,912 |
| MVL | Marvel Gold Limited | 0.009 | -10% | -10% | -47% | $7,774,116 |
| PRX | Prodigy Gold NL | 0.003 | 20% | -40% | -75% | $6,041,322 |
| AAU | Antilles Gold Ltd | 0.02 | 0% | -5% | -43% | $17,990,700 |
| CWX | Carawine Resources | 0.11 | 0% | 5% | 18% | $25,973,799 |
| RND | Rand Mining Ltd | 1.57 | 6% | 20% | 18% | $88,442,119 |
| CAZ | Cazaly Resources | 0.023 | 15% | 0% | -12% | $10,001,999 |
| BMR | Ballymore Resources | 0.13 | 0% | 4% | -19% | $23,416,803 |
| DRE | Dreadnought Resources Ltd | 0.018 | 0% | 0% | -74% | $63,235,313 |
| ZNC | Zenith Minerals Ltd | 0.098 | 9% | 0% | -32% | $34,533,327 |
| REZ | Resourc & En Grp Ltd | 0.013 | 18% | 44% | 0% | $6,497,475 |
| LEX | Lefroy Exploration | 0.15 | 43% | 36% | -39% | $28,064,187 |
| ERM | Emmerson Resources | 0.049 | 0% | -6% | -35% | $26,690,780 |
| AM7 | Arcadia Minerals | 0.099 | 16% | 41% | -46% | $10,468,810 |
| ADT | Adriatic Metals | 4.24 | 6% | 20% | 18% | $1,058,716,091 |
| AS1 | Asara Resources Ltd | 0.009 | 0% | 0% | -74% | $7,939,578 |
| CYL | Catalyst Metals | 0.82 | 19% | 16% | -18% | $166,218,946 |
| CHN | Chalice Mining Ltd | 1.5225 | 30% | 24% | -80% | $540,658,993 |
| KAL | Kalgoorliegoldmining | 0.035 | 25% | 52% | -30% | $5,072,023 |
| MLS | Metals Australia | 0.021 | -13% | -18% | -48% | $16,269,499 |
| ADN | Andromeda Metals Ltd | 0.019 | -5% | -32% | -61% | $59,095,148 |
| MEI | Meteoric Resources | 0.2525 | 10% | 20% | 120% | $497,529,961 |
| SRN | Surefire Rescs NL | 0.01 | 0% | -17% | -60% | $19,863,078 |
| SIH | Sihayo Gold Limited | 0.0015 | 50% | 50% | -25% | $18,306,384 |
| WA8 | Warriedarresourltd | 0.047 | 7% | -2% | -68% | $29,508,727 |
| HMX | Hammer Metals Ltd | 0.046 | -4% | 28% | -54% | $42,547,553 |
| WCN | White Cliff Min Ltd | 0.019 | 19% | 27% | 171% | $29,238,973 |
| AVM | Advance Metals Ltd | 0.027 | -29% | -25% | -83% | $1,082,294 |
| WRM | White Rock Min Ltd | 0 | -100% | -100% | -100% | $17,508,200 |
| ASR | Asra Minerals Ltd | 0.007 | 17% | 40% | -42% | $11,647,970 |
| MCT | Metalicity Limited | 0.002 | 0% | 0% | -20% | $8,970,108 |
| AME | Alto Metals Limited | 0.043 | 8% | 39% | -39% | $30,303,973 |
| CTO | Citigold Corp Ltd | 0.005 | 0% | 25% | -17% | $12,000,000 |
| TIE | Tietto Minerals | 0.655 | 7% | 8% | -13% | $723,129,889 |
| SMI | Santana Minerals Ltd | 1.35 | 2% | 1% | 70% | $231,465,597 |
| M2R | Miramar | 0.012 | -14% | -20% | -71% | $2,233,043 |
| MHC | Manhattan Corp Ltd | 0.002 | -33% | -20% | -60% | $8,810,939 |
| GRL | Godolphin Resources | 0.033 | -8% | 6% | -49% | $5,584,987 |
| SVG | Savannah Goldfields | 0.03 | 7% | -9% | -81% | $7,027,123 |
| EMC | Everest Metals Corp | 0.105 | 17% | 33% | 50% | $18,892,558 |
| GUL | Gullewa Limited | 0.056 | 2% | 2% | 2% | $11,467,294 |
| CY5 | Cygnus Metals Ltd | 0.074 | 35% | 35% | -70% | $18,659,785 |
| G50 | Gold50Limited | 0.175 | 17% | 75% | -17% | $19,125,750 |
| ADV | Ardiden Ltd | 0.165 | 10% | 10% | -52% | $9,690,213 |
| AAR | Astral Resources NL | 0.069 | 10% | 17% | -17% | $60,651,340 |
| VMC | Venus Metals Cor Ltd | 0.1 | 3% | 10% | -14% | $18,972,868 |
| NAE | New Age Exploration | 0.0045 | 0% | 13% | -25% | $7,175,596 |
| VKA | Viking Mines Ltd | 0.009 | -10% | -18% | -18% | $9,227,326 |
| LCL | LCL Resources Ltd | 0.011 | 0% | -8% | -63% | $10,507,481 |
| MTH | Mithril Resources | 0.002 | 0% | 0% | 0% | $6,737,609 |
| ADG | Adelong Gold Limited | 0.004 | 0% | 0% | -69% | $3,521,956 |
| RMX | Red Mount Min Ltd | 0.001 | -43% | -43% | -67% | $2,673,576 |
| PRS | Prospech Limited | 0.039 | -3% | 22% | -26% | $10,805,949 |
| TTM | Titan Minerals | 0.033 | 10% | 10% | -42% | $54,280,410 |
| NML | Navarre Minerals Ltd | 0.019 | 0% | 0% | -44% | $28,555,654 |
| MZZ | Matador Mining Ltd | 0.063 | 19% | 47% | -19% | $30,955,004 |
| KZR | Kalamazoo Resources | 0.105 | 5% | 6% | -36% | $17,130,747 |
| BCN | Beacon Minerals | 0.03 | 7% | 30% | -9% | $108,946,277 |
| MAU | Magnetic Resources | 0.995 | 3% | -5% | 46% | $252,840,581 |
| BC8 | Black Cat Syndicate | 0.265 | -2% | 18% | -44% | $78,443,975 |
| EM2 | Eagle Mountain | 0.066 | 14% | -11% | -56% | $23,602,012 |
| EMR | Emerald Res NL | 3.555 | 9% | 17% | 106% | $2,254,074,790 |
| BYH | Bryah Resources Ltd | 0.01 | 0% | 25% | -56% | $4,354,535 |
| HCH | Hot Chili Ltd | 1.21 | -6% | 22% | 16% | $145,723,151 |
| WAF | West African Res Ltd | 1.415 | 7% | 42% | 39% | $1,402,010,179 |
| MEU | Marmota Limited | 0.045 | 0% | -8% | 18% | $45,528,425 |
| NVA | Nova Minerals Ltd | 0.275 | 10% | 0% | -15% | $55,885,866 |
| SVL | Silver Mines Limited | 0.195 | 3% | 30% | -19% | $301,607,251 |
| PGD | Peregrine Gold | 0.215 | -9% | -9% | -44% | $14,933,253 |
| ICL | Iceni Gold | 0.024 | 4% | 4% | -66% | $5,917,465 |
| FG1 | Flynngold | 0.041 | -8% | 12% | -51% | $7,386,341 |
| WWI | West Wits Mining Ltd | 0.019 | 12% | 27% | 12% | $46,177,441 |
| RML | Resolution Minerals | 0.003 | 20% | 0% | -50% | $4,829,990 |
| AAJ | Aruma Resources Ltd | 0.021 | 11% | 17% | -70% | $4,134,722 |
| AL8 | Alderan Resource Ltd | 0.006 | 20% | 20% | -25% | $6,641,168 |
| GMN | Gold Mountain Ltd | 0.0045 | 13% | 13% | 29% | $11,902,023 |
| MEG | Megado Minerals Ltd | 0.01 | -9% | -9% | -77% | $2,799,011 |
| HMG | Hamelingoldlimited | 0.08 | 7% | 4% | -16% | $12,600,000 |
| TBA | Tombola Gold Ltd | 0.026 | 0% | 0% | 0% | $33,129,243 |
| BM8 | Battery Age Minerals | 0.12 | 24% | -14% | -68% | $10,093,635 |
| TBR | Tribune Res Ltd | 4.41 | 5% | 36% | 13% | $215,119,116 |
| FML | Focus Minerals Ltd | 0.18 | -3% | 0% | -3% | $51,580,556 |
| GSR | Greenstone Resources | 0.0095 | 19% | 36% | -57% | $12,359,315 |
| VRC | Volt Resources Ltd | 0.0055 | 10% | -8% | -54% | $24,780,640 |
| ARV | Artemis Resources | 0.017 | -6% | -6% | 21% | $27,059,138 |
| HRN | Horizon Gold Ltd | 0.3 | 7% | 11% | -11% | $43,451,977 |
| CLA | Celsius Resource Ltd | 0.014 | -7% | 8% | -7% | $29,198,672 |
| QML | Qmines Limited | 0.076 | 6% | 27% | -49% | $16,472,469 |
| RDN | Raiden Resources Ltd | 0.037 | 48% | 54% | 874% | $82,354,138 |
| TCG | Turaco Gold Limited | 0.18 | 3% | 16% | 161% | $111,228,056 |
| KCC | Kincora Copper | 0.035 | -10% | 17% | -49% | $7,993,810 |
| GBZ | GBM Rsources Ltd | 0.013 | 18% | 30% | -54% | $12,446,681 |
| DTM | Dart Mining NL | 0.04 | -13% | 186% | -44% | $9,103,185 |
| MKR | Manuka Resources. | 0.09 | 27% | 0% | 5% | $58,463,960 |
| AUC | Ausgold Limited | 0.034 | -3% | 3% | -33% | $82,661,083 |
| ANX | Anax Metals Ltd | 0.029 | 12% | 53% | -60% | $14,103,647 |
| EMU | EMU NL | 0.001 | 0% | 0% | -50% | $2,024,771 |
| SFM | Santa Fe Minerals | 0.047 | 0% | 4% | -23% | $3,422,483 |
| SSR | SSR Mining Inc. | 8.19 | 14% | 24% | -65% | $38,137,264 |
| PNR | Pantoro Limited | 0.0835 | 11% | 64% | 14% | $421,526,472 |
| CMM | Capricorn Metals | 5.33 | -3% | 7% | 12% | $1,985,271,443 |
| X64 | Ten Sixty Four Ltd | 0.57 | 0% | 0% | 0% | $130,184,182 |
| SI6 | SI6 Metals Limited | 0.003 | 0% | -25% | -40% | $7,106,578 |
| HAW | Hawthorn Resources | 0.074 | -8% | -4% | -4% | $23,786,109 |
| BGD | Bartongoldholdings | 0.285 | 10% | 10% | 25% | $57,497,543 |
| SVY | Stavely Minerals Ltd | 0.03 | 0% | -14% | -83% | $11,840,143 |
| AGC | AGC Ltd | 0.079 | 7% | 3% | 44% | $16,888,889 |
| RGL | Riversgold | 0.007 | -13% | -13% | -59% | $6,773,630 |
| TSO | Tesoro Gold Ltd | 0.03 | 7% | -3% | 11% | $39,346,583 |
| GUE | Global Uranium | 0.105 | -5% | 5% | -22% | $27,668,899 |
| CPM | Coopermetalslimited | 0.105 | -5% | -64% | -68% | $8,227,343 |
| MM8 | Medallion Metals. | 0.066 | 3% | 18% | -50% | $19,997,357 |
| FFM | Firefly Metals Ltd | 0.8125 | 7% | 53% | 13% | $367,184,281 |
| CBY | Canterbury Resources | 0.025 | -32% | -11% | -29% | $4,465,263 |
| LYN | Lycaonresources | 0.17 | 10% | 0% | 0% | $7,930,125 |
| SFR | Sandfire Resources | 9.04 | 0% | 19% | 35% | $4,076,372,244 |
| TMZ | Thomson Res Ltd | 0.005 | 0% | 0% | 0% | $4,881,018 |
| TAM | Tanami Gold NL | 0.04 | 3% | 38% | 5% | $45,828,785 |
| WMC | Wiluna Mining Corp | 0.205 | 0% | 0% | 0% | $74,238,031 |
| NWM | Norwest Minerals | 0.045 | 50% | 55% | 5% | $20,570,334 |
| ALK | Alkane Resources Ltd | 0.695 | 8% | 17% | -17% | $392,234,256 |
| BMO | Bastion Minerals | 0.0085 | 6% | -6% | -67% | $3,659,963 |
| IDA | Indiana Resources | 0.08 | 7% | -2% | 74% | $50,004,302 |
| GSM | Golden State Mining | 0.011 | 0% | 10% | -67% | $3,073,077 |
| NSM | Northstaw | 0.04 | -11% | 18% | -67% | $5,595,031 |
| GSN | Great Southern | 0.021 | -5% | 0% | 5% | $15,847,339 |
| RED | Red 5 Limited | 0.4275 | 11% | 24% | 144% | $1,402,839,222 |
| DEG | De Grey Mining | 1.37 | 5% | 8% | -13% | $2,471,439,476 |
| THR | Thor Energy PLC | 0.022 | 0% | -12% | -45% | $4,038,185 |
| CDR | Codrus Minerals Ltd | 0.042 | 2% | -5% | -51% | $3,880,275 |
| MDI | Middle Island Res | 0.017 | 6% | 13% | -50% | $3,917,772 |
| WTM | Waratah Minerals Ltd | 0.12 | 50% | 69% | -20% | $16,430,095 |
| POL | Polymetals Resources | 0.27 | 2% | 0% | 50% | $40,980,630 |
| RDS | Redstone Resources | 0.004 | 0% | -20% | -56% | $3,701,514 |
| NAG | Nagambie Resources | 0.012 | -14% | -25% | -74% | $9,559,628 |
| BGL | Bellevue Gold Ltd | 2.01 | 5% | 38% | 41% | $2,319,363,446 |
| GBR | Greatbould Resources | 0.064 | 7% | 7% | -32% | $38,434,678 |
| KAI | Kairos Minerals Ltd | 0.013 | 8% | 0% | -29% | $34,071,858 |
| KAU | Kaiser Reef | 0.15 | 0% | 11% | -17% | $25,656,584 |
| HRZ | Horizon | 0.036 | -5% | 6% | -39% | $25,936,396 |
| CAI | Calidus Resources | 0.1275 | -12% | -18% | -48% | $98,924,051 |
| CDT | Castle Minerals | 0.006 | -8% | 0% | -68% | $7,346,958 |
| RSG | Resolute Mining | 0.49 | 8% | 29% | 7% | $1,011,298,756 |
| MXR | Maximus Resources | 0.039 | 22% | 26% | -7% | $10,912,156 |
| EVN | Evolution Mining Ltd | 3.97 | 4% | 23% | 13% | $7,864,075,922 |
| CXU | Cauldron Energy Ltd | 0.048 | 12% | 26% | 596% | $60,749,201 |
| DLI | Delta Lithium | 0.28 | -3% | -14% | -28% | $214,022,143 |
| ALY | Alchemy Resource Ltd | 0.008 | 0% | 14% | -43% | $8,246,534 |
| HXG | Hexagon Energy | 0.019 | -17% | 19% | 58% | $10,258,318 |
| OBM | Ora Banda Mining Ltd | 0.34 | 15% | 24% | 152% | $593,442,097 |
| SLR | Silver Lake Resource | 1.3675 | 8% | 16% | 10% | $1,243,209,963 |
| AVW | Avira Resources Ltd | 0.001 | 0% | 0% | -50% | $2,133,790 |
| LCY | Legacy Iron Ore | 0.014 | -7% | -7% | -18% | $107,989,676 |
| PDI | Predictive Disc Ltd | 0.25 | 14% | 11% | 39% | $487,917,361 |
| MAT | Matsa Resources | 0.035 | 17% | 21% | -22% | $17,716,489 |
| ZAG | Zuleika Gold Ltd | 0.018 | -5% | 6% | 38% | $13,985,625 |
| GML | Gateway Mining | 0.022 | -4% | -21% | -63% | $7,600,107 |
| SBM | St Barbara Limited | 0.3 | 58% | 82% | 7% | $233,121,558 |
| SBR | Sabre Resources | 0.019 | 0% | 6% | -14% | $7,110,977 |
| STK | Strickland Metals | 0.12 | 0% | 33% | 200% | $199,534,010 |
| ION | Iondrive Limited | 0.01 | 11% | 0% | -57% | $4,862,853 |
| CEL | Challenger Gold Ltd | 0.093 | 1% | 13% | -44% | $121,142,478 |
| LRL | Labyrinth Resources | 0.006 | 20% | 50% | -59% | $7,125,262 |
| NST | Northern Star | 15.29 | 3% | 10% | 14% | $17,656,124,052 |
| OZM | Ozaurum Resources | 0.042 | 0% | -42% | -21% | $6,508,750 |
| TG1 | Techgen Metals Ltd | 0.042 | 45% | 20% | -32% | $4,703,905 |
| XAM | Xanadu Mines Ltd | 0.078 | 10% | 95% | 86% | $132,132,463 |
| AQI | Alicanto Min Ltd | 0.027 | -4% | -21% | -36% | $15,998,757 |
| KTA | Krakatoa Resources | 0.015 | 88% | 36% | -48% | $8,497,930 |
| ARN | Aldoro Resources | 0.081 | 14% | 4% | -55% | $10,096,781 |
| WGX | Westgold Resources. | 2.135 | -13% | -14% | 41% | $994,607,733 |
| MBK | Metal Bank Ltd | 0.021 | 0% | -5% | -36% | $7,809,186 |
| A8G | Australasian Metals | 0.064 | 0% | -10% | -63% | $3,283,591 |
| TAR | Taruga Minerals | 0.006 | -14% | -14% | -63% | $4,236,161 |
| DTR | Dateline Resources | 0.014 | 8% | 17% | -22% | $18,886,206 |
| GOR | Gold Road Res Ltd | 1.82 | 11% | 17% | 3% | $1,928,353,322 |
| S2R | S2 Resources | 0.1375 | -5% | -8% | -5% | $65,664,409 |
| NES | Nelson Resources. | 0.004 | 33% | 0% | -11% | $2,454,377 |
| TLM | Talisman Mining | 0.26 | -2% | 44% | 73% | $47,080,087 |
| BEZ | Besragoldinc | 0.105 | -5% | -25% | -43% | $48,081,604 |
| PRU | Perseus Mining Ltd | 2.35 | 5% | 18% | -2% | $3,132,243,970 |
| SPQ | Superior Resources | 0.011 | 10% | -15% | -79% | $24,014,645 |
| PUR | Pursuit Minerals | 0.0045 | -10% | -10% | -75% | $13,247,871 |
| RMS | Ramelius Resources | 1.9875 | 1% | 33% | 37% | $2,216,152,171 |
| PKO | Peako Limited | 0.005 | 25% | 25% | -44% | $2,635,424 |
| ICG | Inca Minerals Ltd | 0.005 | 0% | -17% | -71% | $4,023,694 |
| A1G | African Gold Ltd. | 0.04 | 14% | 8% | -52% | $6,433,826 |
| OAU | Ora Gold Limited | 0.005 | -29% | -17% | 100% | $34,836,005 |
| GNM | Great Northern | 0.013 | -4% | -24% | -71% | $2,010,178 |
| KRM | Kingsrose Mining Ltd | 0.038 | 9% | 15% | -42% | $26,338,428 |
| BTR | Brightstar Resources | 0.0195 | 3% | 18% | 30% | $55,215,770 |
| RRL | Regis Resources | 2.19 | 10% | 14% | 0% | $1,563,551,333 |
| M24 | Mamba Exploration | 0.028 | 12% | 12% | -78% | $4,970,221 |
| TRM | Truscott Mining Corp | 0.066 | 20% | 35% | 40% | $10,402,024 |
| TNC | True North Copper | 0.105 | 0% | 30% | 98% | $41,770,955 |
| MOM | Moab Minerals Ltd | 0.006 | 0% | -14% | -14% | $4,271,778 |
| KNB | Koonenberrygold | 0.023 | 35% | 5% | -49% | $3,167,363 |
| AWJ | Auric Mining | 0.22 | 10% | 22% | 267% | $29,670,674 |
| AZS | Azure Minerals | 3.475 | -4% | -4% | 672% | $1,573,270,942 |
| ENR | Encounter Resources | 0.31 | 19% | 19% | 114% | $121,494,075 |
| SNG | Siren Gold | 0.065 | 20% | 20% | -35% | $12,267,492 |
| STN | Saturn Metals | 0.2 | 3% | 29% | 0% | $43,636,608 |
| USL | Unico Silver Limited | 0.175 | 3% | 75% | 0% | $50,328,770 |
| PNM | Pacific Nickel Mines | 0.037 | -3% | -10% | -56% | $15,475,365 |
| AYM | Australia United Min | 0.003 | -25% | 0% | -25% | $5,527,732 |
| ANL | Amani Gold Ltd | 0.001 | 0% | 0% | 0% | $25,143,441 |
| HAV | Havilah Resources | 0.23 | 24% | 53% | -25% | $74,410,214 |
| SPR | Spartan Resources | 0.61 | -10% | -3% | 388% | $579,702,634 |
| PNT | Panthermetalsltd | 0.033 | 10% | -13% | -69% | $2,876,483 |
| MEK | Meeka Metals Limited | 0.036 | 0% | -8% | -28% | $45,684,230 |
| GMD | Genesis Minerals | 1.9775 | 4% | 6% | 80% | $2,148,502,338 |
| PGO | Pacgold | 0.19 | 23% | 23% | -55% | $15,566,906 |
| FEG | Far East Gold | 0.135 | -10% | -13% | -53% | $41,213,894 |
| MI6 | Minerals260Limited | 0.15 | -6% | 0% | -66% | $33,930,000 |
| IGO | IGO Limited | 7.49 | 3% | -1% | -40% | $5,694,653,954 |
| GAL | Galileo Mining Ltd | 0.25 | -4% | 2% | -68% | $50,394,356 |
| RXL | Rox Resources | 0.235 | 24% | 47% | -42% | $73,870,852 |
| KIN | KIN Min NL | 0.085 | 15% | 27% | 89% | $100,142,797 |
| CLZ | Classic Min Ltd | 0.01 | -9% | -80% | -80% | $2,578,122 |
| TGM | Theta Gold Mines Ltd | 0.18 | 13% | 50% | 165% | $128,077,171 |
| FAL | Falconmetalsltd | 0.14 | 12% | 0% | -60% | $23,010,000 |
| SXG | Southern Cross Gold | 2.34 | 25% | 37% | 212% | $205,084,596 |
| SPD | Southernpalladium | 0.455 | 38% | 32% | -13% | $19,600,639 |
| ORN | Orion Minerals Ltd | 0.014 | 0% | 8% | -13% | $81,847,986 |
| TMB | Tambourahmetals | 0.072 | 0% | -11% | -15% | $5,805,825 |
| TMS | Tennant Minerals Ltd | 0.028 | 0% | 0% | -18% | $20,641,858 |
| AZY | Antipa Minerals Ltd | 0.012 | -8% | -8% | -40% | $49,617,695 |
| PXX | Polarx Limited | 0.014 | 8% | 17% | 31% | $28,693,289 |
| TRE | Toubani Res Ltd | 0.125 | -7% | 9% | -32% | $16,063,880 |
| AUN | Aurumin | 0.048 | 9% | 26% | 60% | $19,236,276 |
| GPR | Geopacific Resources | 0.028 | 17% | 65% | 27% | $23,829,804 |
| FXG | Felix Gold Limited | 0.047 | -15% | 34% | -51% | $10,360,756 |
| ILT | Iltani Resources Lim | 0.155 | 3% | 11% | 0% | $5,781,786 |
| ARD | Argent Minerals | 0.018 | 13% | 80% | 20% | $21,959,903 |
Notable weekly gainers
NewPeak Metals (ASX:NPM) +127%
Krakatoa Resources (ASX:KTA) +88%
St Barbara (ASX:SBM) +58%
Norwest Minerals (ASX:NWM) +50%
Raiden Resources (ASX:RDN) +48%
Native Mineral Resources (ASX:NMR) +40%
Meanwhile, larger gold stocks surged alongside a new record high spot price, led by RED 5 (ASX:RED), Regis (ASX:RRL), Resolute (ASX:RSG), and Bellevue (ASX:BGL).
In Case You Missed It
This, re big-box retail chain Costco, which has (per Eddy’s Market Highlights this morning) started selling gold bars to its members last October.
Wells Fargo analysts believe that the product is now bringing in US$200 million a month for the retailer.
Costco doesn’t reveal the price of the 1-ounce bullion to non-members online, but it’s estimated to be ~2% above the prevailing spot price.
And that price has since soared since Costco got into the gold game.
Reddit threads have cropped up where people give one another advice on how to purchase the bars before they sell out.
Costco has also been selling silver coins, advertised as 99.9% pure silver, since January this year.
So how much is Costco profiting from this?
“Given its pricing and shipping costs, it’s likely a very low-profit business at best,” said Wells Fargo analysts.
The Costco stock price, listed on Nasdaq, has risen by 12% in 2024.
One final thing to note…
Copper and gold stocks are flying in China.
There is a gold rush in the country as well…
"When China sneezes, the world catches a cold."
In this case…
The world is slowly waking up to gold. pic.twitter.com/vt4crRkiTi
— Gold Telegraph ⚡ (@GoldTelegraph_) April 11, 2024
Related Topics

Related Stories


UNLOCK INSIGHTS
Discover the untold stories of emerging ASX stocks.
Daily news and expert analysis, it's free to subscribe.
By proceeding, you confirm you understand that we handle personal information in accordance with our Privacy Policy.


