Gold Digger: A new record for gold – but where should investors be looking?

Gold developers are running hot. But where should you be looking? Pic: Getty Images
- Gold hits another record as rate cut hopes ramped up this week
- Odds are rising that it could run above US$4000/oz in the months ahead
- Argonaut lines up its best developer picks
London Bullion Market Association gold prices cracked US$3556/oz on Wednesday, marking close to 30 fresh record highs through the first nine months of 2025 after more than 40 in 2024.
It may have punters wondering just how high gold can go.
Remarkably, even with prices juiced to the gills and some concerns an expected September US rate cut in already priced in, some analysts think it could continue to lift.
Head of gold strategy Aakash Doshi and his team at asset manager State Street Global Investment Management see a path to US$4000/oz emerging.
They say it’s more likely the next US$500 move in gold will be higher rather than lower in the next 6-12 months.
If the recent momentum for the precious metal continues and the September US Fed meet on Sept 16-17 delivers amid a climate of hostility between Donald Trump and Jerome Powell’s Fed, Doshi and his team have flagged a 30-40% lift in their US$3500-3900/oz bull case in October.
A number of catalysts could prove bullish for gold, they think. The One Big Beautiful Bill Act could be a trigger for higher US debt, deficit and inflation, a trade deal deadline between the US and China is creeping for November and threats to the US Fed’s independence could sink the US dollar.
That’s all positive for gold.
The risks of stagflation and a correction in heated equity markets are now rising.
“Gold continues to shine as a leading US$ denominated asset class for another calendar year, as the probability distribution of outcomes remains broad and murky,” Dohsi, Mohamed Abukhalaf and Diego Andrade said.
“The labor market is cooling, the US consumer is on defense and the broader disinflation trend is being challenged (with tariff impacts now more prevalent in the data).
“Versus just a few months ago, we would argue that the risks of stagflation or an equity market correction / volatility shock are higher—not lower.
“This is as physical demand for gold (central banks, investment channel) continues to trend in a positive direction.”
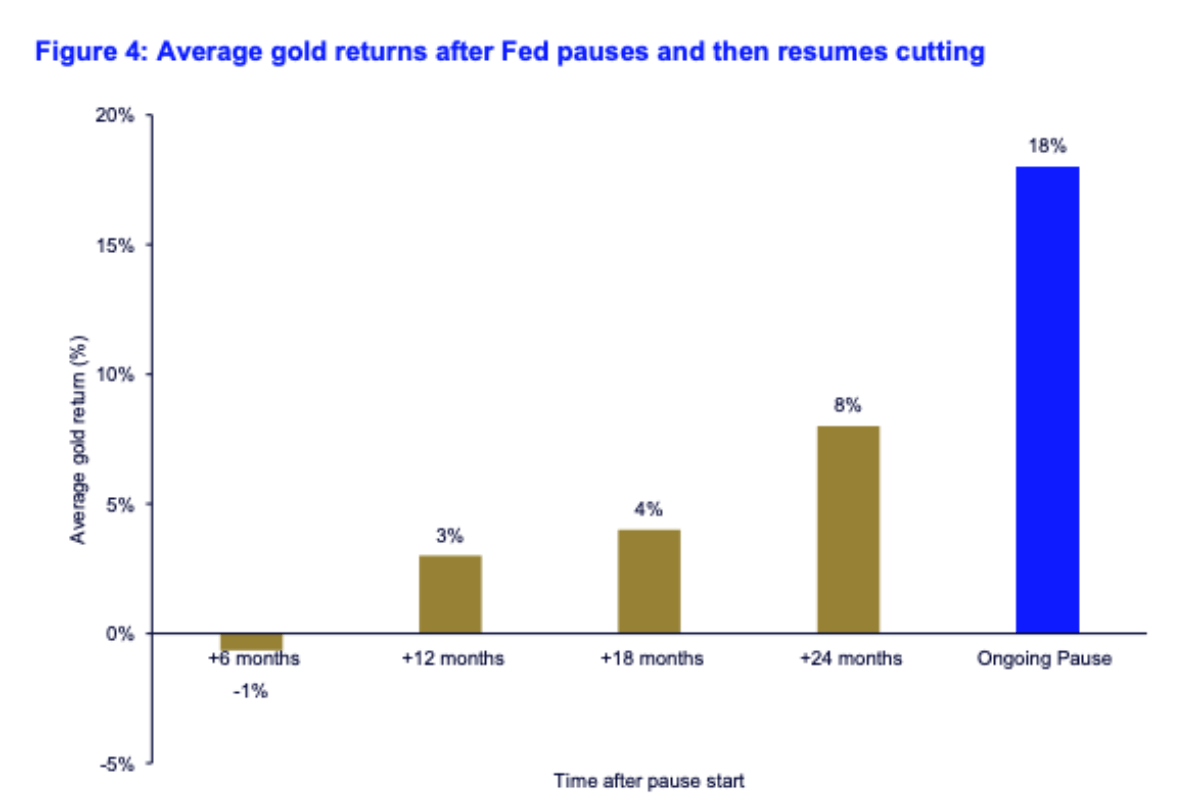
Post pause
State Street’s analysis shows gold tends to show consistently positive returned 12, 18 and 24 months after the start of any rate pause and easing cycle.
As bond markets price in a Fed turning more dovish – 2-3 cuts are anticipated by year’s end – the correlation between a weakening US dollar and higher gold price should provide momentum for bullion.
“To be sure, gold prices rallied sharply in the back half of August, able to close the month out at record highs near US$3450/oz. We see a 50/50 probability of a break towards US$3600-3700 before quarter-end,” Doshi and his team said.
The current rate pause has already delivered an 18% rise in gold prices, well above historic norms.
It also appears as though investors are pricing in macro risks.
Despite concerns about its rise as a challenger to gold as a store of value, August ETF flows show gold ETFS posted US$4bn inflows against US$900m of net redemptions for Bitcoin ETFs.
“One month is hardly a trend, but as the mid-February to mid-April market sell-off showed, high quality liquid alternatives like gold can be portfolio safe havens during sharp volatility spikes,” State Street’s Doshi and his team said.
“The August outflow trend in bitcoin is more puzzling given record equity market valuations heading into month-end and regulatory policy tailwinds for the crypto sector.
“To that end, investors might be reducing gross leverage on right tail outcomes at current high valuations and possibly seeking left tail hedges as “stagflation” risk creeps higher. The recent divergence is worth monitoring.”
The World Gold Council says the prospect of falling rates and higher inflation, leading to rising real rates, is reflected in stagflation concerns as well, typically a strong environment for gold.
Developers in focus
But not all gold investments and gold miners are made the same.
Where is it worth playing the narrative of rising gold prices?
Argonaut’s Patrick Streater and Hayden Bairstow used the opportunity to pick out some of their favourite developers, with the strongest share price movements now coming from the late stage developer cohort on the ASX.
“The 6-month share price performance for gold developers and explorers indicates improving valuations across the board, reducing the gap between producers and developers,” they said in the note.
“We expect developers targeting gold production in the next 12 months will garner more attention in the market.”
Despite higher gold prices, exploration spending hasn’t followed.
“Mine site and late-stage feasibility spend, dominated by producers, remains healthy, although still off from its peak in 2022,” Streater and Bairstow said.
“Despite the Australian gold price trading nearly 3x higher than a decade ago, greenfields exploration remains stagnant, with similar spend levels to 2013/2014.
“The lack of greenfields spend will continue to translate into a shortage of new discoveries, making any new greenfield discovery in Australia all the more valuable.”
Among their Australian based key picks is Magnetic Resources (ASX:MAU), which has delivered a DFS for its Lady Julie project near Laverton in WA outlining a nine year mine producing 113,000ozpa and 140,000ozpa at its peak from years 3-7.
FID is due late 2025 or early 2026, though Streater and Bairstow also view Magnetic as an attractive takeover target.
Other key picks include New Murchison Gold (ASX:NMG), which has begun mining at its Crown Prince project and will produce 140,000oz through major shareholder Westgold Resources’ (ASX:WGX) Bluebird mill over the next 2.5 years – generating an estimated $250m in free cash at spot prices according to Argonaut.
And then there’s Tim Goyder’s Minerals 260 (ASX:MI6), which bought the 2.3Moz Bullabulling gold mine near Coolgardie off Zijin this year.
Of its international picks, Argonaut likes Ivory Coast focused WIA Gold (ASX:WIA) and Turaco Gold (ASX:TCG), as well as PNG developer Tolu Minerals (ASX:TOK).
And at the earlier stage the broker’s analysts are keeping tabs on Marble Bar explorer Kali Metals (ASX:KM1) and TSX-V listed AMARC Resources, which is drilling what looks like a large scale open pittable deposit in British Columbia called AuRORA.
Other developers Argonaut thinks could garner attention are Muchison gold project owner Meeka Metals (ASX:MEK), Robex Resources Inc (ASX:RXR) and Lefroy Exploration (ASX:LEX).
Winners and losers
Here’s how ASX-listed precious metals stocks are performing:
| CODE | COMPANY | PRICE | WEEK % | MONTH % | 6 MONTH % | YEAR % | YTD % | MARKET CAP |
|---|---|---|---|---|---|---|---|---|
| MRR | Minrex Resources Ltd | 0.009 | 6% | 0% | 13% | 0% | 29% | $ 9,763,807.53 |
| NPM | Newpeak Metals | 0.019 | 12% | -14% | 58% | 46% | 73% | $ 5,266,293.18 |
| MTC | Metalstech Ltd | 0.185 | 9% | 42% | 68% | -29% | 32% | $ 42,190,442.40 |
| GED | Golden Deeps | 0.055 | 22% | 150% | 150% | -26% | 120% | $ 8,856,285.05 |
| G88 | Golden Mile Res Ltd | 0.0085 | 6% | 6% | -6% | -6% | -6% | $ 5,007,080.26 |
| LAT | Latitude 66 Limited | 0.065 | 55% | 55% | -2% | -38% | 71% | $ 6,739,833.14 |
| NMR | Native Mineral Res | 0.14 | 4% | 8% | 97% | 509% | 259% | $ 146,799,304.35 |
| AQX | Alice Queen Ltd | 0.0045 | -10% | 50% | -36% | -50% | -44% | $ 5,538,784.76 |
| SLZ | Sultan Resources Ltd | 0.007 | 0% | 40% | -13% | 17% | 17% | $ 1,827,584.94 |
| KSN | Kingston Resources | 0.1275 | 6% | -6% | 72% | 72% | 80% | $ 105,005,047.88 |
| AMI | Aurelia Metals Ltd | 0.22 | 7% | 19% | 7% | 52% | 29% | $ 355,440,254.40 |
| GIB | Gibb River Diamonds | 0.056 | 22% | 22% | 51% | 56% | 40% | $ 13,085,076.15 |
| KCN | Kingsgate Consolid. | 3.01 | 6% | 20% | 123% | 136% | 134% | $ 770,677,559.08 |
| TMX | Terrain Minerals | 0.0025 | 0% | -17% | -38% | -17% | -17% | $ 6,454,535.68 |
| BNR | Bulletin Res Ltd | 0.059 | 26% | 13% | 40% | 31% | 51% | $ 17,616,799.38 |
| NXM | Nexus Minerals Ltd | 0.078 | 32% | 30% | 37% | 90% | 73% | $ 44,376,331.56 |
| SKY | SKY Metals Ltd | 0.081 | 3% | 21% | 65% | 161% | 50% | $ 66,729,021.43 |
| LM8 | Lunnonmetalslimited | 0.28 | 12% | 4% | 37% | 70% | 12% | $ 59,569,606.98 |
| CST | Castile Resources | 0.064 | 5% | 8% | 5% | -20% | -20% | $ 19,567,909.12 |
| YRL | Yandal Resources | 0.175 | 23% | 25% | 13% | 46% | 0% | $ 54,116,121.85 |
| FAU | First Au Ltd | 0.006 | 20% | 0% | 200% | 200% | 200% | $ 15,698,908.24 |
| ARL | Ardea Resources Ltd | 0.49 | 7% | 21% | 5% | 10% | 48% | $ 108,362,651.23 |
| GWR | GWR Group Ltd | 0.1 | 2% | -5% | 9% | 28% | 25% | $ 32,360,665.50 |
| IVR | Investigator Res Ltd | 0.027 | 4% | 8% | 29% | -18% | 35% | $ 48,515,961.51 |
| AMU | American Uranium | 0.125 | -4% | 4% | 4% | -22% | -11% | $ 13,925,244.32 |
| IPT | Impact Minerals | 0.008 | -11% | -11% | 14% | -35% | -15% | $ 37,019,969.71 |
| BNZ | Benzmining | 1.18 | 4% | 70% | 199% | 808% | 242% | $ 233,237,939.60 |
| MOH | Moho Resources | 0.006 | 20% | 50% | 50% | 0% | 20% | $ 4,472,484.16 |
| MRZ | Mont Royal Resources | 0.041 | 0% | 0% | 0% | -32% | -5% | $ 3,486,221.51 |
| SMS | Starmineralslimited | 0.053 | -9% | 112% | 71% | 83% | 47% | $ 9,466,973.30 |
| MVL | Marvel Gold Limited | 0.018 | -5% | 50% | 80% | 125% | 100% | $ 21,291,885.69 |
| PRX | Prodigy Gold NL | 0.003 | 0% | 50% | 50% | 50% | 50% | $ 20,225,588.05 |
| AAU | Antilles Gold Ltd | 0.0065 | 8% | 8% | 30% | 63% | 117% | $ 15,075,408.10 |
| CWX | Carawine Resources | 0.09 | 0% | -3% | -6% | -5% | -10% | $ 21,251,290.41 |
| RND | Rand Mining Ltd | 2.1 | 16% | 20% | 24% | 30% | 39% | $ 113,751,922.00 |
| CAZ | Cazaly Resources | 0.026 | 8% | 13% | 86% | 86% | 86% | $ 11,191,271.78 |
| BMR | Ballymore Resources | 0.16 | 7% | -6% | 33% | 60% | 33% | $ 30,927,441.45 |
| DRE | Dreadnought Resources Ltd | 0.017 | 42% | 55% | 0% | 6% | 42% | $ 81,272,000.00 |
| ZNC | Zenith Minerals Ltd | 0.06 | 3% | 82% | 43% | 50% | 50% | $ 31,767,329.82 |
| REZ | Resourc & En Grp Ltd | 0.02 | 0% | 25% | -17% | -17% | -13% | $ 14,949,451.76 |
| LEX | Lefroy Exploration | 0.115 | -8% | -15% | 31% | 39% | 64% | $ 29,810,416.56 |
| ERM | Emmerson Resources | 0.21 | 8% | 20% | 91% | 304% | 173% | $ 127,137,568.80 |
| ADT | Adriatic Metals | 6.22 | 0% | 6% | 40% | 127% | 59% | $ 1,876,663,051.74 |
| AS1 | Asara Resources Ltd | 0.076 | 27% | 55% | 138% | 660% | 300% | $ 108,741,312.41 |
| CYL | Catalyst Metals | 7.73 | 9% | 40% | 83% | 261% | 200% | $ 1,800,605,700.12 |
| CHN | Chalice Mining Ltd | 1.75 | 0% | 8% | 31% | 77% | 58% | $ 735,409,566.99 |
| KAL | Kalgoorliegoldmining | 0.048 | 26% | 26% | -27% | 100% | 167% | $ 17,943,943.03 |
| MLS | Metals Australia | 0.019 | -7% | 0% | 0% | -10% | -17% | $ 13,845,670.96 |
| SRN | Surefire Rescs NL | 0.0015 | 50% | -40% | -40% | -70% | -49% | $ 5,860,288.88 |
| WA8 | Warriedarresourltd | 0.175 | 9% | 21% | 298% | 173% | 298% | $ 208,489,992.38 |
| HMX | Hammer Metals Ltd | 0.032 | 14% | 19% | 3% | -20% | -3% | $ 30,183,795.80 |
| WCN | White Cliff Min Ltd | 0.024 | -8% | -4% | 33% | 50% | 50% | $ 58,521,267.50 |
| AVM | Advance Metals Ltd | 0.047 | 12% | 7% | 7% | 96% | 38% | $ 13,389,795.36 |
| ASRDD | Asra Minerals Ltd | 0.024 | 140% | 20% | -20% | -60% | -20% | $ 9,600,475.20 |
| ARI | Arika Resources | 0.039 | -15% | 3% | 5% | 95% | 44% | $ 35,412,457.43 |
| CTO | Citigold Corp Ltd | 0.007 | 75% | 100% | 75% | 75% | 75% | $ 18,000,000.00 |
| SMI | Santana Minerals Ltd | 0.71 | 15% | 18% | 30% | 28% | 46% | $ 557,662,691.93 |
| M2R | Miramar | 0.003 | 0% | -25% | 0% | -77% | 0% | $ 3,584,769.73 |
| MHC | Manhattan Corp Ltd | 0.021 | -5% | -16% | 11% | 5% | 11% | $ 12,262,219.68 |
| GRL | Godolphin Resources | 0.012 | -14% | 9% | -8% | -14% | -17% | $ 7,240,024.65 |
| SVG | Savannah Goldfields | 0.014 | -13% | -13% | -7% | -24% | -24% | $ 19,824,843.35 |
| EMC | Everest Metals Corp | 0.125 | 0% | 14% | -24% | 19% | -7% | $ 25,895,844.33 |
| GUL | Gullewa Limited | 0.068 | -7% | -3% | 5% | 5% | 21% | $ 14,825,507.70 |
| CY5 | Cygnus Metals Ltd | 0.093 | 15% | 0% | -23% | 39% | -7% | $ 91,540,547.25 |
| G50 | G50Corp Ltd | 0.275 | 2% | -7% | 112% | 96% | 77% | $ 56,069,344.52 |
| ADV | Ardiden Ltd | 0.165 | 6% | 0% | 10% | 27% | 22% | $ 10,002,800.96 |
| AAR | Astral Resources NL | 0.165 | 0% | 6% | 18% | 57% | 22% | $ 235,589,458.17 |
| VMC | Venus Metals Cor Ltd | 0.12 | 9% | 20% | 32% | 97% | 79% | $ 23,535,441.96 |
| NAE | New Age Exploration | 0.003 | 0% | -14% | -40% | -25% | -14% | $ 8,117,734.22 |
| VKA | Viking Mines Ltd | 0.007 | 0% | 0% | -13% | -13% | -13% | $ 9,407,641.24 |
| LCL | LCL Resources Ltd | 0.007 | 17% | 17% | -22% | -22% | -30% | $ 8,394,800.06 |
| MTH | Mithril Silver Gold | 0.67 | 4% | 43% | 97% | 538% | 68% | $ 113,649,583.47 |
| ADG | Adelong Gold Limited | 0.005 | 0% | 0% | 25% | 0% | 11% | $ 11,584,181.81 |
| RMX | Red Mount Min Ltd | 0.008 | 0% | 0% | -11% | -20% | -11% | $ 4,761,736.64 |
| PRS | Prospech Limited | 0.02 | 15% | -10% | -17% | -31% | -28% | $ 7,576,517.74 |
| TTM | Titan Minerals | 0.435 | -1% | 45% | 9% | 0% | 14% | $ 117,317,567.70 |
| AKA | Aureka Limited | 0.092 | 2% | -8% | -41% | -99% | -32% | $ 11,596,625.85 |
| AAM | Aumegametals | 0.031 | -9% | -16% | -35% | -35% | -26% | $ 18,787,571.61 |
| KZR | Kalamazoo Resources | 0.125 | 4% | 14% | 74% | 56% | 69% | $ 28,393,888.20 |
| BCN | Beacon Minerals | 2.26 | 1% | 81% | 126% | 146% | 157% | $ 232,569,968.40 |
| MAU | Magnetic Resources | 1.31 | 4% | -15% | 1% | -6% | 19% | $ 376,463,328.90 |
| BC8 | Black Cat Syndicate | 0.99 | 13% | 19% | 17% | 179% | 75% | $ 683,981,688.98 |
| EM2 | Eagle Mountain | 0.006 | 0% | 0% | 0% | -83% | -33% | $ 7,945,261.02 |
| EMR | Emerald Res NL | 4.12 | 10% | 19% | 6% | 10% | 27% | $ 2,639,160,492.00 |
| BYH | Bryah Resources Ltd | 0.005 | 0% | 0% | 67% | 0% | 67% | $ 4,114,130.12 |
| HCH | Hot Chili Ltd | 0.89 | 7% | 54% | 31% | 10% | 28% | $ 133,730,731.95 |
| WAF | West African Res Ltd | 3.04 | 0% | 30% | 72% | 124% | 112% | $ 3,468,728,844.00 |
| MEU | Marmota Limited | 0.0415 | 6% | 12% | -14% | 15% | 6% | $ 49,488,843.18 |
| NVA | Nova Minerals Ltd | 0.3 | 3% | 0% | 15% | 107% | -19% | $ 122,457,932.19 |
| SVL | Silver Mines Limited | 0.145 | 16% | 12% | 86% | 54% | 86% | $ 308,637,484.52 |
| PGD | Peregrine Gold | 0.29 | 7% | -2% | 152% | 66% | 107% | $ 25,878,561.01 |
| ICL | Iceni Gold | 0.062 | -5% | -5% | -14% | 59% | -13% | $ 21,284,685.99 |
| FG1 | Flynngold | 0.029 | 7% | 4% | 7% | 12% | 16% | $ 10,956,861.16 |
| WWI | West Wits Mining Ltd | 0.037 | 9% | 68% | 106% | 147% | 164% | $ 125,312,497.95 |
| RML | Resolution Minerals | 0.057 | 0% | -25% | 613% | 256% | 375% | $ 71,510,498.15 |
| AAJ | Aruma Resources Ltd | 0.009 | 13% | 20% | 0% | -44% | -25% | $ 2,623,524.20 |
| HWK | Hawk Resources. | 0.017 | 13% | 0% | -26% | -32% | -23% | $ 4,605,800.63 |
| GMN | Gold Mountain Ltd | 0.092 | 30% | 48% | -8% | -47% | -39% | $ 11,967,035.39 |
| MEG | Megado Minerals Ltd | 0.03 | -3% | -6% | 100% | 162% | 76% | $ 19,370,497.86 |
| HMG | Hamelingoldlimited | 0.078 | 7% | 42% | 42% | 4% | 22% | $ 15,665,982.11 |
| BM8 | Battery Age Minerals | 0.079 | 1% | 18% | 14% | -37% | -25% | $ 11,840,542.19 |
| TBR | Tribune Res Ltd | 5.34 | 11% | 14% | 12% | 36% | 24% | $ 280,179,531.18 |
| FML | Focus Minerals Ltd | 0.585 | 15% | 58% | 200% | 333% | 244% | $ 166,204,014.10 |
| VRC | Volt Resources Ltd | 0.004 | 0% | 0% | 0% | 0% | 33% | $ 18,739,397.64 |
| ARV | Artemis Resources | 0.007 | 17% | 40% | -13% | -42% | -13% | $ 17,194,032.99 |
| HRN | Horizon Gold Ltd | 0.555 | 16% | 14% | 36% | 83% | 16% | $ 94,152,323.99 |
| CLA | Celsius Resource Ltd | 0.009 | 0% | 38% | -10% | -25% | -18% | $ 28,219,396.07 |
| QML | Qmines Limited | 0.054 | -2% | 6% | 20% | -18% | 0% | $ 25,496,707.23 |
| RDN | Raiden Resources Ltd | 0.0045 | 13% | 13% | -25% | -84% | -59% | $ 13,803,565.77 |
| TCG | Turaco Gold Limited | 0.48 | 1% | 9% | 48% | 96% | 88% | $ 504,417,248.16 |
| KCCDA | Kincora Copper | 0.85 | 29% | 27% | 227% | 68% | 215% | $ 23,547,909.00 |
| GBZ | GBM Rsources Ltd | 0.034 | 21% | 55% | 325% | 386% | 325% | $ 131,771,579.05 |
| DTM | Dart Mining NL | 0.0025 | 0% | -17% | -50% | -84% | -72% | $ 3,436,315.41 |
| MKR | Manuka Resources. | 0.042 | 0% | -11% | 53% | 30% | 53% | $ 43,680,778.97 |
| AUC | Ausgold Limited | 0.865 | 7% | 57% | 88% | 122% | 106% | $ 351,910,153.71 |
| ANX | Anax Metals Ltd | 0.007 | 0% | 0% | -13% | -63% | -42% | $ 6,179,652.97 |
| EMU | EMU NL | 0.023 | -21% | 10% | -21% | 12% | -15% | $ 5,703,708.64 |
| SFM | Santa Fe Minerals | 0.225 | 0% | -4% | 449% | 463% | 626% | $ 15,656,039.64 |
| PNR | Pantoro Gold Limited | 4.82 | 2% | 27% | 110% | 170% | 215% | $ 1,927,544,635.23 |
| CMM | Capricorn Metals | 11.25 | 7% | 24% | 45% | 105% | 79% | $ 4,790,943,016.80 |
| VRL | Verity Resources | 0.024 | -13% | 9% | 54% | -18% | 23% | $ 6,997,386.70 |
| HAW | Hawthorn Resources | 0.057 | 4% | 8% | 30% | -8% | 39% | $ 19,095,889.94 |
| BGD | Bartongoldholdings | 0.9 | 7% | 24% | 200% | 291% | 267% | $ 196,329,120.72 |
| SVY | Stavely Minerals Ltd | 0.014 | -13% | 0% | -22% | -46% | -18% | $ 10,196,345.73 |
| AGC | AGC Ltd | 0.22 | 5% | 47% | 28% | -17% | 42% | $ 57,661,388.84 |
| RGL | Riversgold | 0.004 | 0% | 0% | -20% | -11% | 0% | $ 6,734,850.37 |
| TSO | Tesoro Gold Ltd | 0.043 | 8% | 43% | 48% | 54% | 115% | $ 80,587,368.28 |
| GUE | Global Uranium | 0.053 | -9% | -15% | -22% | -4% | -12% | $ 24,101,997.67 |
| CPM | Coopermetalslimited | 0.054 | -7% | 4% | 29% | -16% | 17% | $ 4,309,560.75 |
| MM8 | Medallion Metals. | 0.405 | 25% | 62% | 170% | 650% | 238% | $ 226,351,201.85 |
| FFM | Firefly Metals Ltd | 1.23 | 2% | 18% | 29% | 42% | 33% | $ 822,596,180.56 |
| CBY | Canterbury Resources | 0.022 | 5% | -15% | -4% | -33% | 0% | $ 4,563,699.71 |
| SLA | Solara Minerals | 0.2 | -5% | -13% | 43% | -23% | 122% | $ 11,254,616.37 |
| SFR | Sandfire Resources | 12.35 | -1% | 13% | 16% | 54% | 33% | $ 5,641,993,159.40 |
| TAM | Tanami Gold NL | 0.057 | 0% | 0% | 111% | 78% | 90% | $ 66,980,531.62 |
| NWM | Norwest Minerals | 0.012 | -11% | -4% | 17% | -33% | 0% | $ 13,391,390.36 |
| ALK | Alkane Resources Ltd | 1.12 | 7% | 59% | 85% | 191% | 120% | $ 1,542,311,759.19 |
| BMO | Bastion Minerals | 0.0015 | 0% | 0% | -52% | -68% | -52% | $ 3,307,429.64 |
| IDA | Indiana Resources | 0.04 | -2% | 6% | 33% | 90% | 57% | $ 25,749,298.32 |
| GSM | Golden State Mining | 0.012 | 0% | 33% | 33% | 20% | 50% | $ 3,352,447.56 |
| NSM | Northstaw | 0.03 | -6% | 0% | 5% | 186% | 90% | $ 10,228,418.10 |
| GSN | Great Southern | 0.03 | 20% | 15% | 36% | 58% | 100% | $ 27,910,520.12 |
| VAU | Vault Minerals Ltd | 0.6 | 13% | 52% | 50% | 107% | 82% | $ 3,877,409,827.74 |
| CDR | Codrus Minerals Ltd | 0.024 | 0% | -8% | 41% | -20% | 41% | $ 5,168,359.48 |
| MDI | Middle Island Res | 0.046 | 130% | 171% | 171% | 318% | 283% | $ 11,729,358.84 |
| WTM | Waratah Minerals Ltd | 0.69 | -5% | 75% | 331% | 82% | 345% | $ 189,946,234.13 |
| POL | Polymetals Resources | 0.88 | 14% | 16% | 38% | 267% | 11% | $ 234,336,967.38 |
| RDS | Redstone Resources | 0.005 | 0% | 67% | 67% | 11% | 100% | $ 5,171,336.78 |
| NAG | Nagambie Resources | 0.014 | 8% | -18% | -13% | -33% | -22% | $ 12,538,540.52 |
| BGL | Bellevue Gold Ltd | 0.915 | 5% | 11% | -21% | -20% | -19% | $ 1,295,655,298.88 |
| GBR | Greatbould Resources | 0.066 | 10% | 12% | -7% | 40% | 53% | $ 59,927,302.49 |
| KAI | Kairos Minerals Ltd | 0.024 | 2% | 4% | 33% | 118% | 100% | $ 67,347,804.73 |
| KAU | Kaiser Reef | 0.225 | 10% | 32% | 41% | 61% | 41% | $ 130,580,153.00 |
| HRZ | Horizon | 0.053 | 8% | 10% | -13% | 29% | 33% | $ 153,109,913.05 |
| CDT | Castle Minerals | 0.075 | 10% | 25% | 25% | -38% | 25% | $ 10,845,717.75 |
| RSG | Resolute Mining | 0.7 | 7% | 10% | 89% | 12% | 77% | $ 1,469,490,248.97 |
| EVN | Evolution Mining Ltd | 9.06 | 7% | 25% | 45% | 131% | 88% | $ 18,122,262,372.00 |
| CXU | Cauldron Energy Ltd | 0.009 | 29% | 13% | -8% | -37% | -23% | $ 12,524,127.05 |
| DLI | Delta Lithium | 0.17 | -3% | 10% | 3% | -17% | 0% | $ 125,515,563.60 |
| ALY | Alchemy Resource Ltd | 0.008 | 14% | 60% | 0% | 33% | 14% | $ 9,424,610.05 |
| NH3 | Nh3Cleanenergyltd | 0.041 | -20% | -32% | 86% | 64% | 128% | $ 27,134,115.20 |
| OBM | Ora Banda Mining Ltd | 1.08 | 26% | 67% | 17% | 91% | 66% | $ 1,859,526,947.75 |
| AVW | Avira Resources Ltd | 0.01 | 25% | 67% | 25% | -50% | -50% | $ 2,300,000.00 |
| LCY | Legacy Iron Ore | 0.008 | -11% | -20% | -27% | -36% | -20% | $ 78,096,340.67 |
| PDI | Predictive Disc Ltd | 0.46 | 2% | 7% | 37% | 114% | 100% | $ 1,180,110,571.20 |
| MAT | Matsa Resources | 0.094 | 25% | 29% | 65% | 248% | 169% | $ 68,513,318.19 |
| ZAG | Zuleika Gold Ltd | 0.026 | 30% | 30% | 136% | 73% | 100% | $ 20,912,637.96 |
| GML | Gateway Mining | 0.063 | 19% | 142% | 200% | 200% | 200% | $ 99,258,655.34 |
| SBM | St Barbara Limited | 0.38 | 6% | 36% | 65% | 65% | 69% | $ 400,972,294.48 |
| SBR | Sabre Resources | 0.012 | 0% | 20% | 50% | -14% | 20% | $ 4,733,543.20 |
| STK | Strickland Metals | 0.145 | 7% | 20% | 113% | 80% | 91% | $ 311,074,472.09 |
| CEL | Challenger Gold Ltd | 0.13 | 8% | 43% | 132% | 132% | 177% | $ 272,060,566.50 |
| GG8 | Gorilla Gold Mines | 0.43 | 4% | 4% | 18% | 260% | 65% | $ 281,108,347.41 |
| NST | Northern Star | 19.94 | 6% | 23% | 14% | 37% | 29% | $ 28,172,154,400.30 |
| OZM | Ozaurum Resources | 0.061 | -8% | -23% | -6% | 42% | 103% | $ 13,975,214.25 |
| TG1 | Techgen Metals Ltd | 0.03 | -17% | 57% | 9% | -2% | -10% | $ 4,601,305.59 |
| AQI | Alicanto Min Ltd | 0.039 | 3% | 44% | 22% | 179% | 5% | $ 31,381,290.11 |
| KTA | Krakatoa Resources | 0.011 | -27% | -8% | 10% | 22% | 16% | $ 9,337,608.30 |
| ARN | Aldoro Resources | 0.4 | 21% | 23% | 4% | 355% | 5% | $ 84,913,650.90 |
| WGX | Westgold Resources. | 3.72 | 9% | 44% | 51% | 35% | 31% | $ 3,397,208,803.20 |
| MBK | Metal Bank Ltd | 0.015 | 7% | 25% | 7% | -11% | 0% | $ 6,964,425.97 |
| A8G | Australasian Metals | 0.072 | -17% | 0% | -3% | -45% | -9% | $ 4,168,060.20 |
| TAR | Taruga Minerals | 0.011 | 0% | 22% | 10% | 38% | 10% | $ 8,565,048.70 |
| DTR | Dateline Resources | 0.24 | -9% | 78% | 7900% | 4264% | 6757% | $ 758,575,079.34 |
| GOR | Gold Road Res Ltd | 3.4 | 2% | 7% | 37% | 117% | 66% | $ 3,682,892,813.40 |
| S2R | S2 Resources | 0.11 | 16% | 64% | 77% | 21% | 64% | $ 57,668,939.49 |
| NES | Nelson Resources. | 0.003 | 0% | 0% | 0% | -25% | 0% | $ 6,515,782.98 |
| TLM | Talisman Mining | 0.15 | 0% | 3% | -17% | -29% | -27% | $ 27,306,450.61 |
| BEZ | Besragoldinc | 0.041 | -2% | -13% | 14% | -55% | -54% | $ 17,866,422.82 |
| PRU | Perseus Mining Ltd | 4.25 | 10% | 27% | 41% | 76% | 65% | $ 5,539,782,276.90 |
| SPQ | Superior Resources | 0.0045 | -10% | -10% | -36% | -59% | -25% | $ 11,854,913.63 |
| PUR | Pursuit Minerals | 0.071 | -10% | 8% | 0% | -53% | -26% | $ 7,163,944.73 |
| RMS | Ramelius Resources | 3.43 | 11% | 32% | 28% | 67% | 66% | $ 6,408,767,314.50 |
| PKO | Peako Limited | 0.003 | -14% | 20% | 0% | 0% | 0% | $ 5,207,096.86 |
| RKB | Rokeby Resources Ltd | 0.009 | -10% | -25% | 50% | 80% | 80% | $ 16,432,936.25 |
| A1G | African Gold Ltd. | 0.305 | 7% | 42% | 384% | 853% | 455% | $ 156,756,501.74 |
| NMG | New Murchison Gold | 0.024 | 20% | 41% | 140% | 380% | 167% | $ 226,427,073.50 |
| GNM | Great Northern | 0.068 | -3% | 325% | 353% | 386% | 386% | $ 14,078,330.64 |
| KRM | Kingsrose Mining Ltd | 0.042 | 0% | 2% | 20% | 11% | 20% | $ 33,155,166.84 |
| BTR | Brightstar Resources | 0.43 | 9% | -1% | -4% | 8% | -14% | $ 240,389,543.07 |
| RRL | Regis Resources | 5.09 | 7% | 23% | 58% | 193% | 100% | $ 3,649,955,599.18 |
| M24 | Mamba Exploration | 0.015 | -6% | 0% | 15% | 0% | 25% | $ 4,427,484.15 |
| TRM | Truscott Mining Corp | 0.047 | 9% | -10% | -32% | -22% | -40% | $ 9,001,673.76 |
| TNC | True North Copper | 0.345 | -9% | 1% | -1% | -90% | -89% | $ 43,947,061.86 |
| KNB | Koonenberrygold | 0.04 | -5% | 3% | 29% | 300% | 233% | $ 44,180,780.56 |
| AWJ | Auric Mining | 0.18 | -5% | 6% | -32% | -33% | -47% | $ 37,196,220.40 |
| ENR | Encounter Resources | 0.35 | 3% | 32% | 43% | -26% | 8% | $ 169,973,588.46 |
| SNG | Siren Gold | 0.072 | 3% | 47% | 33% | 11% | 11% | $ 18,529,742.63 |
| STN | Saturn Metals | 0.45 | 5% | 8% | 125% | 125% | 120% | $ 211,627,702.12 |
| USL | Unico Silver Limited | 0.48 | 25% | 23% | 182% | 191% | 146% | $ 239,404,993.69 |
| PNM | Pacific Nickel Mines | 0.024 | 0% | 0% | 0% | 0% | 0% | $ 10,103,834.52 |
| AYM | Australia United Min | 0.003 | 0% | 50% | 0% | 50% | -25% | $ 5,527,732.46 |
| HAV | Havilah Resources | 0.18 | 3% | 0% | -8% | 3% | -20% | $ 62,066,133.36 |
| PNT | Panthermetalsltd | 0.01 | 11% | 18% | -33% | -57% | -9% | $ 2,708,140.93 |
| MEK | Meeka Metals Limited | 0.18 | 24% | 29% | 44% | 227% | 134% | $ 496,201,128.90 |
| GMD | Genesis Minerals | 5.36 | 19% | 43% | 67% | 159% | 117% | $ 5,744,403,329.56 |
| PGO | Pacgold | 0.06 | -9% | -6% | 0% | -26% | -20% | $ 15,133,624.96 |
| FEG | Far East Gold | 0.145 | -6% | -19% | -6% | -12% | -19% | $ 55,054,117.95 |
| MI6 | Minerals260Limited | 0.15 | 15% | 30% | 15% | 7% | 15% | $ 289,426,666.62 |
| IGO | IGO Limited | 4.85 | -5% | 5% | 22% | -4% | 2% | $ 3,612,167,468.01 |
| GAL | Galileo Mining Ltd | 0.18 | 9% | 20% | 24% | 9% | 44% | $ 34,584,362.23 |
| RXL | Rox Resources | 0.42 | 18% | 50% | 75% | 223% | 110% | $ 295,105,557.02 |
| PTN | Patronus Resources | 0.064 | 3% | -4% | 7% | 21% | 31% | $ 91,714,852.90 |
| CLZ | Classic Min Ltd | 0.001 | 0% | 0% | 0% | 0% | 0% | $ 3,017,699.21 |
| TGM | Theta Gold Mines Ltd | 0.175 | -3% | 4% | 13% | 30% | -3% | $ 168,466,344.30 |
| FAL | Falconmetalsltd | 0.875 | -11% | 79% | 775% | 192% | 661% | $ 194,570,199.71 |
| SPD | Southernpalladium | 0.66 | 10% | -1% | 53% | 83% | 10% | $ 71,121,750.00 |
| ORN | Orion Minerals Ltd | 0.013 | 30% | 30% | -19% | -19% | -13% | $ 97,531,224.02 |
| TMB | Tambourahmetals | 0.044 | -6% | 22% | 57% | 12% | 110% | $ 7,670,666.34 |
| TMS | Tennant Minerals Ltd | 0.006 | 0% | 0% | -57% | -67% | -33% | $ 6,395,342.49 |
| AZY | Antipa Minerals Ltd | 0.665 | 8% | 23% | 87% | 412% | 156% | $ 414,440,328.96 |
| PXX | Polarx Limited | 0.016 | 0% | 14% | 100% | 60% | 146% | $ 38,008,015.65 |
| TRE | Toubani Res Ltd | 0.33 | 5% | 0% | 120% | 69% | 94% | $ 115,830,536.58 |
| AUN | Aurumin | 0.105 | 13% | 5% | 62% | 163% | 59% | $ 50,031,962.70 |
| GPR | Geopacific Resources | 0.029 | -6% | 7% | 45% | 30% | 45% | $ 92,291,494.45 |
| FXG | Felix Gold Limited | 0.275 | 49% | 72% | 139% | 235% | 227% | $ 103,137,460.59 |
| ILT | Iltani Resources Lim | 0.27 | 32% | 42% | 17% | 35% | 32% | $ 17,474,312.53 |
| BRX | Belararoxlimited | 0.115 | 5% | 39% | 24% | -61% | -34% | $ 17,819,887.47 |
| TM1 | Terra Metals Limited | 0.087 | 9% | 32% | 263% | 149% | 211% | $ 53,786,186.82 |
| TOR | Torque Met | 0.33 | 12% | 40% | 237% | 214% | 523% | $ 172,679,846.40 |
| ARD | Argent Minerals | 0.023 | 2% | 5% | 28% | 53% | 35% | $ 34,707,371.52 |
| LM1 | Leeuwin Metals Ltd | 0.175 | 17% | 17% | 59% | 116% | 25% | $ 16,129,021.44 |
| SX2 | Southgold Consol | 6.88 | 6% | 25% | 99% | 0% | 0% | $ 959,059,899.96 |
| UVA | Uvrelimited | 0.13 | -4% | 8% | 78% | 63% | 46% | $ 25,603,897.64 |
| VTX | Vertexmin | 0.32 | 33% | 45% | 21% | 167% | 54% | $ 65,321,750.16 |
| JAV | Javelin Minerals Ltd | 0.003 | 0% | 50% | 20% | 20% | 0% | $ 18,756,674.66 |
| OMX | Orangeminerals | 0.086 | 5% | 23% | 197% | 231% | 197% | $ 12,399,991.04 |
| FBM | Future Battery | 0.038 | 58% | 46% | 90% | 90% | 111% | $ 26,986,441.12 |
Gold medal performers
Who were some of the top precious metals names this week?
Middle Island Resources (ASX:MDI)
Once a big player in the Sandstone gold district with more recent sojourns in the NT and Queensland, Middle Island has packed its bags and flown off to Serbia.
Its sharp rise this week came off the back of the acquisition of three projects in the Balkans via a takeover of privately owned Konstantin Resources, comprising 620km2 of ground in the Western Tethyan belt.
The area is home to major players including Zijin, Dundee Precious Metals, which also recently bought out Adriatic Metals and its Vares silver mine in Bosnia, and ASX listed Strickland Metals (ASX:STK).
Konstantin’s team, which will move across into Middle Island, includes ex-Balkan team members from Dundee David A-Izzeddin and Dragan Dragic with exec chair Peter Spiers.
The acquisition has come alongside a $3.4m Cygnet Capital led placement.
The top-billing asset is Bobija, which sits across the border from Vares, which Dundee recently bought for US$1.25bn, with historical hits including:
- BB-02: 45.2m at 1.71g/t Au, 25.5g/t Ag, 0.87% Pb & 2.26% Zn
- BB-04: 16.0m at 1.58g/t Au, 83g/t Ag, 1.98% Pb & 2.29% Zn
- BB-06: 11.7m at 1.56g/t Au, 82g/t Ag, 2.71% Pb & 3.01% Zn
- BB-07: 15.1m at 1.91g/t Au, 122g/t Ag, 4.23% Pb & 4.73% Zn; and
- BB-09: 2.0m at 1.19g/t Au, 29g/t Ag, 0.48% Pb & 0.39% Zn.
RC drilling, trenching/rock chipping and geochemistry is either currently or planned to take place.
Asra shares lifted off the back of final assays at its Eclipse and Challenge prospects at Leonora South, boding well for a maiden resource estimate at Eclipse.
That would add to the explorer’s bounty, with the historic Orion and Sapphire gold mines already hosting a mineral resource estimate of 48,000oz at 2.2g/t Au.
Best hits at Eclipse included:
- 15m at 10.21 g/t Au from a 12m in hole NIC017;
- 6m at 3.54 g/t Au from 57m in hole NIC019;
- 9m at 3.22 g/t Au from 54m in hole NIC033;
- 9m at 2.56 g/t Au from 33m in hole NIC037;
- 6m at 2.32 g/t Au from 54m in hole NIC028; and
- 12m at 1.95 g/t Au from 33m in hole NIC018.
Standout results at Challenge include 6m at 3.56g/t Au from 36m in hole NIC044.
Even more weight was thrown behind Leonora South with the appointment of legendary geologist Ziggy Lubienicki as a non-executive technical director.
Lubienicki is regarded as one of the key figures behind the 6.2Moz Gruyere discovery with Gold Road Resources, which is among the three largest greenfield gold discoveries in WA this century.
At Stockhead, we tell it like it is. While Asra Minerals is a Stockhead advertiser, it did not sponsor this article.
Related Topics

Related Stories


UNLOCK INSIGHTS
Discover the untold stories of emerging ASX stocks.
Daily news and expert analysis, it's free to subscribe.
By proceeding, you confirm you understand that we handle personal information in accordance with our Privacy Policy.


