Bulk Buys: Goldman goes bearish, market goes bullish on iron ore

Pic: Davidrasmus/iStock via Getty Images
- Goldman Sachs analysts say iron ore prices could drop faster than expected on bearish steel sentiment
- But iron ore prices have strengthened as steel margins have improved and Chinese authorities have moved to support its property market and economy
- Coal miners hit multi-year highs as strong thermal prices continue
Goldman Sachs ruffled plenty of feathers back in May with their call that the battery metals sector was headed for a downturn.
So far the score has been lithium miners 1, investment banking wonks 0, but there’s plenty of water to go under that bridge still.
The lithium to US$16,000/t call was controversial for a few reasons.
Firstly, the market remains tightly supplied and is still in its infancy, making it small and opaque.
Secondly, despite the slowdown in the general economy, electric vehicle sales continue to *cough* accelerate.
Now GS’ overseas commodities faction has put a mozz out on its iron ore forecasts, tipping a surplus for the second half of 2022 of 67Mt against a 56Mt first half deficit.
The situation, which follows weak steel demand and falling property investment in beleaguered China, would see prices tumble from above US$100/t to US$70 and US$85/t over three and six months.
That’s a big leg down from previous estimates of US$90 and US$110/t.
The iron ore market is a bit different to lithium. It’s big, relatively transparent, and seeing major impacts from falling steel prices and property investment in China.
However
In recent days bearish sentiment that hit fever pitch when a bunch of Chinese property owners went rogue on their mortgage repayments a week or so ago has flipped.
Even with China setting up a new US$4.3 billion company to try to control iron ore purchases and pricing – that few analysts think will go quite as the CCP plans – prices have risen steadily over the past few days.
Of more import in the short term than the freshly labelled China Mineral Resources Corp are its efforts to bail out property developers in the hope of avoiding a more substantial hit to its already slowing economic growth.
Meanwhile, lower iron ore and coal prices have also improved the outlook for steelmakers, trimming margin losses that widened to US$70/t at the end of June.
Singapore traders were in party mode yesterday, sending 62% Fe iron ore futures 3.2% higher to 3pm AEST at US$108.80, a two-week high.
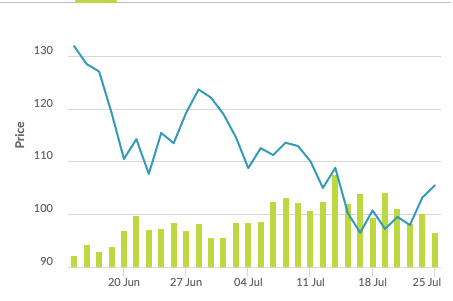
Dalian futures were looking frothy as well, surging in the afternoon session to a 4.09% gain.
That was good for Aussie miners.
The big three of BHP (ASX:BHP), Rio Tinto (ASX:RIO) and Fortescue Metals Group (ASX:FMG) were up 2.1%, 1.53% and 1.95%, respectively, while mid-tiers MinRes (ASX:MIN) and Champion Iron (ASX:CIA) surged 2.71% and 2.2% in kind.
What was behind the run above US$100/t?
The biggest factor appears to be a new fund set up by the China State Council to provide financial aid to the property sector.
“Concerns have eased after China’s State Council approved a plan late last week to set up a fund to provide financial support to a number of property developers,” Commbank mining expert Vivek Dhar said in a note to clients.
“The fund has already secured RMB 50bn. The fund can potentially be upsized to between RMB 200 to RMB 300bn.”
That would mean as much as $64 billion in Australian terms, though tumbling property sales mean infrastructure support and the relaxation of Covid Zero policy will likely be needed to provide demand support to iron ore.
“A meaningful relaxation of China’s COVID zero policy appears the most likely pathway to instil confidence back into China’s property sector. This outcome only looks like a possibility after China’s 20th National Congress in November,” Dhar says.
“Property construction accounts for ~30% of China’s steel demand and 20‑30% of China’s copper, aluminium and zinc consumption. With signs pointing to further weakness ahead for China’s property construction demand and other consumption‑related sectors, it is worth keeping an eye on how quickly infrastructure spending increases to prop up China’s economic growth.
“Bloomberg estimates that RMB 7.2 trillion has been set aside for infrastructure projects, well above the RMB 3.65 trillion allocated earlier this year for infrastructure projects via the annual quota for local government special bonds.”
Dhar noted China’s increasing non-manufacturing PMI is lifting, rising from 52.2 in May to 56.6 in June.
Meanwhile, there are signs inventory is starting to build again, with MySteel reporting portside iron ore stocks in China rose last week for the fourth straight week by 1.7Mt to 131.9Mt, hitting a month-high.
However, bad weather had been a factor, with some vessels at anchor finally securing berths at crowded ports.
Grange suffers from escalating costs
The last major iron ore player to report will be Fortescue tomorrow, but boutique high grade miner Grange Resources (ASX:GRR) sounded a little warning for investors on cost pressures yesterday.
Grange sells an ultra premium magnetite product from the Savage River mine in Tassie that generates extraordinarily high prices, shielding it in weaker iron ore markets.
But escalating fuel, labour and equipment costs have sent a jolt through investors becoming accustomed to thicc margins.
Grange shares lost 11.4% to 4pm AEST yesterday after Grange released its June quarter stats, revealing prices had dropped from US$224.30/t in the March quarter to just US$139.03/t in the June quarter.
Energy price increases also saw Grange’s costs rise from $104.24/t to $122.72/t, trimming headline margins from $203.48/t in the March quarter to $70.72/t in the three months to June 30.
Grange boasted cash and liquid investments to $369.47m with trade receivables of $8.52m as of June 30, down from $356.93m and $63.39m at March 31.
The company said income tax payments were the main cause of the cash drain.
“The past quarter has been challenging. Although the company have fixed-price contracts for a portion of its energy use, the current inflationary environment with elevated energy costs is resulting in increased cost pressures on the company,” GRR chairman Honglin Zhao said.
“In addition, iron prices along with the prices of many commodities are witnessing a significant decrease throughout the past quarter.
“Despite these headwinds, our team continues to focus on cost discipline, safe and effective production as we see through this difficult period.”
Also with news this week was Hawsons Iron (ASX:HIO), which increased its measured and indicated resources of magnetic fraction iron ore at its Hawsons project near Broken Hill by 87% from 132Mt to 247Mt, with 54Mt in the measured category.
Overall mineral resources increased 21% from 400Mt to 484Mt of concentrate equivalent from an in situ resource of 3.95Bt at 12.2% DTR.
Over in WA, fellow iron ore junior Fenix saw the departure of its managing director Rob Brierley, who steered the Iron Ridge mine owner to an unlikely $49 million profit and maiden dividend last year amid 2021’s historic iron ore boom.
It came shortly after the John Wellborn company completed a deal to buy out its haulage provider Newhaul.
| CODE | COMPANY | PRICE | 1 WEEK RETURN % | 1 MONTH RETURN % | 6 MONTH RETURN % | 1 YEAR RETURN % | MARKET CAP |
|---|---|---|---|---|---|---|---|
| ACS | Accent Resources NL | 0.046 | 0% | -23% | -15% | -10% | $ 21,437,255.02 |
| ADY | Admiralty Resources. | 0.008 | -20% | -20% | -33% | -56% | $ 10,428,633.22 |
| AKO | Akora Resources | 0.16 | -14% | -20% | -32% | -33% | $ 10,095,511.04 |
| BCK | Brockman Mining Ltd | 0.033 | -8% | -18% | -33% | -12% | $ 334,088,356.72 |
| BHP | BHP Group Limited | 38.27 | 4% | -4% | -5% | -16% | $ 189,077,771,146.50 |
| CIA | Champion Iron Ltd | 5.07 | 5% | -2% | -11% | -25% | $ 2,584,559,380.00 |
| CZR | CZR Resources Ltd | 0.015 | -6% | 25% | 114% | 36% | $ 55,781,172.43 |
| DRE | Dreadnought Resources Ltd | 0.059 | 28% | 48% | 69% | -5% | $ 170,321,013.06 |
| EFE | Eastern Resources | 0.027 | 8% | 13% | -54% | 80% | $ 27,844,225.67 |
| CUF | Cufe Ltd | 0.02 | 0% | 5% | -38% | -82% | $ 18,356,134.94 |
| FEX | Fenix Resources Ltd | 0.285 | 0% | -3% | 33% | -31% | $ 152,939,897.60 |
| FMG | Fortescue Metals Grp | 18.7 | 11% | 8% | -4% | -26% | $ 56,191,109,753.50 |
| FMS | Flinders Mines Ltd | 0.51 | 9% | 38% | -2% | -47% | $ 85,268,531.39 |
| GEN | Genmin | 0.24 | 4% | 45% | 14% | 20% | $ 66,572,644.75 |
| GRR | Grange Resources. | 1.165 | -3% | -3% | 62% | 62% | $ 1,521,900,387.87 |
| GWR | GWR Group Ltd | 0.096 | -20% | 5% | -47% | -75% | $ 32,121,665.50 |
| HAV | Havilah Resources | 0.25 | 4% | 4% | 47% | 25% | $ 75,983,810.40 |
| HAW | Hawthorn Resources | 0.084 | 2% | 1% | -7% | 79% | $ 28,015,311.49 |
| HIO | Hawsons Iron Ltd | 0.405 | -5% | -12% | 113% | 161% | $ 303,831,709.50 |
| IRD | Iron Road Ltd | 0.14 | 0% | -3% | -22% | -45% | $ 115,853,739.08 |
| JNO | Juno | 0.135 | -4% | 13% | 13% | -43% | $ 18,992,120.14 |
| LCY | Legacy Iron Ore | 0.0195 | 8% | 8% | -3% | 15% | $ 124,933,110.88 |
| MAG | Magmatic Resrce Ltd | 0.063 | -13% | 17% | -32% | -57% | $ 18,323,049.46 |
| MDX | Mindax Limited | 0.059 | 0% | 0% | 48% | -14% | $ 113,984,913.12 |
| MGT | Magnetite Mines | 0.024 | 0% | 9% | -17% | -44% | $ 87,210,569.84 |
| MGU | Magnum Mining & Exp | 0.038 | 9% | 9% | -51% | -78% | $ 19,158,553.58 |
| MGX | Mount Gibson Iron | 0.51 | 9% | 0% | 31% | -45% | $ 605,284,016.50 |
| MIN | Mineral Resources. | 49.22 | 9% | 2% | -14% | -20% | $ 9,017,379,753.21 |
| MIO | Macarthur Minerals | 0.185 | 16% | -8% | -43% | -68% | $ 27,413,092.96 |
| PFE | Panteraminerals | 0.125 | -15% | -11% | -31% | 0% | $ 7,070,000.00 |
| PLG | Pearlgullironlimited | 0.046 | -16% | 10% | -32% | 0% | $ 2,360,799.24 |
| RHI | Red Hill Iron | 3.3 | -1% | 4% | 16% | 316% | $ 210,632,891.70 |
| RIO | Rio Tinto Limited | 98.96 | 4% | -2% | -8% | -22% | $ 36,059,943,027.96 |
| RLC | Reedy Lagoon Corp. | 0.019 | 0% | 36% | -42% | 6% | $ 10,591,111.33 |
| SHH | Shree Minerals Ltd | 0.009 | 0% | 13% | -18% | -36% | $ 9,907,895.14 |
| SRK | Strike Resources | 0.11 | 0% | -12% | -12% | -63% | $ 29,700,000.00 |
| SRN | Surefire Rescs NL | 0.018 | -14% | -18% | 64% | 29% | $ 28,464,542.59 |
| TI1 | Tombador Iron | 0.022 | 5% | -19% | -37% | -75% | $ 24,691,157.44 |
| TLM | Talisman Mining | 0.145 | 4% | 7% | -9% | -28% | $ 27,222,227.07 |
| VMS | Venture Minerals | 0.03 | 3% | 0% | -29% | -77% | $ 50,323,727.76 |
| EQN | Equinoxresources | 0.13 | 0% | -19% | -45% | 0% | $ 5,850,000.13 |
Coal miners hit multi-year highs
Resurgent coal miners continued their strong run as energy prices climbed overnight Monday.
Whitehaven (ASX:WHC) led the large caps, hitting a five-year share price high of $6.48.
$3.75 billion capped New Hope Corp (ASX:NHC) hit a similar milestone, with the rest of the sector up sharply.
Thermal coal prices continue to fetch over US$400/t on spot, suggesting mega-profits certain to be announced in August’s financials are virtually certain to keep going.
Despite suggestions they will find a bid from China’s relaxation of a ban on Australian coal, Aussie coking coal futures continued to fall, hitting US$222/t on Tuesday morning.
Australian premium hard coking coal was paying around US$670/t at its peak in the immediate aftermath of Russia’s decision to invade Ukraine.
| CODE | COMPANY | PRICE | 1 WEEK RETURN % | 1 MONTH RETURN % | 6 MONTH RETURN % | 1 YEAR RETURN % | MARKET CAP |
|---|---|---|---|---|---|---|---|
| AHQ | Allegiance Coal Ltd | 0.12 | -78% | -76% | -77% | -84% | $ 44,829,316.10 |
| AKM | Aspire Mining Ltd | 0.09 | 1% | 6% | 7% | 27% | $ 45,179,691.67 |
| ATU | Atrum Coal Ltd | 0.007 | 0% | 0% | -73% | -87% | $ 4,839,578.35 |
| AVM | Advance Metals Ltd | 0.011 | 0% | 10% | -35% | -31% | $ 5,256,651.42 |
| BCB | Bowen Coal Limited | 0.32 | 33% | 31% | 100% | 382% | $ 470,637,421.16 |
| BRL | Bathurst Res Ltd. | 1.07 | 2% | -2% | 34% | 53% | $ 199,970,970.10 |
| CKA | Cokal Ltd | 0.155 | 0% | 29% | 7% | 48% | $ 150,231,836.80 |
| CRN | Coronado Global Res | 1.43 | -14% | -14% | 18% | 56% | $ 2,330,270,684.70 |
| GRX | Greenx Metals Ltd | 0.25 | 25% | 39% | -2% | -3% | $ 62,137,013.68 |
| JAL | Jameson Resources | 0.07 | 0% | 0% | -9% | -39% | $ 24,374,231.84 |
| LNY | Laneway Res Ltd | 0.005 | 11% | 43% | -13% | 4% | $ 31,510,082.05 |
| MCM | Mc Mining Ltd | 0.14 | 12% | 40% | 41% | 22% | $ 27,671,681.80 |
| NAE | New Age Exploration | 0.008 | 14% | 33% | -43% | -38% | $ 11,487,191.28 |
| NCZ | New Century Resource | 1.545 | 4% | -10% | -26% | -53% | $ 201,725,698.02 |
| NHC | New Hope Corporation | 4.48 | 4% | 38% | 105% | 138% | $ 3,620,753,306.70 |
| SMR | Stanmore Resources | 1.995 | -1% | 3% | 88% | 202% | $ 1,744,173,585.63 |
| TER | Terracom Ltd | 0.805 | 6% | 39% | 335% | 519% | $ 630,302,764.79 |
| TIG | Tigers Realm Coal | 0.017 | 0% | -6% | -15% | 89% | $ 209,067,237.89 |
| WHC | Whitehaven Coal | 6.48 | 10% | 43% | 146% | 189% | $ 5,823,694,360.68 |
| YAL | Yancoal Aust Ltd | 5.68 | -3% | 10% | 107% | 174% | $ 7,394,460,847.20 |
Related Stories


UNLOCK INSIGHTS
Discover the untold stories of emerging ASX stocks.
Daily news and expert analysis, it's free to subscribe.
By proceeding, you confirm you understand that we handle personal information in accordance with our Privacy Policy.


