Bulk Buys: Does Chinese trade data signal the end for iron ore party?

Pic: Getty
• Chinese commodity trade data and weak May steel exports have analysts cautious on iron ore prices
• Iron ore price still traded above $US200/t yesterday
• Coking and thermal coal continues to find price support as Australian exports find alternative markets
Analysts have signalled notes of caution over Chinese trade data from May, which fell amid a backdrop of CCP fury about sky-high commodity prices and the sheer volume of cash they’ve been sending Australia’s way in the midst of a sort of trade war.
Imports of iron ore into China slowed by 8.9% in May to 89.7 million tonnes.
That was a fall from more than 98Mt in April and 102Mt in March, with high prices and the crimping of the local steel sector said to be to blame.
Not too much of a concern immediately for prices though, which eased slightly overnight Monday by 2.6 per cent or US$5.50 to US$202.85/t at Tianjin Port.
At that price, recent shipping data would suggest around US$3 billion would be heading in the direction of Rio Tinto (ASX: RIO), BHP (ASX: BHP), Fortescue Metals Group (ASX: FMG) and Gina Rinehart’s Roy Hill. Even with port delays, that’s not bad indeed.
Iron ore eased by US$5.50 a tonne or 2.6% to US$202.85 a tonne in the latest session.
(CFR Tianjin Port). #ironore— CommSec (@CommSec) June 7, 2021
ASX iron ore stocks
Scroll or swipe to reveal table. Click headings to sort.
| CODE | COMPANY | 1 WEEK RETURN % | 1 MONTH RETURN % | 6 MONTH RETURN % | 1 YEAR RETURN % | PRICE | MARKET CAP |
|---|---|---|---|---|---|---|---|
| RHI | Red Hill Iron | 47 | 3 | 432 | 7.93 | 1.25 | 68859871.35 |
| IRD | Iron Road Ltd | 3 | 49 | 121 | 5.09 | 0.32 | 225799594.8 |
| JNO | Juno | 27 | 0 | 0.21 | 25775020.19 | ||
| VMS | Venture Minerals | 25 | 20 | 227 | 8.17 | 0.1375 | 178764203.205 |
| AKO | Akora Resources | 23 | 5 | 0 | 0.32 | 15367680 | |
| MGU | Magnum Mining & Exp | 18 | 18 | 290 | 4.42 | 0.195 | 90840041.77 |
| GWR | GWR Group Ltd | 14 | -10 | 12 | 3.44 | 0.28 | 86294136.255 |
| FMS | Flinders Mines Ltd | 13 | 3 | 25 | 0.79 | 1.03 | 173914034.31 |
| MAG | Magmatic Resrce Ltd | 12 | 15 | 38 | -0.03 | 0.23 | 50447254.01 |
| MGT | Magnetite Mines | 9 | 1 | 483 | 37.14 | 0.07 | 209781923.301 |
| MIN | Mineral Resources. | 8 | 3 | 40 | 1.48 | 48.83 | 9100849052.04 |
| MDX | Mindax Limited | 6 | 2433 | 2433 | 24.33 | 0.076 | 146199716.775 |
| EFE | Eastern Iron | 4 | 25 | 33 | 2.35 | 0.0125 | 8942781.168 |
| GRR | Grange Resources. | 3 | -6 | 84 | 1.03 | 0.5175 | 607602816.45 |
| TI1 | Tombador Iron | 3 | 0 | 89 | 3.75 | 0.1 | 100641506.5 |
| HAW | Hawthorn Resources | 1 | 12 | -41 | -0.45 | 0.056 | 18676874.328 |
| BHP | BHP Group Limited | 1 | -3 | 14 | 0.33 | 48.405 | 143904840597 |
| RIO | Rio Tinto Limited | 0 | -2 | 7 | 0.25 | 124.15 | 46524528100.6 |
| TLM | Talisman Mining | 0 | 42 | 100 | 1.2 | 0.22 | 40125102.775 |
| HAV | Havilah Resources | 0 | 21 | 31 | 1.58 | 0.255 | 78100693.14 |
| RLC | Reedy Lagoon Corp. | 0 | 0 | 36 | 2.8 | 0.019 | 8460470.988 |
| ACS | Accent Resources NL | 0 | 32 | 178 | 9 | 0.05 | 23301364.15 |
| FEX | Fenix Resources Ltd | 0 | -11 | 47 | 2.579545 | 0.315 | 150468454.4 |
| LCY | Legacy Iron Ore | 0 | -6 | 114 | 4 | 0.015 | 96071077.755 |
| FMG | Fortescue Metals Grp | 0 | -2 | 5 | 0.540922 | 22.405 | 69738555392.7 |
| CIA | Champion Iron Ltd | -1 | -5 | 24 | 1.210169 | 6.52 | 3331560359.12 |
| BCK | Brockman Mining Ltd | -2 | -28 | 22 | 0.571429 | 0.044 | 417565445.895 |
| MGX | Mount Gibson Iron | -3 | -10 | -1 | 0.180851 | 0.8325 | 984311257.74 |
| DRE | Drednought Resources | -4 | -8 | 5 | 2.833333 | 0.023 | 54302418.742 |
| MIO | Macarthur Minerals | -5 | 6 | -23 | 1.325 | 0.465 | 68900926.15 |
| ADY | Admiralty Resources. | -6 | -6 | 13 | 0.888889 | 0.017 | 19705289.883 |
| SRK | Strike Resources | -6 | -17 | 52 | 3.680851 | 0.22 | 59400000 |
| CZR | CZR Resources Ltd | -7 | 8 | -13 | -0.071429 | 0.013 | 38515755.069 |
| CAP | Carpentaria Resource | -11 | 172 | 247 | 4.434783 | 0.125 | 61846283.85 |
| SHH | Shree Minerals Ltd | -13 | -7 | 0 | 2.5 | 0.014 | 15948553.38 |
| GEN | Genmin | -23 | -23 | 0 | 0.22 | 65642026.655 | |
| SRN | Surefire Rescs NL | -31 | -31 | -63 | 3.5 | 0.018 | 21874208.2 |
Chinese steel exports, iron ore imports slide
The other side to the equation was steel exports, an indicator for iron ore prices given the closely tethered relationship between the steel-making commodity and its end product.
According to analysts the 34 per cent slide for May to 5.3Mt could be attributed to the removal of tax rebates at the start of the month, alongside the well-documented crackdown on “speculation”.
Capital Economics, which has a bearish outlook on industrial metals, sees iron ore exports from Australia moving lower on the back of the data.
“Iron ore is currently trading at just over $200 per tonne, a marked increase from $160 at the start of the year,” assistant commodities economist Samuel Berman wrote in a note.
“We anticipate that iron ore import volumes will fall further in the coming months as the withdrawal of infrastructure-linked fiscal stimulus should weigh on steel production.”
Capital Economics has a US$140/t target on iron ore prices by the end of 2021, sliding to US$120/t by the end of 2022.
CBA mining and energy strategist Vivek Dhar, who noted Chinese iron ore imports for May represented a 3% increase year-on-year despite the big month to month fall, had a similarly cautious take.
Dhar says steel mill margins could have an impact on iron ore demand.
“China’s infrastructure sector has led China’s steel demand growth due to policy support after COVID-19, but that support appears to be fading,” he wrote.
“Local government special bond issuance is tracking below 2020 and 2019 levels for this time of year, challenging the RMB3.65 tn quota set for 2021 (compares to RMB 2.15tn in 2019 and RMB3.75tn in 2020).
“Steel demand is also struggling to keep China’s steel mill margins supported. Margins have collapsed 70-80% since peaking on May 12 after steel and iron ore prices fell as policymakers cracked down on commodity price speculation.
“Policy will likely play a crucial role for China’s iron ore imports too. China has played around with steel production levels already this year, first to curb output to reduce emissions and then to lift steel output to reduce steel prices.
“These policies will have important implications for China’s iron ore imports for the remainder of 2021.”
Chinese iron ore demand still high
In historical terms China’s iron ore demand remains high.
While May imports were the weakest in real terms in 12 months, Westpac’s Robert Rennie noted they were only a four-month low in seasonally adjusted terms.
“Are we finally seeing some signs of Chinese demand for #ironore moderating?” he tweeted.
“Yes, Chinese iron ore imports dropped to a 1yr low of 89.79mt in May.
“However, on a seasonally adjusted basis, it was only a 4 month low suggesting its probably too early to tell – though watching closely.”
Are we finally seeing some signs of Chinese demand for #ironore moderating? Yes,Chinese iron ore imports dropped to a 1yr low of 89.79mt in May. However, on a seasonally adjusted basis, it was only a 4 month low suggesting its probably too early to tell – though watching closely! pic.twitter.com/gCG90oMjFs
— Robert Rennie (@Robert__Rennie) June 7, 2021
According to Metal Bulletin domestic prices for hot rolled coil came off by around US$15/t to US$859-861/t in Shanghai on the back of the weak steel export data.
Juniors also benefitting from higher prices
It is not only the Pilbara iron ore companies benefiting from higher prices.
Aussie-Canadian producer Champion Iron (ASX: CIA), which runs the Bloom Lake Complex in Quebec, recently posted its best ever earnings result of $819.5 million for the year to March 31, 2021, up from $347.4m in the 12 months to March 31, 2020.
On sales of almost 2 million tonnes of 66% iron ore concentrate, Champion saw a year on year rise in revenues of 126% from US$175.7 million to $396.7m in the three months to March 31.
Even with a 9% jump in all in sustaining costs to US$65.1/t, Champion still saw a 309% increase in cash operating margins to US$136.2/t.
While we may not see these sorts of margins persist forever, it is worth noting a number of junior miners would still be in business even at Capital Economics’ US$120/t prediction.
Like most iron ore miners Champion Iron has enjoyed a stellar price run over the past 12 months, rising more than 200 per cent from $3.09 this time last year to close yesterday at $6.53 a share.
Champion Iron share price today:
Coal prices continue to find support
ASX coal stocks
Scroll or swipe to reveal table. Click headings to sort.
| CODE | COMPANY | 1 WEEK RETURN % | 1 MONTH RETURN % | 6 MONTH RETURN % | 1 YEAR RETURN % | PRICE | MARKET CAP |
|---|---|---|---|---|---|---|---|
| NHC | New Hope Corporation | 21 | 50 | 23 | 18 | 1.77 | $ 1,419,168,824.81 |
| WHC | Whitehaven Coal | 17 | 44 | 9 | -2 | 1.84 | $ 1,827,780,290.64 |
| MR1 | Montem Resources | 15 | -9 | -59 | 0.1 | $ 19,644,191.10 | |
| TIG | Tigers Realm Coal | 14 | 14 | -34 | -7 | 0.008 | $ 104,533,618.94 |
| AHQ | Allegiance Coal Ltd | 14 | 8 | 128 | 78 | 0.615 | $ 168,413,683.80 |
| CRN | Coronado Global Res | 13 | 49 | -28 | -21 | 0.775 | $ 1,307,633,909.40 |
| NCZ | New Century Resource | 13 | 10 | -4 | 13 | 0.22 | $ 248,035,249.43 |
| SMR | Stanmore Resources | 11 | 8 | -3 | -17 | 0.735 | $ 200,100,692.34 |
| AKM | Aspire Mining Ltd | 8 | -1 | 19 | -7 | 0.083 | $ 42,133,869.76 |
| YAL | Yancoal Aust Ltd | 4 | 2 | -14 | -2 | 2.13 | $ 2,746,514,028.96 |
| MCM | Mc Mining Ltd | 0 | -9 | -48 | -28 | 0.105 | $ 16,214,053.28 |
| ATU | Atrum Coal Ltd | 0 | -32 | -88 | -83 | 0.04 | $ 23,859,197.77 |
| JAL | Jameson Resources | 0 | -6 | -18 | -25 | 0.09 | $ 27,299,870.10 |
| PAK | Pacific American Hld | 0 | -9 | -9 | 67 | 0.02 | $ 6,690,282.90 |
| LNY | Laneway Res Ltd | 0 | 0 | -29 | 11 | 0.005 | $ 18,875,329.67 |
| BRL | Bathurst Res Ltd. | -3 | -6 | -18 | -43 | 0.32 | $ 56,414,035.59 |
| PDZ | Prairie Mining Ltd | -4 | -12 | 10 | 29 | 0.22 | $ 50,238,119.58 |
| BCB | Bowen Coal Limited | -5 | -6 | 32 | 32 | 0.062 | $ 58,618,697.98 |
| CKA | Cokal Ltd | -5 | -8 | -21 | 26 | 0.059 | $ 55,474,938.78 |
| TER | Terracom Ltd | -8 | 13 | -33 | -37 | 0.11 | $ 86,664,877.45 |
| NAE | New Age Exploration | -15 | -19 | 12 | 190 | 0.0145 | $ 19,621,600.74 |
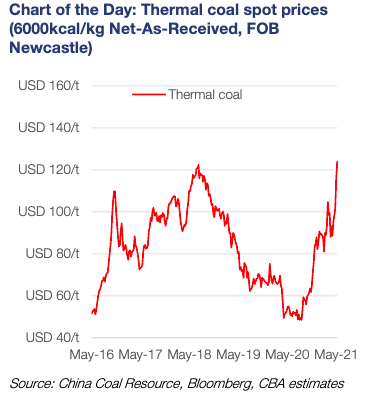
Spot thermal coal prices are trading around their highest levels in nine years, with Glencore reportedly settling its annual contract level with Japanese generator Tohoku at US$109.97/t.
That is 60 per cent up on prices of US$68.75/t reported last year.
Coal FOB Newcastle is attracting spot prices of around US$120/t, according to the CBA.
Dhar wrote in a note this week that India had filled the gap for Australia’s low-energy thermal coal exports usually bound for China.
“However, with rising COVID-19 cases in India, the outlook for India’s near-term thermal coal imports looks challenged,” he wrote.
“We think seasonal and temporary factors have given rise to high-energy thermal coal spot prices rising to nine-year highs. We think these factors will likely unwind through the course of 2021, but elevated prices may remain in the near-term.”
Coking coal prices have remained solid, despite the planned reopening of Anglo American’s Moranbah North and Grosvenor mines.
Pure play mid-cap Whitehaven Coal – market cap of around $1.9 billion – has been a good barometer for the sector.
Whitehaven sunk as low as 85 cents in September last year and was trading close to six-month highs of $1.84 yesterday after a 3.67% gain.
Whitehaven Coal share price today:
Related Topics
Related Stories


UNLOCK INSIGHTS
Discover the untold stories of emerging ASX stocks.
Daily news and expert analysis, it's free to subscribe.
By proceeding, you confirm you understand that we handle personal information in accordance with our Privacy Policy.


