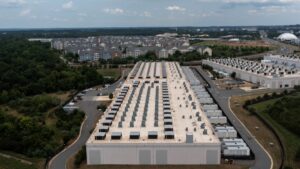
Bulk Buys: Australian Pacific Coal is racing to bring Dartbrook mine into production in search of boom prices

Pic: Daniel Milchev/The Image Bank via Getty Images
- Australian Pacific Coal says it will cost $100-120 million to restart the Dartbrook mine in the Hunter Valley at a rate of 1.5Mtpa
- The mine was the subject of a major corporate tussle over the past two months
- Chinese steel margins poor with more capacity coming online as Covid tests iron ore prices
Coal miners are making a motsa right now.
So it’s little wonder that the rare breed seeking to enter the game in 2022 are trying to get up and running as quick as they can.
Australian Pacific Coal’s (ASX:AQC) corporate travails dominated the headlines of late.
But now that the ownership structure of the Dartbrook mine in the Hunter Valley is settled — a nifty arrangement that leaves AQC with half the operation and the other half apportioned to M Resources, Tetra Resources and one-time mega creditor Trepang Services — plans to revive the mine are coming to the fore.
A recent decision of the New South Wales Government has prevented Dartbrook from restarting open pits that haven’t been touched in 16 years.
But that wasn’t the long-term plan, with an underground development now being pursued to access the mine’s Kaguya seam.
Board and pillar mining methods will be used to access the high CV coal, with AQC putting a $100-120m price tag on reopening the mine at a quarter of its 6Mtpa nameplate capacity.
It expects to hit that rate by 2024, when it will produce 1.636Mt, ramping up to 2.323Mt in 2025, 2.461Mt in 2026 and 2.238Mt in 2027, the last year of a five-year extension to Dartbrook’s mining approval.
84,000t is anticipated during 2023, with AQC telling the ASX yesterday it expects the pre-production phase to take 7-9 months to complete. Debt funding is expected before Christmas to support the plan.
The company says a number of cost savings will reduce restart capital by around $160m, including $80m from leasing mining equipment, something which will avoid sometimes 18-month waits reliant on strained supply chains.
Where will coal prices go?
The obvious allure of the coal market at the moment is the wild prices thermal coal in particular is drawing from a market that has been tightly wound since late last year and unfathomable since Russia’s invasion of Ukraine in February.
According to Trading Economics, Newcastle grade thermal coal is currently paying US$345/t. That’s over US$100 below highs seen a couple of months ago, in the immediate aftermath of a ban on Russian coal in Europe.
But it remains more than three times higher the cost base of most coal producers, inspiring some met coal miners to transfer uncontracted intermediate grades of coal from the steelmaking to energy market.
High energy coal grades are also seeing big premiums over lower energy coal like that produced in Indonesia, which is not in as high demand at the moment.
Market leader Whitehaven Coal (ASX:WHC) has shifted its thermal sales entirely to high CV coal in recent months, with its September quarterly showing the NSW coal miner delivered 92% of its product as high energy coal and none as low CV coal.
Only 8% of its sales mix was met coal, down from 16% in June and 24% in March.
That Newcastle grade market is the one that AQC and its partners want to supply out of Dartbrook.
“Operating costs for Dartbrook are expected to be in line with a conventional Board & Pillar operation, where steady state production is expected to have a cost of A$85/t – A$90/t FOR,” the company said.
“This supports margin expansion as Dartbrook will produce a NEWC spec coal, which currently trades at a US$180/t premium to API #5.”
How long will the Newcastle grade coal market remain this hot, especially given prices have come down over the past month?
Westpac senior economist Justin Smirk thinks recovering production from a weather affected Australia and South Africa could rebalance the market, bringing prices down to a more normal US$150/t by the end of 2023 and US$105t by 2024.
But the market remains bullish.
Long term bets on the price of the commodity continue to be strong, with futures remaining above US$250/t for contracts out to December 2027.
ASX coal stocks
Scroll or swipe to reveal table. Click headings to sort.
| CODE | COMPANY | PRICE | 1 WEEK RETURN % | 1 MONTH RETURN % | 6 MONTH RETURN % | 1 YEAR RETURN % | MARKET CAP |
|---|---|---|---|---|---|---|---|
| NAE | New Age Exploration | 0.0075 | 0% | -6% | -38% | -32% | $ 11,487,191.28 |
| CKA | Cokal Ltd | 0.22 | 10% | -12% | 42% | 38% | $ 197,704,285.80 |
| NCZ | New Century Resource | 0.995 | -3% | -18% | -57% | -54% | $ 128,370,898.74 |
| BCB | Bowen Coal Limited | 0.29 | -2% | -23% | -6% | 71% | $ 531,315,961.52 |
| SVG | Savannah Goldfields | 0.22 | 0% | 10% | 10% | 15% | $ 38,272,148.55 |
| GRX | Greenx Metals Ltd | 0.36 | 33% | 41% | 89% | 60% | $ 81,158,548.48 |
| AKM | Aspire Mining Ltd | 0.084 | -3% | -16% | -6% | 4% | $ 42,641,506.74 |
| AVM | Advance Metals Ltd | 0.012 | 9% | 9% | -8% | -29% | $ 4,300,896.62 |
| AHQ | Allegiance Coal Ltd | 0.055 | 6% | -15% | -86% | -85% | $ 41,029,747.98 |
| YAL | Yancoal Aust Ltd | 5.18 | 0% | -17% | -6% | 86% | $ 6,985,124,621.73 |
| NHC | New Hope Corporation | 5.95 | 5% | -13% | 64% | 210% | $ 5,666,642,327.10 |
| TIG | Tigers Realm Coal | 0.015 | 7% | -12% | -6% | -32% | $ 196,000,535.52 |
| SMR | Stanmore Resources | 2.99 | 4% | 14% | 15% | 215% | $ 2,776,255,629.84 |
| WHC | Whitehaven Coal | 9.41 | 4% | -14% | 90% | 286% | $ 9,256,622,897.64 |
| BRL | Bathurst Res Ltd. | 0.925 | 3% | 1% | -28% | 23% | $ 171,267,003.10 |
| CRN | Coronado Global Res | 2.03 | 9% | 1% | -3% | 70% | $ 3,537,317,370.30 |
| JAL | Jameson Resources | 0.105 | 62% | 50% | 25% | 22% | $ 34,820,331.20 |
| TER | Terracom Ltd | 0.88 | 0% | -23% | 52% | 351% | $ 739,554,397.90 |
| ATU | Atrum Coal Ltd | 0.006 | 0% | -14% | -40% | -82% | $ 8,987,788.37 |
| MCM | Mc Mining Ltd | 0.22 | 13% | -24% | 106% | 201% | $ 51,390,266.20 |
| DBI | Dalrymple Bay | 2.5 | 5% | 18% | 16% | 15% | $ 1,229,488,934.16 |
Negative Chinese steel margins to weigh on iron ore prices
S&P Global says Chinese steelmakers were losing US$33 on each tonne of rebar and US$46/t on hot rolled coil amid a supply glut in a weak market.
Downstream demand for steel has been hurt all year by Covid lockdowns and a debt-laden property sector in the Asian nation, responsible for around three-quarters of Australia’s iron ore demand.
It may be oversupplied for some time to come if demand does not improve, something that could prove unlikely if its restrictive Covid Zero policy is not wound back in March.
“However, with China’s debt-laden property sector and sluggish domestic consumption unlikely to generate much incremental steel demand for 2023, the Chinese steel market may remain under oversupply pressure for a longer term, especially as more iron and steel making facilities will keep coming on stream, according to sources,” S&P’s James Leech said on Friday.
“For the rest of 2022 and whole 2023, Chinese steel makers plan to bring a total of 116 million mt/year of new pig iron capacity and 143 million mt/year of new crude steel capacity on stream through capacity swap mechanism, according to an analysis of industry data.”
It goes without saying this doesn’t mean steel production will necessarily be higher. Much of this will replace capacity exiting the market. The net increase in capacity for 2022 so far is 8.3Mt of pig iron and 6Mt of crude steel.
The Chinese Government has also committed to reduce steel production year on year in 2022 after a 30Mt fall in 2021, leading many commentators to believe the 1.065Bt produced by China in 2020 was its peak steel year.
According to the China Iron and Steel Association, MySteel says, Chinese mills produced at a rate of around 2.76Mt a day in late October, down 0.9% on the middle of the month.
Iron ore prices have fallen from over US$160/t in March to under US$80/t last week before recovering to US$86.20/t in Singapore yesterday.
ASX iron ore stocks
Scroll or swipe to reveal table. Click headings to sort.
| CODE | COMPANY | PRICE | 1 WEEK RETURN % | 1 MONTH RETURN % | 6 MONTH RETURN % | 1 YEAR RETURN % | MARKET CAP |
|---|---|---|---|---|---|---|---|
| ACS | Accent Resources NL | 0.025 | 0% | 0% | -58% | -55% | $ 11,650,682.08 |
| ADY | Admiralty Resources. | 0.007 | 0% | -13% | -53% | -46% | $ 9,125,054.07 |
| AKO | Akora Resources | 0.18 | -8% | -10% | -28% | -12% | $ 11,746,934.64 |
| BCK | Brockman Mining Ltd | 0.023 | -2% | 5% | -47% | -48% | $ 213,445,339.01 |
| BHP | BHP Group Limited | 40.35 | 8% | 1% | -3% | 26% | $ 205,064,416,106.88 |
| CIA | Champion Iron Ltd | 4.99 | 7% | -4% | -32% | 23% | $ 2,596,309,492.52 |
| CZR | CZR Resources Ltd | 0.013 | 0% | -13% | 2% | 66% | $ 48,808,525.88 |
| DRE | Dreadnought Resources Ltd | 0.1 | -13% | 2% | 138% | 156% | $ 305,271,155.10 |
| EFE | Eastern Resources | 0.04 | 21% | -2% | -9% | -23% | $ 41,452,615.93 |
| CUF | Cufe Ltd | 0.015 | 0% | -6% | -52% | -55% | $ 13,042,516.93 |
| FEX | Fenix Resources Ltd | 0.21 | 0% | -19% | -30% | -2% | $ 122,579,923.20 |
| FMG | Fortescue Metals Grp | 16.63 | 13% | -4% | -20% | 17% | $ 51,233,976,235.52 |
| FMS | Flinders Mines Ltd | 0.5 | -4% | -25% | 4% | -29% | $ 79,358,831.19 |
| GEN | Genmin | 0.27 | 4% | 8% | 35% | 93% | $ 79,320,598.00 |
| GRR | Grange Resources. | 0.7 | 13% | -11% | -49% | 51% | $ 821,710,475.58 |
| GWR | GWR Group Ltd | 0.057 | -11% | -16% | -59% | -46% | $ 18,309,349.34 |
| HAV | Havilah Resources | 0.305 | 0% | -5% | 65% | 65% | $ 98,158,155.10 |
| HAW | Hawthorn Resources | 0.093 | 11% | 3% | -38% | 71% | $ 31,016,952.01 |
| HIO | Hawsons Iron Ltd | 0.105 | 5% | -73% | -84% | 36% | $ 77,810,559.75 |
| IRD | Iron Road Ltd | 0.125 | -7% | -14% | -34% | -38% | $ 99,982,663.00 |
| JNO | Juno | 0.095 | -14% | 0% | -24% | -21% | $ 13,023,168.10 |
| LCY | Legacy Iron Ore | 0.018 | 0% | -5% | -31% | 29% | $ 108,916,045.38 |
| MAG | Magmatic Resrce Ltd | 0.125 | 25% | -4% | 69% | 25% | $ 33,185,849.75 |
| MDX | Mindax Limited | 0.059 | 0% | 0% | 0% | 16% | $ 115,533,663.12 |
| MGT | Magnetite Mines | 0.016 | -6% | -36% | -43% | -24% | $ 62,564,280.27 |
| MGU | Magnum Mining & Exp | 0.03 | -3% | -17% | -57% | -58% | $ 21,155,223.95 |
| MGX | Mount Gibson Iron | 0.415 | 11% | -5% | -42% | 8% | $ 510,056,119.86 |
| MIN | Mineral Resources. | 79.11 | 8% | 10% | 40% | 109% | $ 14,305,639,014.00 |
| MIO | Macarthur Minerals | 0.15 | 7% | -12% | -57% | -58% | $ 24,019,755.76 |
| PFE | Panteraminerals | 0.16 | 68% | 68% | 0% | -37% | $ 7,725,168.00 |
| PLG | Pearlgullironlimited | 0.025 | 9% | 0% | -62% | -76% | $ 1,317,655.39 |
| RHI | Red Hill Iron | 3.56 | 1% | 2% | -13% | 35% | $ 226,589,928.95 |
| RIO | Rio Tinto Limited | 96.35 | 9% | 0% | -12% | 8% | $ 35,740,697,083.92 |
| RLC | Reedy Lagoon Corp. | 0.011 | -8% | -21% | -62% | -76% | $ 6,131,696.03 |
| SHH | Shree Minerals Ltd | 0.0075 | 7% | -17% | -32% | -32% | $ 8,669,408.24 |
| SRK | Strike Resources | 0.1 | -5% | -9% | -52% | -20% | $ 27,000,000.00 |
| SRN | Surefire Rescs NL | 0.012 | -8% | -8% | -65% | 9% | $ 18,976,361.72 |
| TI1 | Tombador Iron | 0.021 | 0% | -28% | -44% | -36% | $ 47,013,612.21 |
| TLM | Talisman Mining | 0.13 | -4% | -7% | -16% | -7% | $ 24,875,483.35 |
| VMS | Venture Minerals | 0.02 | -5% | -23% | -62% | -56% | $ 33,549,151.84 |
| EQN | Equinoxresources | 0.12 | 0% | -14% | -25% | -40% | $ 5,400,000.12 |
| AMD | Arrow Minerals | 0.005 | 0% | 0% | 25% | -29% | $ 9,151,942.92 |
Related Stories

UNLOCK INSIGHTS
Discover the untold stories of emerging ASX stocks.
Daily news and expert analysis, it's free to subscribe.
By proceeding, you confirm you understand that we handle personal information in accordance with our Privacy Policy.


