Why knowing trading volume is important, and how to use it as an entry or exit signal

Why is volume data important for investors? Picture Getty
- The ASX releases top 20 stocks by volume on a daily basis
- Why is volume data important for investors?
- And how do chartists interpret trading volumes?
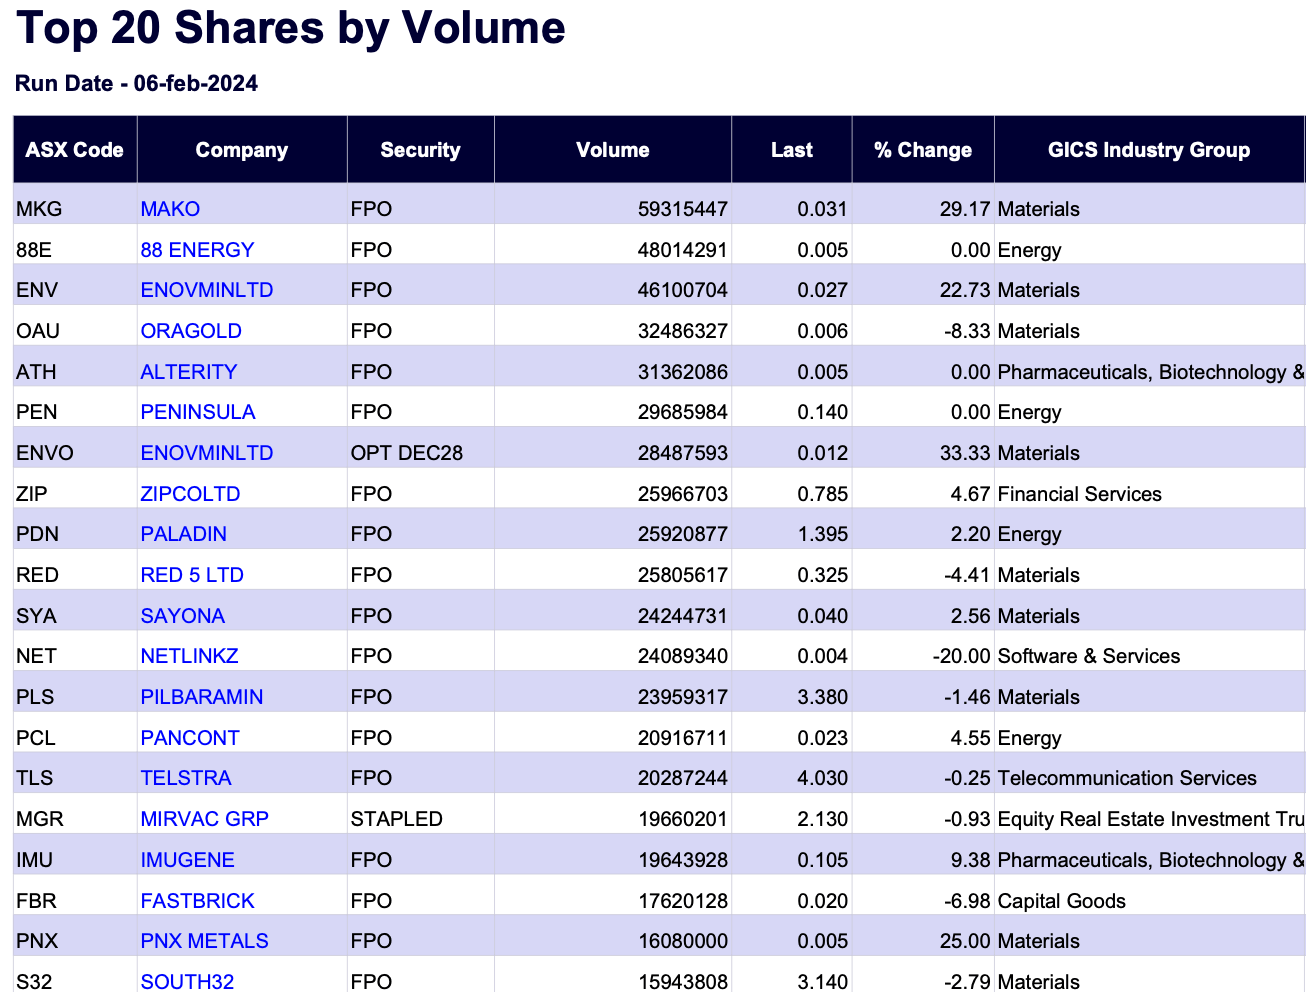
The ASX releases a top 20 trading volume list on a daily basis.
Here’s one for the 6th February, showing that Mako (ASX:MKG) and 88 Energy (ASX:88E) were the top traded stocks on the day:
So why is this data important for investors?
First, a bit of definition. Volume is the amount of stocks that changes hands over some period of time, usually one day. A transaction (consisting of a simultaneous buy and sell) is counted as 1 trade volume.
The trading volume of a stock, or lack of it (particularly when it’s monitored over a period of time) can tell you some very important things about a stock:
Liquidity
High volume trading on a stock indicates liquidity, and vice versa for low volume.
Liquidity is important because it impacts how quickly you can buy or sell the stock. This is especially crucial during a falling market where you want to sell as quickly as possible.
Liquid stocks also tend to have lower bid-offer spread, meaning that you will get better prices when buying or selling.
A wide bid offer spead indicates that a stock is illiquid, and hence more expensive to execute.
Volatility
High volume stocks tend to be less volatile, because the high number of transactions mean price movements are more fluid.
Low volume or illiquid stocks meanwhile are characterised by big jumps (both up and down) in prices – resulting in large percentage swings day to day.
Sensitivity
Related to volatility, low volume (illiquid) stocks tend to react more to news or events, and vice versa for high volume stocks.
Trading tends to be more efficient for high volume stocks, since there are more investors in the market to digest the news.
Valuation
Because there are less investors wanting to buy the stock, low volume stocks tend to be undervalued.
While this in itself can create a buying opportunity, problems mentioned above create a self-fulfilling prophecy, turning potential investors away from buying the stock.
How chartists interpret volumes
Technical traders or chartists often use trading volume data as an entry or exit signal.
An upward trend
When a stock is moving up, increasing trading volume in the stock signals that traders are committed to the price move, ie: even more buyers are wanting to buy the stock.
Chartists often call this momentum, which involves “buying high, but hoping to sell even higher”.
An upward trend with decreasing volume, on the other hand, suggests investor enthusiasm has waned – which is a clear exit signal for the chartist.
A downward trend
Meanwhile, when a stock price is falling and is accompanied by increasing volumes, it could suggest more sellers are exiting the stock.
This should indicate to the chartist that it’s time to sell the stock.
On the other hand, a downward trending stock with decreasing volumes could suggest the selloff has been overdone.
This could indicate an entry point for the chartist.
Related Topics
Related Stories


UNLOCK INSIGHTS
Discover the untold stories of emerging ASX stocks.
Daily news and expert analysis, it's free to subscribe.
By proceeding, you confirm you understand that we handle personal information in accordance with our Privacy Policy.


