School of Stock: Here’s how to predict a US Fed rate move – the biggest factor for stocks this year

Picture: Getty Images
- The Fed Reserve will make its first rates call this week
- Experts believe Fed will the biggest influence on stock markets this year
- So how do we assign probability to rate cuts?
The market adage “Don’t Fight the Fed” has never been truer than today, what after 11 interest-rate hikes and 525 basis points of tightening over the last two years.
As FOMC members huddle to make their first rates call in 2024, traders are unanimous in their belief that whatever the Fed Reserve does next will determine how financial markets behave this year.
While the FOMC is expected to hold the Fed Funds rate steady this week, the market is anticipating deep cuts this year. The consensus is for six cuts totalling 1.5% through to December.
The question for equity investors, therefore, has shifted from whether they will actually cut, to when and by how much?
Because frankly, being able to answer those questions may provide some sort of ability to time the markets.
Fortunately, the market does provide clues in that regard, allowing investors to assign probabilities of a rate cut and its magnitude.
At the moment for example, the market is placing a 97.9% chance of a hold in rates this week, and almost 100% chance of at least a 25bp rate cut in May.
By December, the market has placed a 36% probability of 150 basis points of rate cuts in total.
How to calculate probabilities on Fed move?
So how does the market come up with these probabilities?
The tool most used by analysts is the Chicago Mercantile Exchange (CME) Group’s FedWatch tool.
This is definitely a website stock investors should also look at regularly.
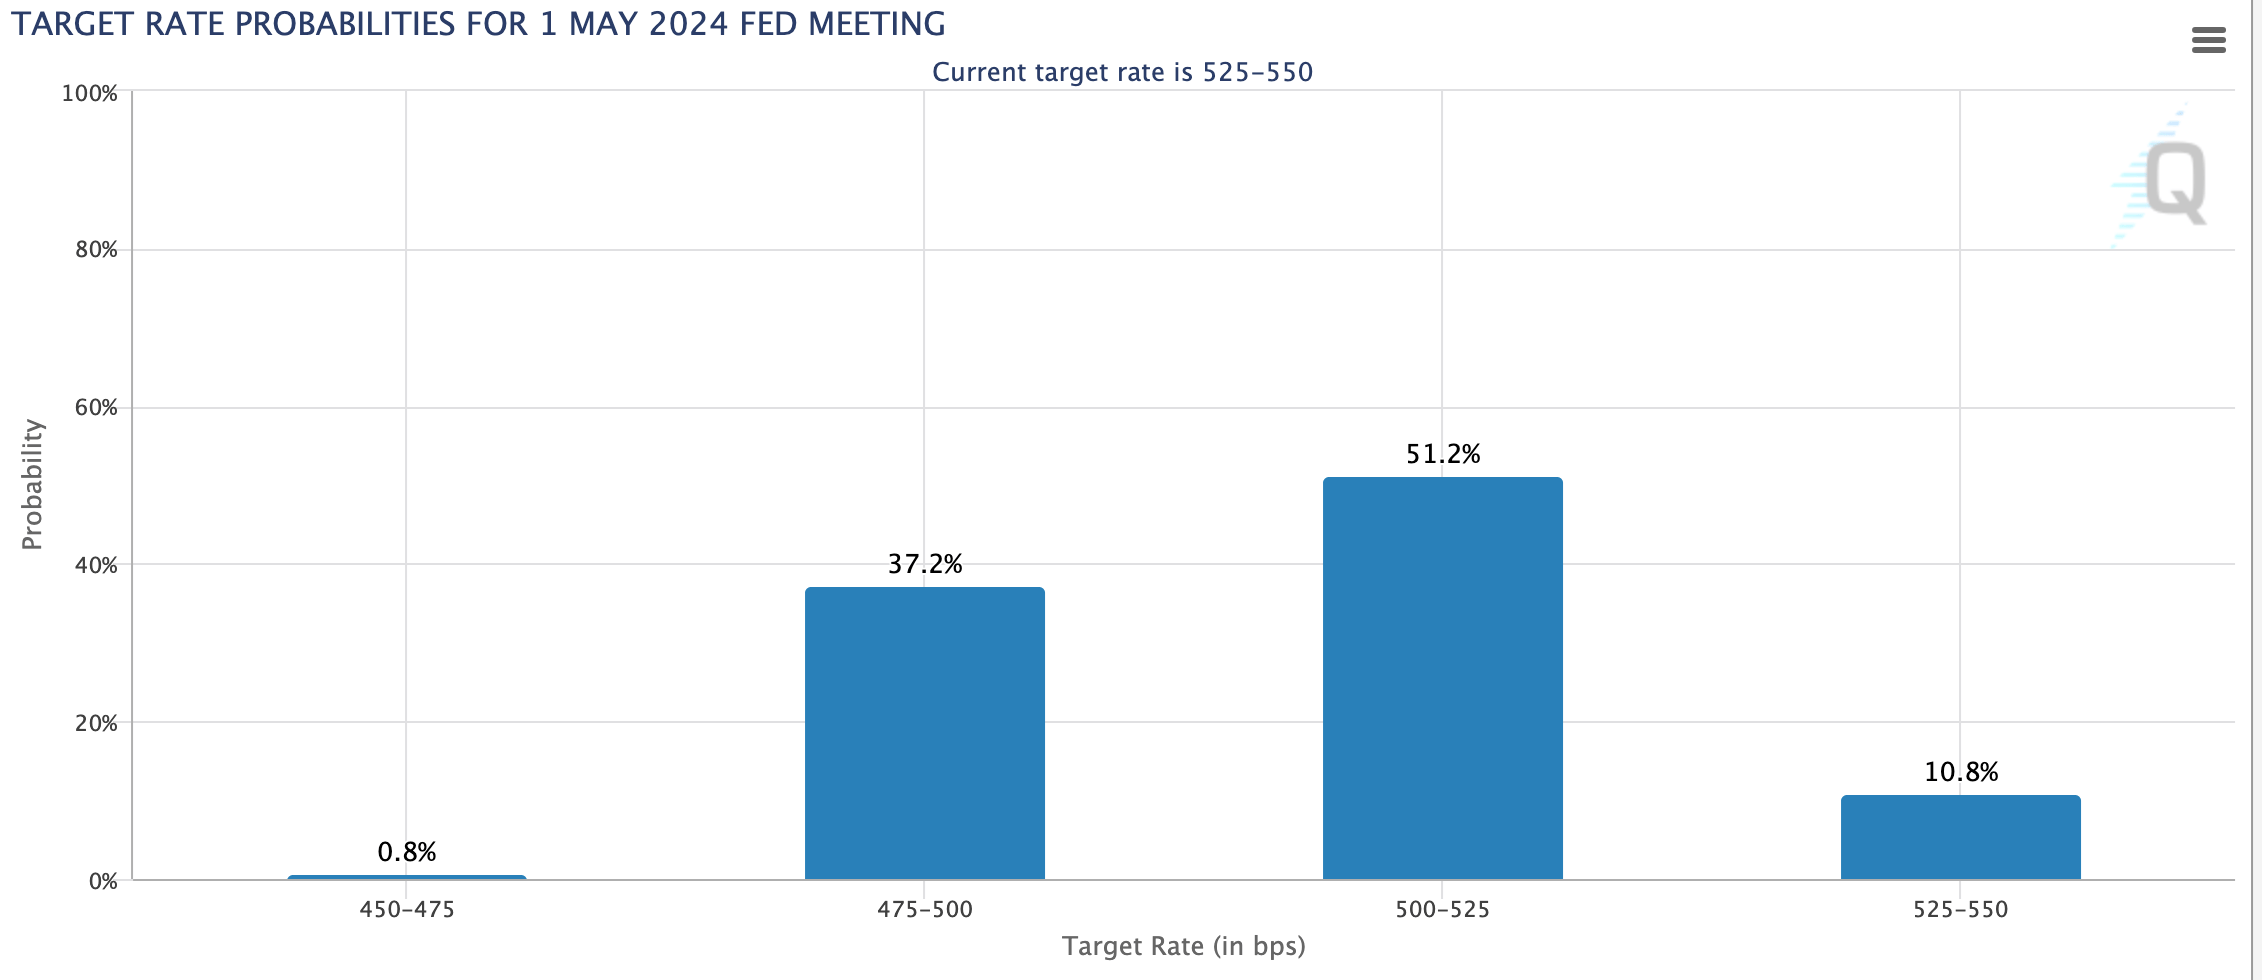
While the CME already provides you with the percentage probabilities (as seen in the graph above), it’s important to understand what’s going on in the background and how these numbers are calculated.
The key here is in understanding the Federal Funds market – a market where banks lend money to each other.
The Fed tinkers with this market by putting money in or draining money out of it to keep rates around its target range, currently at 5.25% – 5.5%.
Meanwhile, like any other asset class, there’s a futures market for the Fed Funds, which is a liquid market traded on the CME.
These are futures contracts traded by banks to hedge, or speculators to make short term gains, on the likely future movements in the Fed Fund rate.
The bottom line is that, by looking at the prices of these futures contracts, we can assign a probability to the future movements of the Fed Fund rate.
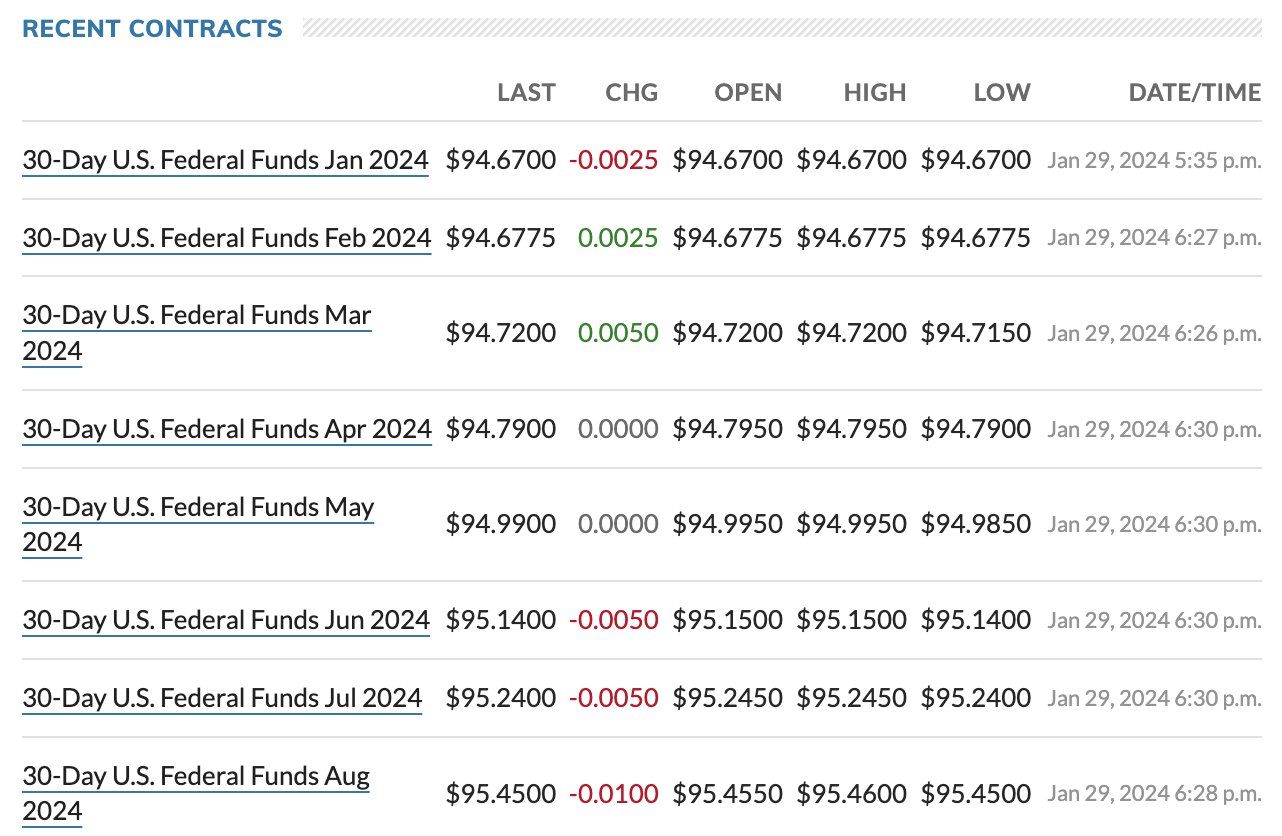
As an example, the May 2024 futures contract (see prices above) is currently trading at US$94.99.
To convert this to an interest rate equivalent, you simply subtract 94.99 from 100 – which gives 5.01%.
Considering that the current Fed fund rate is at 5.25%, this means the market has already fully priced in a 24 basis point cut in May (from 5.25% to 5.01%).
We could easily extrapolate this to see what the probability is for a 50bp rate cut in May. You simply divide 24 by 50 x 100, ie 48%. In other words, there is a 48% chance of 50bp rate cut in May.
Similarly, to find the probability of a 75bp rate cut in May, you simply divide 24 by 75, which gives 32%,
To give another example, the August 2024 futures price is trading at US$95.45 – which implies a rate of 4.55%.
This means a 70bp cut (from 5.25% to 4.55%) has already been fully priced in (i.e. 100% probability) in August.
The Fed however has given a warning to investors to not rely too much on the futures market to predict what the Fed might do.
An excerpt from the website of the Federal Reserve Bank of Cleveland reads:
“On average, futures rates over-predict future Fed Funds Rates, and, depending on whether Fed Funds Rates are falling or rising, the futures rate may consistently overestimate or underestimate the future Fed Funds Rates.”
At the end of the day, nothing in the market is certain.
Related Topics
Related Stories


UNLOCK INSIGHTS
Discover the untold stories of emerging ASX stocks.
Daily news and expert analysis, it's free to subscribe.
By proceeding, you confirm you understand that we handle personal information in accordance with our Privacy Policy.


