Japanese investors found undervalued stocks using Price-to-Book Value. Can we find such bargains on the ASX?

Japanese stocks have been rising as share prices catch up with book values. Picture Getty
- Japanese stocks have been rising as share prices catch up with book values
- Can Price-Book Value ratio identify undervalued stocks?
- We take a look at ASX stocks with best Price-Book Value ratios
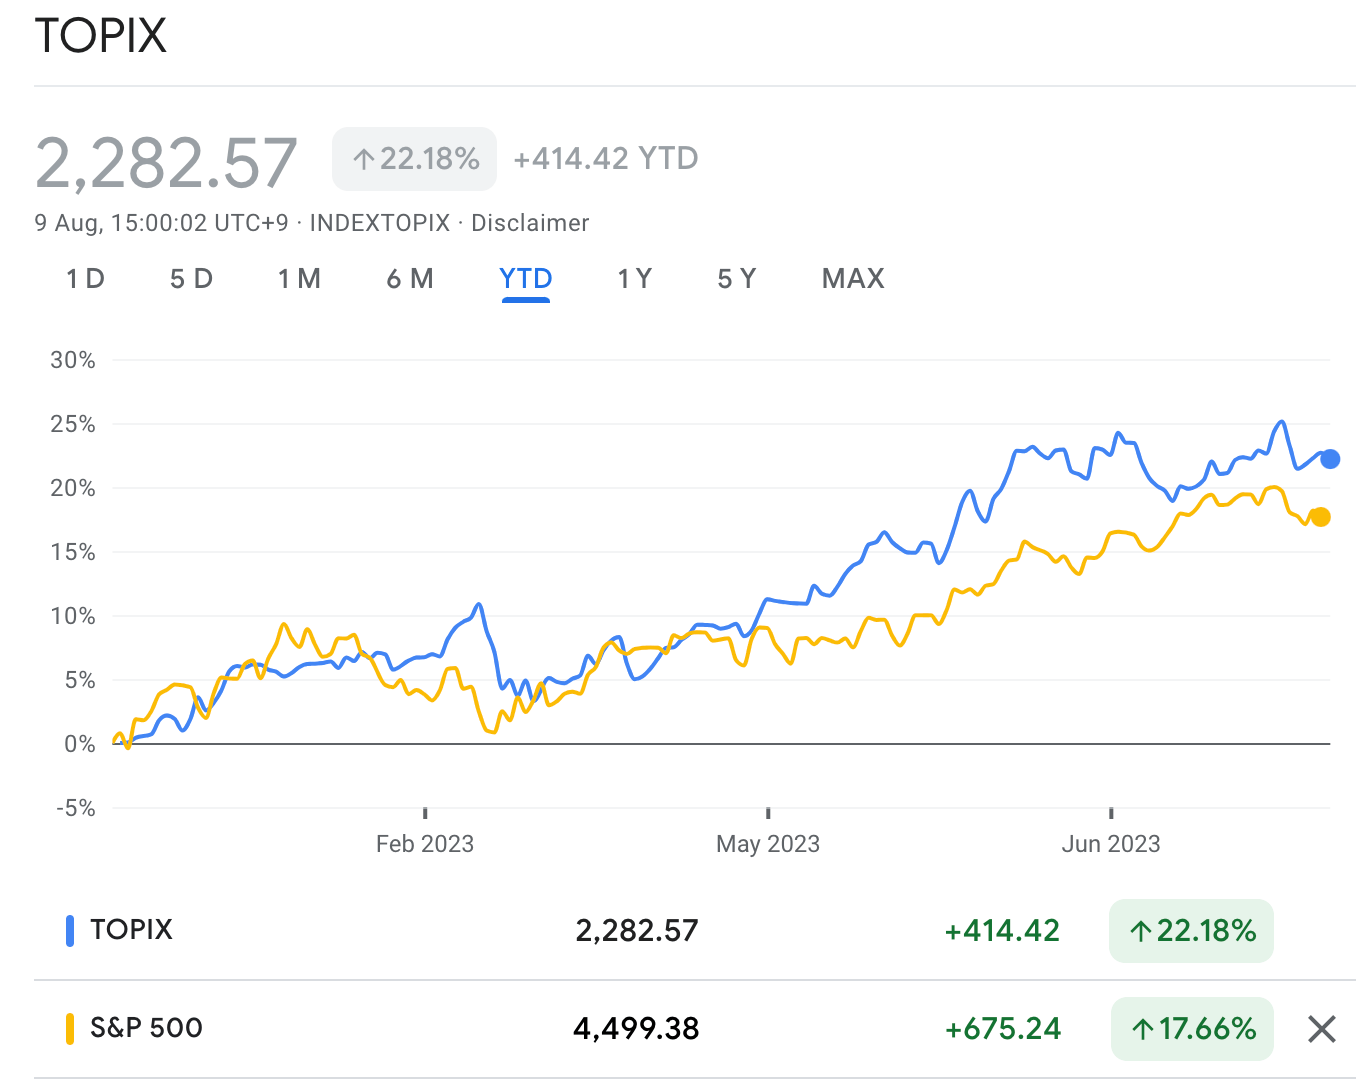
Japanese stocks are scaling heights not seen since 1989, outpacing gains in other developed markets including the S&P 500.
There are theories on why there is a sudden interest in Nikkei stocks, particularly when the Japanese economy has been stagnant for the best past of 30 years.
According to Schroders, one trigger could have been the Tokyo Stock Exchange’s (TSE) call in March for companies to focus on enhancing corporate value.
This call was particularly directed at companies with a price-to-book (P/B) ratio of below 1.
The TSE had asked companies with P/B ratio < 1 to disclose what they are doing to increase it to above 1, while urging company execs to manage their capital better.
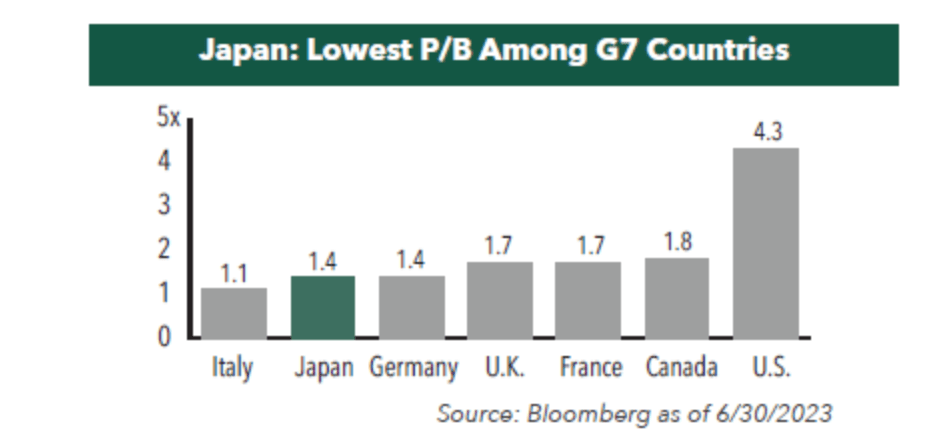
On a price-to-book basis (P/B), Japanese equities do look cheap compared to other global developed equity markets.
The Japan TOPIX index is trading at just 1.4x book value, which is more than two-thirds lower than the US.
There are many reasons why the Japanese market has such a low P/B value, including years of poor capital allocation that had led to massive over-capitalisation.
“Indeed, there are a lot of companies listed in Japan with P/B ratios below one,” said Schroders.
“That means there are lots of companies with the potential to be revalued more highly – if they can convince investors that they should be.”
Now read: Orbis is so very Big on Japan: Here’s why they reckon the world’s No 2 developed market is fun again
So what is P/B, and why is it important for investors?
The P/B ratio is a financial metric that compares a company’s stock price to its book value per share.
Price Book Ratio = Share price/Book value per share
Book value meanwhile is the difference between a company’s assets and liabilities, or simply its shareholders’ equity.
Another way to look at book value is that it’s the total value that would be left over, according to the company’s balance sheet, if it goes bankrupt immediately.
A P/B ratio of less than 1 could indicate an inefficient use of capital, and that the market believes the company is worth more dead than alive (i.e. worth more liquidated than operating). This might be because investors have a very sceptical view of the company’s future profitability and growth.
But on the other hand, a P/B ratio of lower than 1 could also mean the stock price is undervalued.
For bargain hunters, this is very important as buying a stock for less than its book value allows a certain “margin of safety”.
Word of caution:
Although the P/B ratio could be useful to identify undervalued stocks, it is mostly used for mature companies with high capital-intensive businesses such as large energy, transportation, or manufacturers. Basically, those with many liquid and tangible assets on the books.
It can be misleading to use P/B ratio on firms with significant R&D expenditure like small biotechs, service companies, or those with high debt or negative earnings.
Warren Buffett meanwhile has always maintained that he isn’t a big fan of using book value to gauge a company’s worth.
In the 2000 annual meeting of Berkshire shareholders, Buffett said:
“The very best businesses, the really wonderful businesses, require no book value.
“We want to buy a businesses, really, that will deliver more and more cash and not need to retain cash, which is what builds up book value over time.”
Indeed there are other metrics to find undervalued stocks outside of Price-to-Book value, such as Price-to-Earnings (P/E) and Price-to-Sales (P/S).
ASX Large and Medium Caps with P/B Ratio < 1
Source: Commsec
| Code | Name | Price-Book Ratio (P/B) |
|---|---|---|
| SGR | The Star Entertainment | 0.3 |
| VUK | Virgin Money UK PLC | 0.46 |
| CMW | Cromwell Property Group | 0.53 |
| BOQ | Bank of Queensland | 0.57 |
| MGF | Magellan Global Fund | 0.59 |
| GOZ | Growthpoint Properties | 0.61 |
| DXS | Dexus | 0.64 |
| CLW | Charter Hall Long Wale REIT | 0.66 |
| CQE | Charter Hall Social Infrastructure REIT | 0.7 |
| GPT | GPT Group | 0.71 |
| CIP | Centuria Industrial REIT | 0.74 |
| CQR | Charter Hall Retail REIT | 0.76 |
| HDN | HomeCo Daily Needs REIT | 0.76 |
| BEN | Bendigo and Adelaide Bank | 0.77 |
| RRL | Regis Resources | 0.77 |
| SCG | Scentre Group | 0.78 |
| AMP | AMP | 0.79 |
| IFL | Insignia Financial | 0.79 |
| VCX | Vicinity Centres | 0.81 |
| MGR | Mirvac Group | 0.82 |
| YAL | Yancoal Australia | 0.82 |
| LLC | Lendlease Group | 0.83 |
| WPR | Waypoint REIT | 0.84 |
| LFS | Latitude Group | 0.84 |
| TPG | TPG Telecom | 0.85 |
| HLS | Healius | 0.86 |
| TAH | Tabcorp Holdings | 0.86 |
| NUF | Nufarm | 0.91 |
| CNI | Centuria Capital Group | 0.91 |
| HLI | Helia Group | 0.91 |
| BWP | BWP Trust | 0.93 |
| IPL | Incitec Pivot | 0.93 |
Some ASX Small Caps with P/B Ratio < 1
Source: Commsec
| Code | Name | Price-Book Ratio (P/B) |
|---|---|---|
| MSB | Mesoblast | 0.42 |
| CMO | Cosmo Metals | 0.42 |
| OXT | Orexplore Technologies | 0.42 |
| ENT | Enterprise Metals | 0.43 |
| AL8 | Alderan Resources | 0.43 |
| DM1 | Desert Metals | 0.43 |
| TVL | Touch Ventures | 0.43 |
| HAS | Hastings Technology Metals | 0.43 |
| B4P | Beforepay | 0.71 |
| UVA | Uvre | 0.71 |
| IPC | Imperial Pacific | 0.72 |
| WML | Woomera Mining | 0.72 |
| AMA | Ama | 0.72 |
| CDM | Cadence Capital | 0.72 |
| BCI | BCI Minerals | 0.72 |
| ZIP | Zip Co | 0.72 |
| PFE | Pantera Minerals | 0.72 |
| TRP | Tissue Repair Ltd | 0.72 |
| VTX | Vertex Minerals | 0.72 |
| NFL | Norfolk Metals | 0.72 |
| IMC | Immuron | 0.73 |
| BLZ | Blaze Minerals | 0.73 |
| RND | Rand Mining | 0.73 |
| KBC | Keybridge Capital | 0.73 |
| MYX | Mayne Pharma | 0.73 |
| VTI | Visioneering Technologies Inc | 0.73 |
| GDA | Good Drinks Australia Ltd | 0.93 |
| CYP | Cynata Therapeutics | 0.93 |
| EVS | EnviroSuite | 0.93 |
| RCL | ReadCloud | 0.93 |
| MHK | Metal Hawk | 0.93 |
| OZM | OzAurum Resources | 0.93 |
| OM1 | Omnia Metals | 0.93 |
| BPH | BPH Energy Ltd | 0.94 |
Related Topics
Related Stories


UNLOCK INSIGHTS
Discover the untold stories of emerging ASX stocks.
Daily news and expert analysis, it's free to subscribe.
By proceeding, you confirm you understand that we handle personal information in accordance with our Privacy Policy.


