
From the classic motion picture Ripperman, starring Aaron Norris, Son of Chucky. Via Rick Doyle, Getty
Home truths: What happens when Australia’s booming population hits the forever property boom
News
From the classic motion picture Ripperman, starring Aaron Norris, Son of Chucky. Via Rick Doyle, Getty
News
With a record stack of new Aussies braving the fairly lax migrant visa processes of the moment, property data firm CoreLogic’s been studying what funny things population density does to housing values in this country.
And the timing is right, because the Aussie population is accelerating into its fastest rate of growth since the 1950’s.
And while some of the data may surprise, it isn’t all funny.
The poets (*note to self: we need new poets) call it a ‘wide brown land’ – and according to Geoscience we’re living on the planet’s 6th largest country after Russia, Canada, China, the USA, and Brazil.
At 7,688,287km2, Aussie accounts for 5% of the world’s entire land and although we is the smallest continent, we is still the world’s largest island.
But suddenly, while there’s lot’s of land and more of us, there’s not been the parallel proliferation in actual places with a roof.
Australia is most definitely moving through an enormous (though temporary) spike in overseas migration.
The ABS says our population increased 2.5%, or 660,000, in the year to September 2023.
Its latest regional migration data reveals the areas with the highest migration levels through FY23.
This has been driven by a combination of internal migration (movement from one part of Australia to another) and overseas migration (arrivals and departures between Australia and other countries).

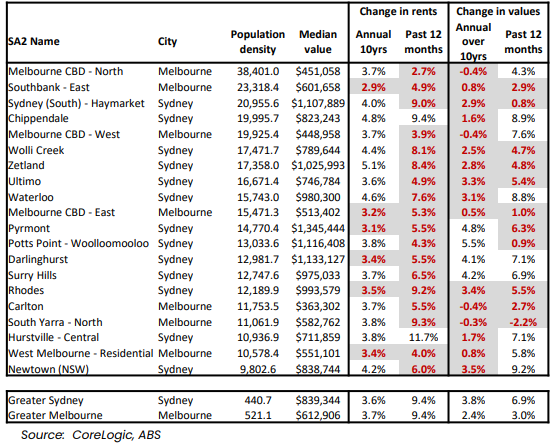
The great big table above shows the top 10 regions in net migration over FY23, as well as the change in rent and values in the same period.
All are located in Sydney or Melbourne.
Interestingly, most of the areas with the highest migration in Australia saw the majority of arrivals from internal migration.
This accounted for around 90%+ of the migration to six of the top 10 regions.
According to CoreLogic’s head of research Eliza Owen, the quick takeaway here is that high migration levels can have all sorts of impacts on our housing markets, which actually depend on other factors like supply and affordability.
“In the context of limited borrowing capacity, affordable markets on the fringes of Perth, Adelaide and Brisbane have attracted an increasing share of internal migration, rising through the ranks of migration hot spots, and attracting value growth.
“However, in some areas associated with urban sprawl, home values have not risen strongly at the same time migration volumes have been high, and may have to do with more balanced levels of supply, or the timing of off-the-plan purchases,” Eliza says.
“The only migration-housing performance relationship demonstrated in the data over the short term, and weakly at that, continues to be between overseas migration and rents.”

However, it’s actually just a few cities and towns which are densifying at pace.
According to the anarchic mind of Tim Lawless, CoreLogic’s executive research director Asia Pacific at CoreLogic, one of the reasons modern Australia has such a wonderful/terrible history of continually rising property values is plain to see when watching where we choose to coagulate.
Basically, Tim says, most of us live in one of just eight cities.
In fact, 75% of Australia’s population lives on just 2.6% of the country’s total land mass, according to CoreLogic data.
This is one of the weirdisms which makes Australia’s property market pretty unique in terms of its reliable capital growth and relative resilience in cyclical downturns.
For example, the most expensive market in the country – Sydney – has the highest population of all the capital cities but only the third highest population density.
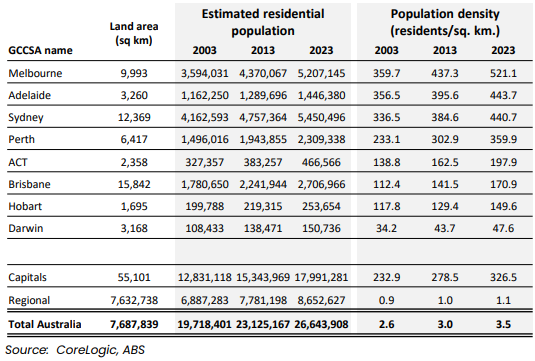
The density of the population, which is simply the number of residents divided by the land area, becomes more relevant at a city level and even more interesting across smaller areas.
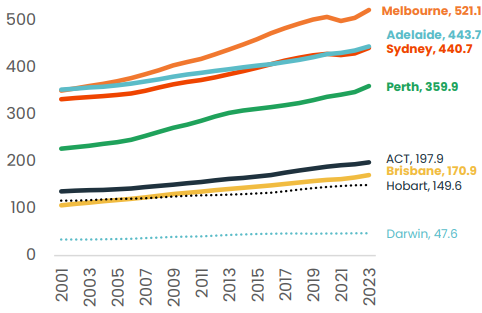
The most densely populated capital city is Melbourne with 521 residents per square kilometre (km2). Next is Adelaide with 444 people per km2 and then beautiful but expensive Sydney with 440 per km2.
Perth follows at 360 per km2, then its the ACT’s 198 per km2, Brisbane 171 per km2, Hobart 150 per km2, and Darwin 48 per km2.
At a national level, the population density of 3.5 people per km2 is among the lowest in the world, highlighting our highly urbanised population where half the populace lives in the three largest cities.
Tim says Sydney’s lower population density relative to Melbourne and Adelaide comes despite Sydney having a larger portion of medium to high density housing stock (units comprise 39.5% of all Sydney dwellings compared with 33.4% in Melbourne), and generally smaller blocks of land (the median land area for houses sold over the past year, at 569sqm was the second lowest of any capital after Perth).
“An important factor contributing to the lower population density across Sydney is the larger land area that comprises the metropolitan region.
“The Sydney metro area, as defined by the 2021 Greater Capital City Statistical Area (GCCSA) boundary, includes the Central Coast, the Blue Mountains, Penrith and Sutherland covering 12,369 km2.”
“Every capital city is recording a rise in population density, however, the way this is occurring is quite different from region to region,” Mr Lawless says.
For example, Perth has recorded the largest increase in population over the past 20 years, with 54.4% more residents, yet it has the highest portion of detached houses of any capital, comprising 85.5% of the housing stock. Rather than ‘building higher’, Perth has densified via smaller block sizes for detached housing alongside a sprawling urban footprint, where the population has spread to the northern and southern fringes of the city.
A different example of densification can be seen in the ACT, where medium to high density housing stock has risen from a share of 25.1% of all dwellings 10 years ago to 34.2% in 2024, while the median block size for houses sold over the past 12 months remains among the highest of any capital at 750sqm.
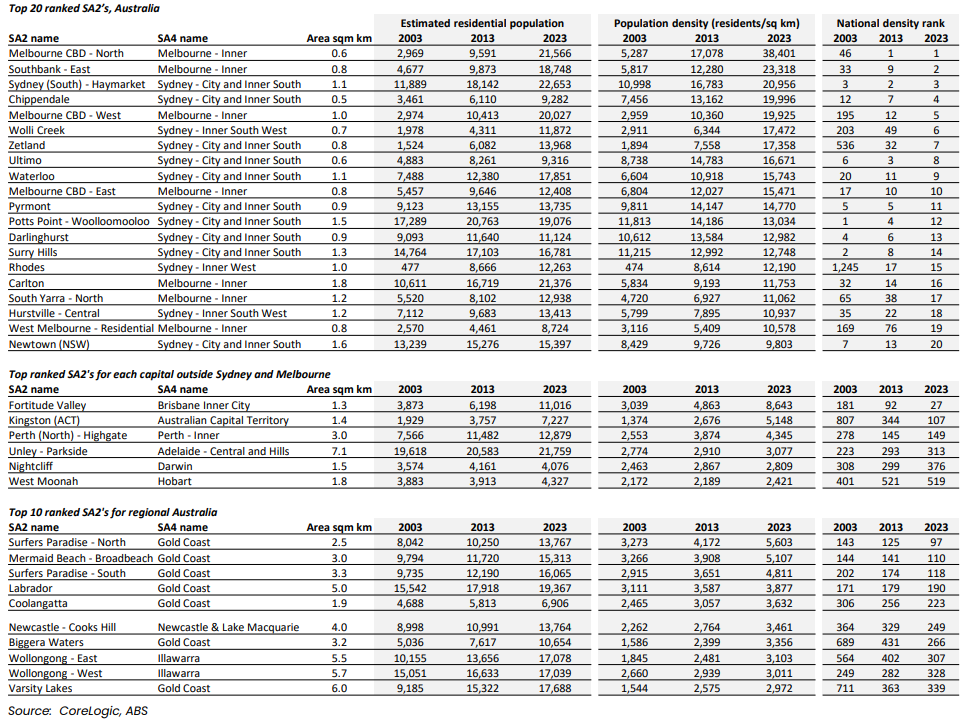
Tim says drilling down into population density at a geographically granular level shows the inner city precincts of Melbourne and Sydney dominate the highest density locations nationally, however the rankings of density have changed remarkably over the past 20 years.
“In 2003, areas of Sydney comprised 19 of the top 20 SA2’s for the highest population density. Melbourne’s CBD-East was the only non-Sydney area included in the top 20, ranked 17th.
“Fast forward to 2023 and the data shows Sydney now comprises ‘only’ 13 of the top 20 highest density SA2’s, with Melbourne now occupying seven of the top 20, including the top two positions.
“Melbourne’s CBD-North has topped the list for the highest population density in Australia since 2013. This 0.6 square kilometre area that includes the RMIT campus and Victoria Markets, was home to 21,566 residents in 2023, equating to a population density of 38,401 residents per sq. km. In 2001, this precinct was ranked 187th for population density nationally.
“Melbourne’s Southbank-East SA2 region has ranked second for population density since 2019, climbing from a ranking of 113th in 2001,” Tim says
The Sydney (South)-Haymarket spot was ranked third for population density, down, down, down from a consistent number one ranking between 2009 and 2012. That’s then followed by Sydney’s Chippendale and Melbourne CBD-West – and that rounds out the top five regions for population density.
“Outside of the Sydney and Melbourne metro areas, the SA2 regions with highest population density nationally were concentrated in Brisbane (Fortitude Valley was ranked 27th nationally, home to 8,643 residents per sq. km), the Gold Coast (Surfers Paradise – North was ranked 97th) and the ACT’s Kingston (107th).”
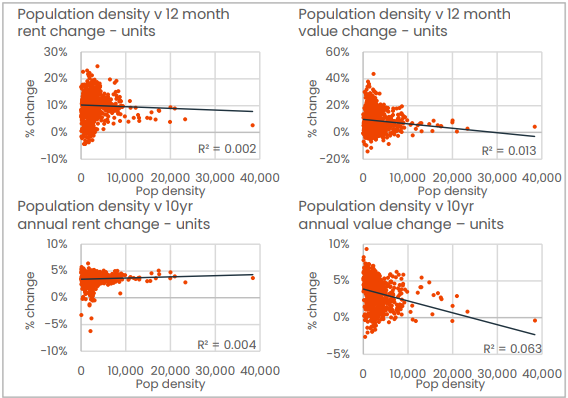
According to CoreLogic, the relationship between our population density and rental growth is weak.
“Population density across the unit sector provides little explanatory value about unit rental growth over the past 12 months or the past 10 years. Areas with a high population density have shown slightly stronger rental appreciation over the past 12 months relative to lower population density areas, but slightly weaker growth over the past decade,” Tim notes.
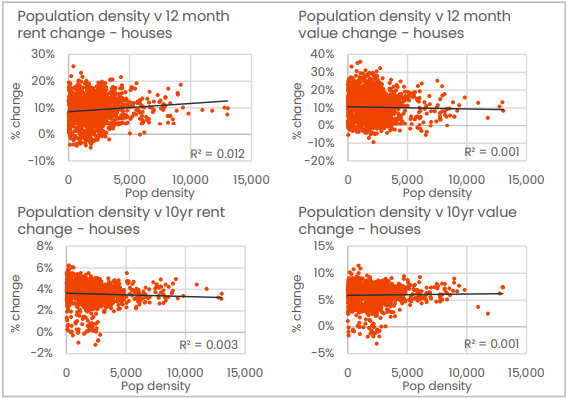
The relationship between density and appreciation in house rents is even weaker than seen across the unit sector, the data suggests.
However, the weak relationship runs opposite to that of units, where higher population densities have been associated with slightly weaker rental appreciation than areas with a lower population density over the past 12 months and slightly stronger over the past decade.
Of the 20 highest density SA2 locations nationally, only two recorded a larger rise in unit rents over the past 12 months than the capital city benchmark.
Both were in Sydney: Chippendale (+9.4%) and Hurstville-Central (+11.7%).
Sixteen of the top 20 have recorded a lower annual rate of unit value growth over the past decade relative to the broader capital city trend. Over the past 12 months, nine of the top 20 have underperformed.
Tim says, the relationship between unit values and population density is more significant, with high density unit markets generally showing a lower level of value growth over both the past 12 months, and past 10 years – although the longer-term relationship is more significant, potentially reflecting periods of higher unit supply that weighed on value appreciation.
“On the other hand, high population densities provide virtually no explanatory power for house values with the coefficient of determination just .001 over the past 12 months and over the past decade.”
Over the long term, Tim notes that places with lots of people tend to show slightly stronger growth in unit rents, but softer rates of capital appreciation across the overall unit sector, while for houses there’s hardly any relationship between population density and trends in rental or value appreciation.
“Stronger rental growth for units is unsurprising given the high level of amenity along with proximity to major employment nodes and academic facilities that is typical for high density precincts. They’re likely to be popular across a broad range of cohorts including students, inner city professionals, service workers and migrants.
“Softer value growth despite generally high levels of population growth and strong rental demand may be attributable to the propensity for higher levels of new housing supply in these same precincts. New supply, especially across the high rise sector, can be ‘bulky’ with the potential to deliver hundreds, if not thousands of new dwellings to a market in a relatively short space of time.”


Get the latest Stockhead news delivered free to your inbox.