Don’t go sell your home just yet, this new property boom’s not as safe as houses

Via Getty
Mad house prices, eh.
The picture this week from the Aussie housing predicterati wasn’t quite one of shock, but did feature a fair bit of mud and confused faces.
But, before three straight months of unexpectedly strong house price rises turns into another tectonic Aussie property shift and everyone goes off house selling and/or buying over the weekend… here’s just a quick few observations from the Commonwealth Bank.
Harry Otley, at the bank’s economics research team, says the current upswing in home prices is perhaps more complicated than most cycles.
There are unique factors at play and history won’t help much as a guide.
“The impact of the tightening cycle on borrowing power has been overwhelmed by the impact of a lack of supply on the market, very tight rental markets and strong population growth.”
Harry says while this might bode well in bumping up house prices and the shape of Aussie banks’ new lending books, the total rise simply ‘may not be as significant’ as what the current view of the housing market suggests.
Follow the money
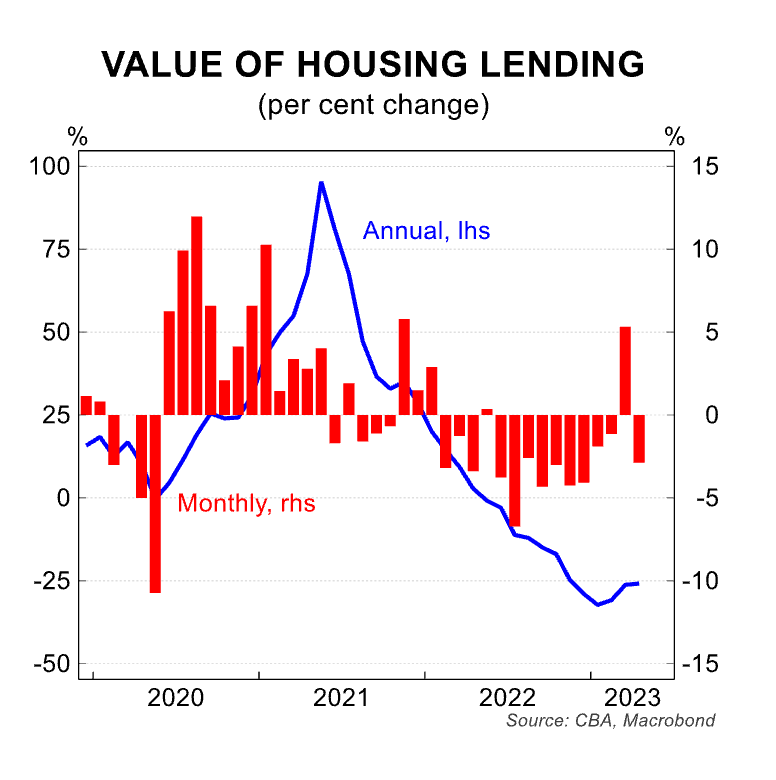
The latest data for new housing lending in Australia fell again in April, by -2.9%.
The result was weaker than both CBA’s forecast of a 1.0% fall as well as the predicterati’s consensus which was looking for way more than that – at a +2.0% gain.
It’s now 25.8% lower over the year.
Indeed – pat on the back for Harry et al – CBA was the only forecaster to have a negative figure pencilled in for the month.
If house prices keep rising, but house sales stay maudlin, then QED, new lending won’t rise as quickly either.
By state, new housing lending fell in NSW (-5.1%), Vic (-3.5%), Qld (-1.1%) and Tassie (-1.0%).
The flow of housing credit increased in SA (+1.0%) and WA (+0.2%). In original terms, the average loan size for owner-occupier dwellings nationally rose from $577k to $585k in the month, a 1.4% rise.
The current figure remains lower than the record high of $618k in January 2022.
NSW has the highest average loan size at $726k, followed by Vic ($599k) and Qld ($520k).
“Recall last month,” Harry says flipping through the I-told-you-so diary, “we were one of the very few market participants to have a positive growth rate forecast for March 2023.” (Which came in at +4.9%, revised to +5.3% in this new ABS release).
“Estimating monthly economic data is a difficult task but our internally generated lending data has given us a good steer in recent months,” he explains.
To the detail…
Owner-occupiers drove the latest downturn, with new lending to that cohort down by 3.8%. Lending to investors also fell but to a lesser degree, down by 0.8% in the month.
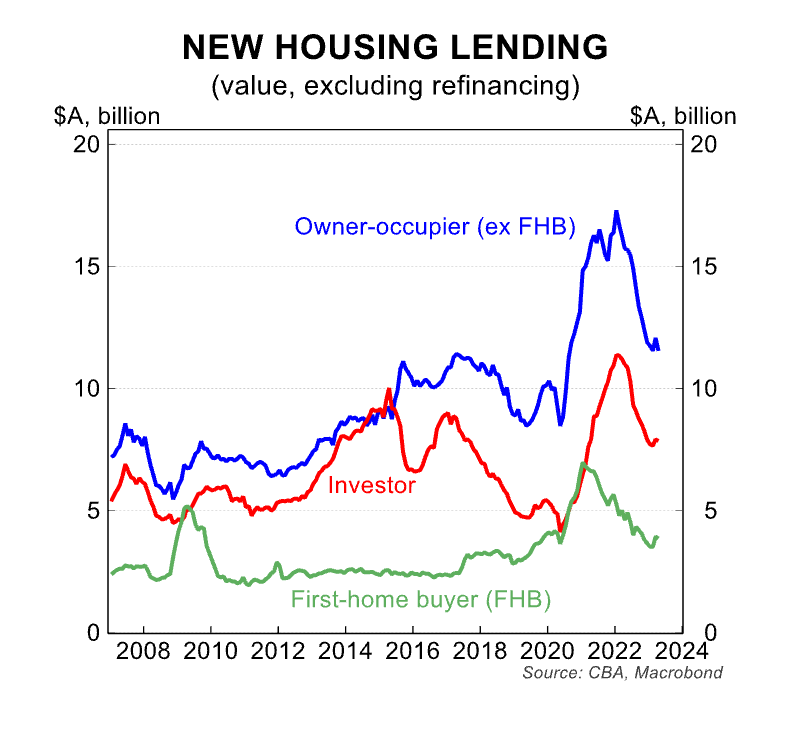
Lending to both owner-occupiers (-24.3%) and investors (-28.6%) remains much lower than a year ago, CBA notes,
The flow of lending to first home buyers (FHB) fell by 2.1%.
Of these cohorts, FHB’s appear to have the most momentum, possibly owing to pressures in the rental market as outlined in last month’s lending note.
External refinancing fell by 9.2% after reaching a record high in March.
“The rapid increase in interest rates led to a large number of mortgage holders to seek out a better deal. This is still occurring at high numbers, but may have peaked,” Harry says.
The fall in lending in April 2023 followed a rise in March which was the first increase since January 2022.
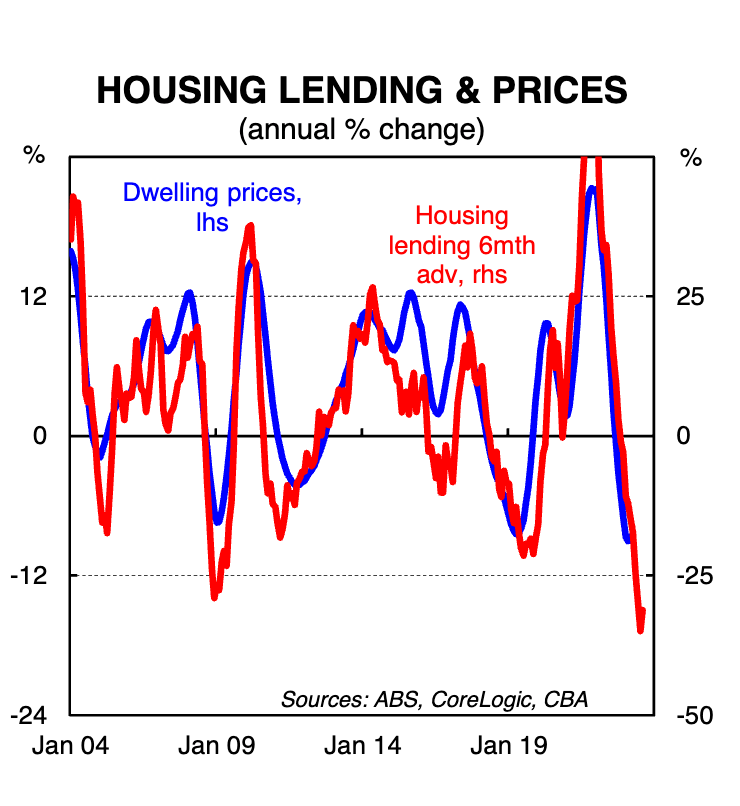
The flow of lending is going to be interesting going forward in the context of a housing market that appears to have built significant price momentum in the last few months, especially in Sydney.
Unsurprisingly, the proportion of borrowers going and choosing the fixed rate lending options, ‘remains very low’.
After peaking at more than 1 in every 2 mortgage holders choosing the fixed rate (hitting 51.3% in mid-2021), the ABS says fixed rate loans made up a teeny 6% of new loans last month.
Still. This was up from 5.5% in March and a low of 4.0% late last year.
“Those believing the RBA has many more hikes to come may be opting for fixed rate loans, though they are firmly in the minority,” Otley adds.
Or it could just be …
Last week, based on a report by legendary Aussie demographer Bernard Salt, Dr Oliver at AMP Capital observed that our national home ownership rate peaked more than 56 years ago – at 73% way. That was way back in 1966.
Since then, the trend has been down, influenced by a combination of demographic trends, rising prosperity and changed perceptions of wealth.
A significant deterioration in housing affordability over the last 30 years has also likely been a key driver of declining home ownership. This risks threatening social cohesion.
The key to improving all of this stuff – the monthly anxiety, the patchy lending, the affordability and the fact that home ownership in the country is looking less possible to more people – is pretty simple.
“Boost supply and encourage decentralisation,” suggests Dr Oliver.
Here’s his four-point plan to save the day:
- Build more homes – relaxing land use rules, releasing land faster and speeding up approval processes, encourage build to rent affordable housing and greater public involvement in provision of social housing.
- Match the level of immigration to the ability of the property market to supply housing – We have clearly failed to do this following reopening from the pandemic, and this is now evident in severe supply shortfalls.
- Encouraging greater decentralisation to regional Australia – the work from home phenomenon shows this is possible but it should be helped along with appropriate infrastructure and of course measures to boost regional housing supply.
- Tax reform – including replacing stamp duty with land tax (to make it easier for empty nesters to downsize) and reducing the capital gains tax discount (to remove a distortion in favour of speculation).
Related Topics
Related Stories


UNLOCK INSIGHTS
Discover the untold stories of emerging ASX stocks.
Daily news and expert analysis, it's free to subscribe.
By proceeding, you confirm you understand that we handle personal information in accordance with our Privacy Policy.


