Via Getty
BROKEN: How are more people losing money when we’re short 300k houses every year?
News
Via Getty
News
The Australian housing market is getting back to its familiar state of profitability after a curly few years, and has been delivering richer riches to sellers since the recovery trend in home values began in March this year.
In the recent June quarter, across this wide brown vacant land, the total nominal profit from resales was $25.8 billion, up from $23.7 billion in the previous quarter, and a low of $21.5 billion in the three months to February this year.
But it has not been all beer and skittles for the more recent buyers – as fulsomely rising interest rates, and a housing market where values are yet to fully recover from the recent downswing have created profit cracks which more buyers are falling into.
Which is extraordinary in itself, as the yawning chasm between residential property supply and increasing demand in this country grows daily.
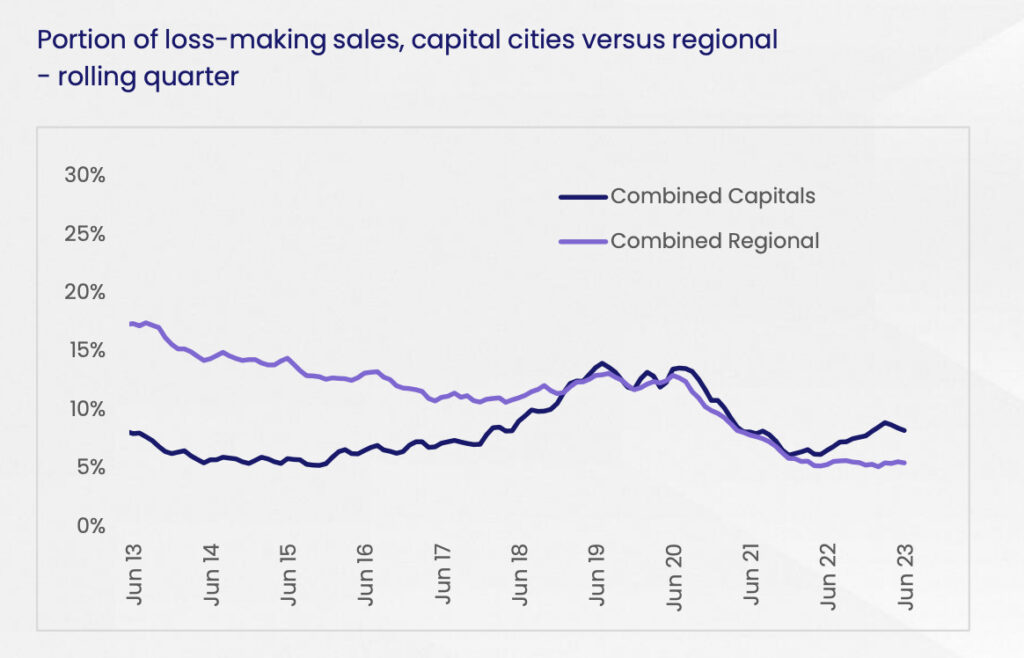
CoreLogic analysis showed another increase in the portion of short term resales, and a higher incidence of loss among these sales. June quarter data some 8.5% of resales, or roughly 8,000 sales, were held for two years or less in the June quarter with the portion of loss-making short-term resales jumping to 9.7%, from just 2.7% a year ago.
But CoreLogic says that during the same period, the rate of profit-making sales increased for the first time in a year, to 92.8% of resales – 40 basis point increase from the previous quarter – and coincides with a 2.8% lift in home values nationally.
However CoreLogic head of Research and report author Eliza Owen said higher rates are likely behind the performance of resales.
“Two years is a significant time period because we are two years on from the height of pandemic-related lockdowns, low interest rates, and have just passed the peak of transitions from low fixed rates to high variable rates,” Eliza said.
“The portion of homes sold within just two years increased by one percentage point to 8.5% over the past year, however the portion of these short-term resales where the seller incurred a loss has increased more substantially, from just 2.7% a year ago to 9.7% in the June quarter.
“This suggests more sellers are willing to incur a loss at the moment, which could in part be the result of high interest rates.”
Eliza says the profile of loss-making sales was not too different from overall resales in the quarter.
“Of the loss-making resales held for up to two years, the median loss was $30,000, compared to a median profit of $75,000 for nominal gains within the same hold period. Houses made up 66.0% of short-term, loss-making resales, and 63.3% were in capital cities,” she said.
Owner occupiers have incurred the most short-term nominal losses at 72.1%, as opposed to 27.9% by investors, a similar split to the portion of overall resales in the June quarter.
🏠 The incidence of profit-making sales nationally increased to 92.8%, up from 92.4% in the previous quarter
🏠 The median gains from resale were $290,000 in the quarter, and the total nominal profit from resales were $25.8 billion
🏠 The median losses from resale were $39,982, and the total nominal losses were $323
million🏠 Net profit from residential resales was $25.5 billion in the June quarter
🏠 Among the capital cities, Darwin had the highest volume of loss-making resales at 34.4%, followed by Perth at 12.3%
🏠 Adelaide was the most profitable market of all the regions and capital cities, with just 1.8% of loss-making sales
🏠 Owner occupiers continued to see a far greater rate of profitability than investors, at 96.3% compared to 88.3% of investors
🏠 The median hold period of resales across Australia was 8.7 years through the June quarter, down from 8.9 years in the March quarter, and almost 10 years in the final quarter of 2022.
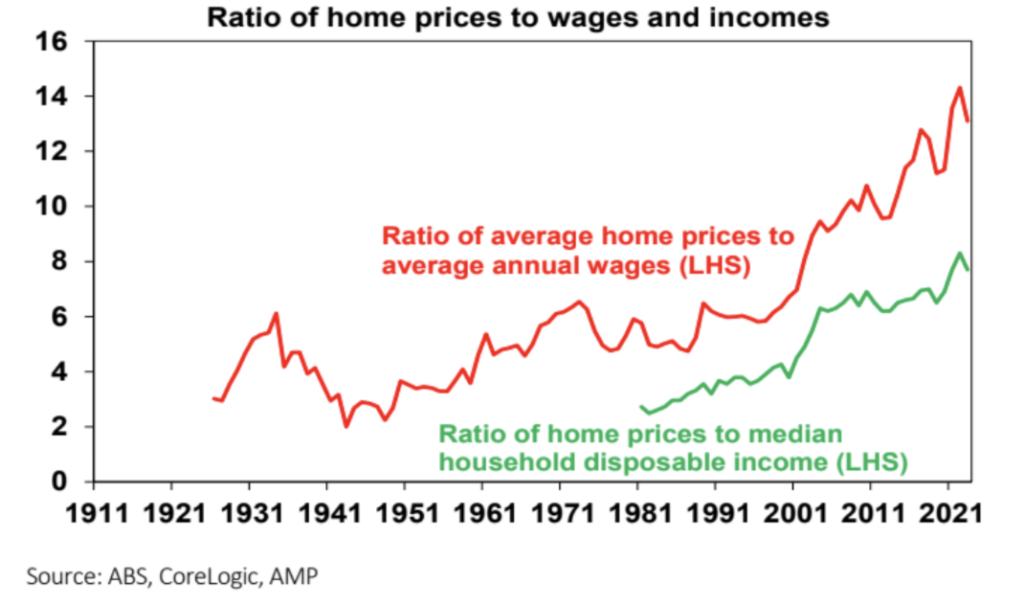
According to the 2023 Demographia Affordability Survey, the median multiple of house prices to income for major cities is 8.2 times in Australia versus around x5 in the UK & US.
In Sydney, it’s x13.3, making the Harbour City the second least affordable housing market in the world, only behind Hong Kong.
Australian markets have a median multiple of 8.2, up from 6.9 in 2019. This is an increase of 1.3 years of median household income.
All five of Australia’s major housing markets have been severely unaffordable since the early 2000s.
Sydney has the least affordable market, with a median multiple of 13.3, the second least affordable market internationally (ranking 93rd in affordability out of 94 markets)
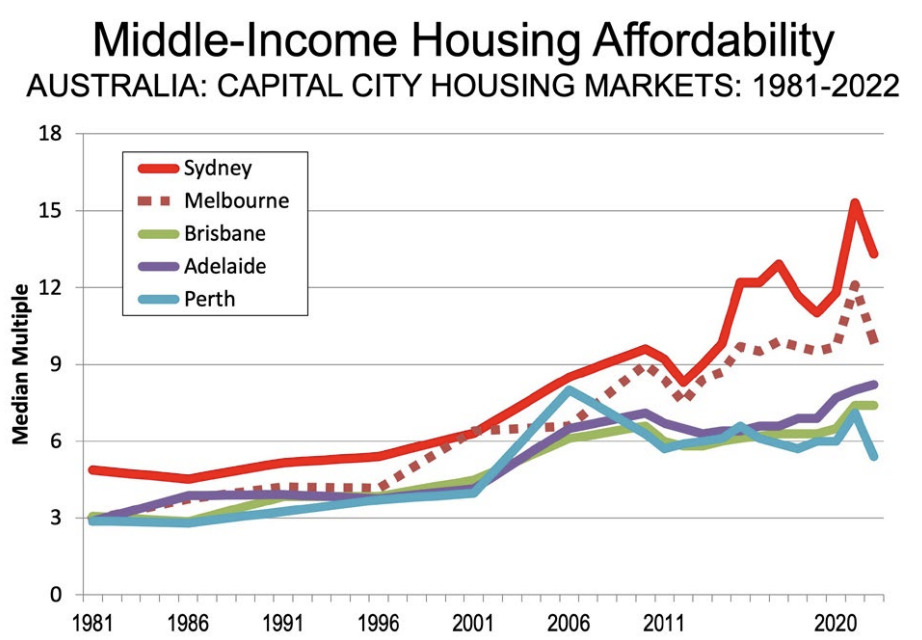
With a median multiple of 9.9, Melbourne is the 86th least affordable of the 94 markets.
Adelaide had a median multiple of 8.2, ranked 81st among the 94 markets. Brisbane, at 7.4 ranked 78th, while Perth, at 5.4 was the 50th least unaffordable market.
Australia’s major housing markets have had especially severe housing affordability losses.
Adelaide median house prices have increased 6.1 times the rate of inflation since 2020, as measured by the Consumer Price Index (CPI).
Sydney prices increased 6.0 times the CPI, Brisbane 5.2 times, Melbourne 4.9 times and Perth 4.2 times.
In each of these five housing markets, the house price inflation since 2000 exceeded that of all of the product groups constituting the CPI (such as food, clothing, transportation and education and health).
The research highlights why some states are now moving to regulate what they’ve got, like whack some curbs on short-stay renting.
On Wednesday, the just released Victorian government’s housing statement includes a 7.5% levy on short-stay accommodation:
While short stay accommodation – like Airbnb or Stayz – has become a popular feature of Victoria’s visitor economy, it’s also reduced the ability for many properties to be used for longer term accommodation.
In Victoria, there are more than 36,000 short stay accommodation places – with almost half of these in regional Victoria. More than 29,000 of those places are entire homes. These are places that cannot be used for longer-term accommodation or rented out on fixed term agreements – so it makes sense that they should provide some benefit toward the places that can.
We’ll introduce a levy on short stay accommodation platforms. The Short Stay Levy will be set at 7.5 per cent of the short-stay accommodation platforms’ revenue. And the revenue raised from the levy will go to Homes Victoria, supporting their work building and maintaining social and affordable housing across the state, with 25% of funds to be invested in regional Victoria. This also means other local council charges on short stay accommodation will be removed.
According to Dr Shane Oliver, head of Investment Strategy and chief economist at AMP Capital, for years now there’s been much discussion about poor housing affordability in Australia, but debate about how immigration contributes to this issue is often lacking.
“For a country with abundant land, it’s ironic that housing affordability is so poor.”
Much of the focus has been of the Band-Aid variety – a few grants here, tax tweaks, subsidies and other means to make it easier for groups like first time buyers.
“But of course, this just boosts demand making affordability worse. In recent times, there seems to be more recognition of constraints on the supply side,” says Dr Oliver.
“But surging immigration levels could easily overwhelm these efforts and lead to an even worse situation.”

March quarter data showed that Australia’s population rose by 563,000 or 2.2% over 12 months, with 454,000 of that coming from immigration.
Permanent and long-term arrival data up to July suggest that the surge in immigration is continuing and we are on track for net immigration of 500,000 or more in the last financial year.
“This would take population growth to 2.5% in 2022-23, its fastest since the 1950s”, Dr Oliver says.
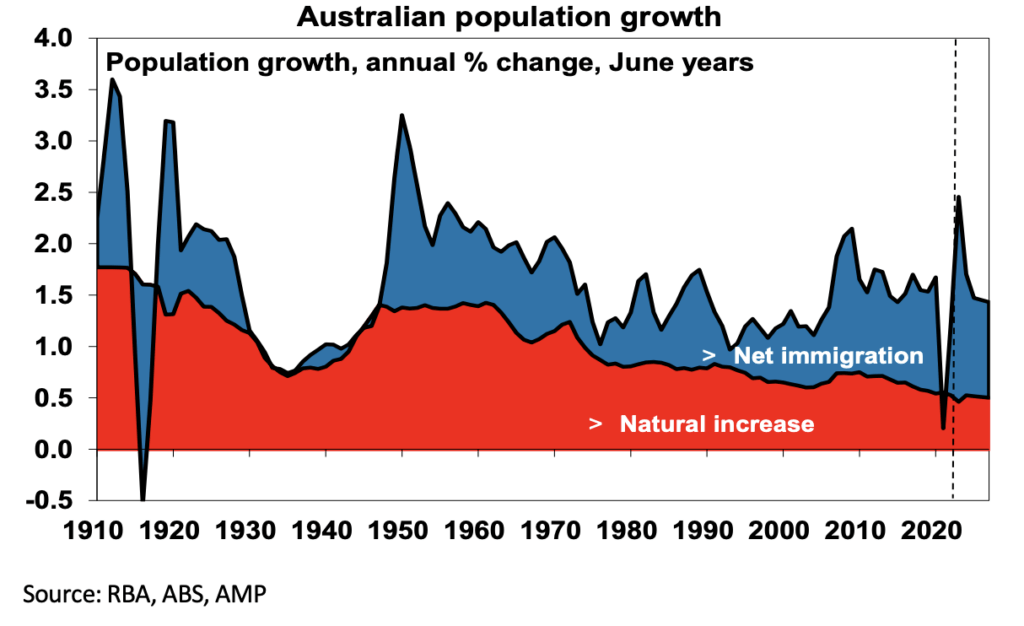
Some of the surge is catch up after the pandemic slump. It will help boost GDP growth and immigration makes for a more dynamic economy. But what really counts for living standards is per capita GDP (and it’s going backwards) & surging immigration is making the housing shortage worse.
At its core, housing affordability is determined by home prices, income levels, and interest rates, Dr Oliver says.
“Whichever way you cut it housing affordability has deteriorated massively in recent decades.”
🏠 The ratio of home prices to wages and household income (which allows for the rise of two income families) has surged since the 1980s.
🏠 The share of mortgage interest as a share of household income is set to rise to record levels once current interest rates fully flow through.
🏠 Since the mid-1990s, the time taken for someone on average full-time earnings to save a 20% deposit has doubled from about 5 years to 10.
Dr Oliver warns that deteriorating housing affordability is driving increasing inequality and could threaten social cohesion.
The good news, says Oliver, is that Australian governments appear at last to be serious about focussing on supply as a key to improving housing affordability.
The new target is to build 1.2 million new homes over five years from July 2024 (or 240,000 pa) – supported by 50,000 social and affordable homes over five years from the Housing Australia Future Fund and the National Housing Scheme.
“Over the five years to 2022 Australia built nearly one million new homes (or 200,000 pa) mostly in the private sector but we need a stretch target to solve the housing affordability issue given a shortfall of 165,000 to 285,000 dwellings by mid next year,” Dr Oliver says.
However, this is not going to be easy.
“First, despite a backlog of approvals yet to be completed we are struggling to complete 180,000 dwellings pa with labour and material shortages and regular failures amongst homebuilders. We may be able to get this back up to 200,000 pa with more units/lower cost housing in the mix (like late last decade) but it’s hard to see where the capacity is going to come from to get to 240,000 dwellings a year.”
Secondly, Dr Oliver notes that in the past there’s been many similarly (albeit less ambitious) supply side commitments and almost all of them have flunked.
“And finally, as noted, the surge in immigration is adding to the already large supply shortfall and threatening to swamp the extra supply commitments governments are making.”
Short-term resales analysis suggests that an unusually high portion of short-held regional properties were sold in the year to June 2023. Resales within two years made up 11.1% of overall regional resales, compared to a decade average of 7.2% per year.
Owen said this shows regional owners are selling up after a short stint of tree change or sea change.
“Around one in 10 regional Australian property sales were held for only up to two years. A further breakdown of this data by SA4 regions shows some of the highest concentrations of short-term resales were in parts of regional Queensland, including Wide Bay (17.3%), the Gold Coast (15.2%) and the Darling Downs–Maranoa region (14.4%).
“This suggests that people might be selling up after trying to live, or invest, in more remote regional or lifestyle areas.”
Despite a relatively short hold period for a high portion of resales, the regions remained profitable for sellers. In the June quarter, 91.9% of homes held for up to two years made a nominal gain from resale, which is higher than the overall profitability of these resales nationally (90.3%).

Outside of short-term resales, the high level trends in profit-making sales broadly show an improvement.
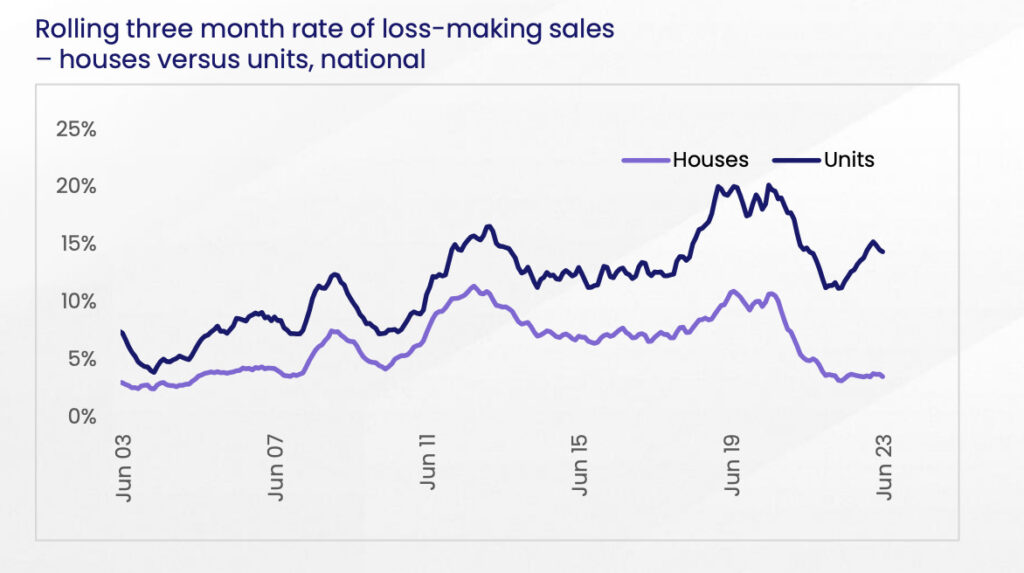
Owen says both houses and units saw an increase in the level of profit-making sales nationally, though unit sellers incurred a nominal loss from resale around four times larger than house sellers.
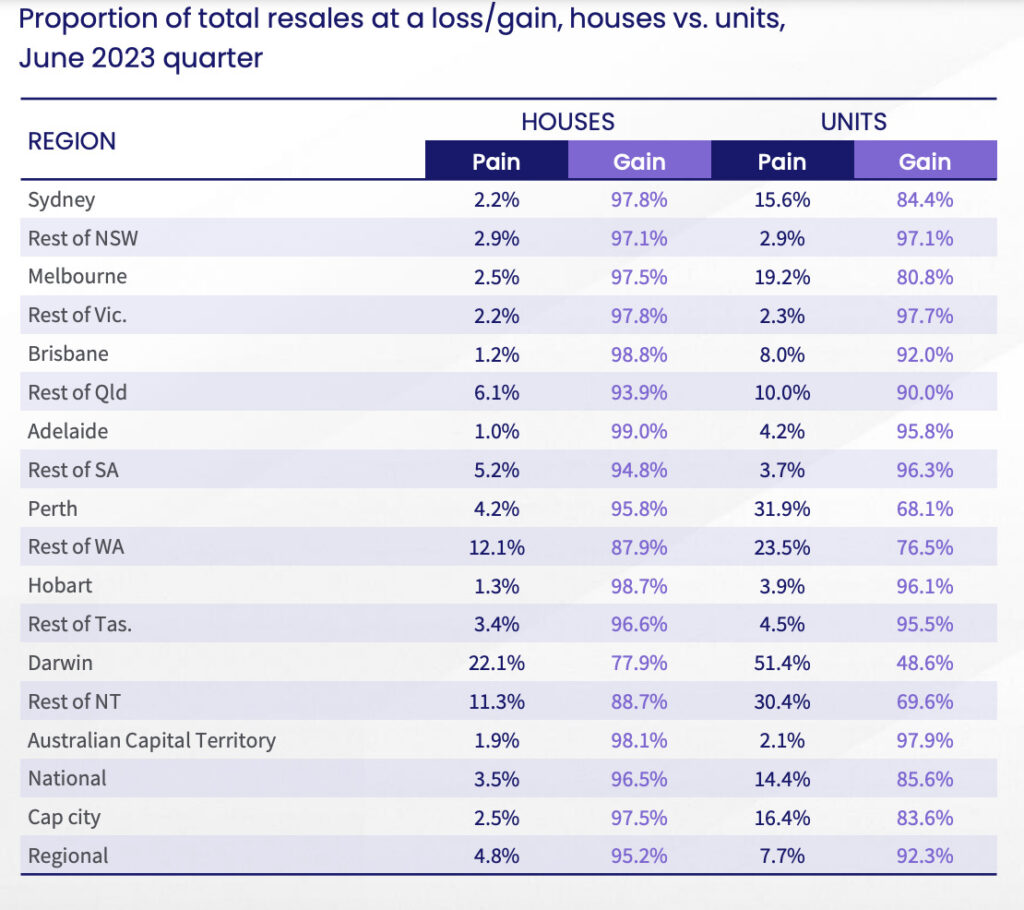
“Only 3.5% of house sales made a nominal loss, down from 3.8% in the previous quarter. Ms Owen said the rate of loss-making house sales has remained fairly low and steady since the December quarter of 2021, remaining below 4.0% since this time.
“The unit sector has seen a lot more weakness in profitability through the recent housing downturn, with 14.4% of unit resales making a nominal loss, or around 4.1 times more likely than house resales.
“However, the rate of loss-making resales declined 90 basis points from the previous quarter, which has served to narrow the gap in the rate of loss-making sales between houses and units, which had hit a record high in the series last quarter.”
Overall, Owen says profitability is expected to continue in line with capital growth trends.
As values remain flat, or falling, across smaller markets like Hobart and Darwin, the rate of loss-making sales may continue to rise. Where housing is most in demand, such as across Perth and Adelaide, the rate of profit-making sales is likely to be driven higher.
Last quarter, Owen notes that the instance of loss-making sales could continue to rise even as home values increased, due to the potential for short-term resales amid rapidly rising interest rates, at a time when home values have not fully recovered from the preceding downswing.
“The rate of profit-making sales tends to follow capital growth trends. With home values continuing to rise through July and August, we estimate the level of profitability from resales will also move higher through the September quarter.”
Check rental vacancy rates near you.
Up until 2005 the housing market was in rough balance. It then went into a massive shortfall of about 250,000 dwellings by 2014 as underlying demand surged with booming immigration.
A structural shortfall of about 250,000 dwellings circa 2014 – as underlying demand surged with booming immigration – was cut into by the unit building boom.
“And we nearly got back to balance in the pandemic, says Dr Oliver. “A rebound in underlying demand on the back of this year’s immigration surge and weak completions has now pushed the shortfall back up to 120,000 and by mid next year it will be around 165,000.
“This makes no allowance for the pandemic induced fall in household size which could take the shortfall up to around 285,000.
“Meanwhile the surge in immigration has pushed underlying demand for homes to an average 220,000 dwellings over the three years to 2025.
“But thanks to rate hikes and capacity constraints dwelling completions look like averaging around 175,000 which means a new shortfall each year of about 45,000 dwellings adding to the already existing shortfall.”
So we’re short somewhere around 330,000 homes a year.

Mining

Mining

Mining


Get the latest Stockhead news delivered free to your inbox.