Aussies vs Kiwis: Who won November?

Pic:Getty Images
- Both the S&P/ASX 200 and S&P/NZ 50 rose in November, joining a vast global rally
- On the ASX all sectors were in the green with utilities leading the winning streak
- Regional fixed income indices finished the month higher, while fear index dropped
For some, it’s a gentle rivalry. For others, it’s an ongoing feud that steadfastly refuses to be settled – like the Hatfields and the McCoys, if they lived on either side of a very, very wide creek and one family spoke with a weird accent and said “bro” a lot more than could be plausibly defended.
But for us here at Stockhead, the ongoing quest to be better than our neighbours across the Tasman at as many things as possible is something that drives our urge to crunch the numbers, wade through the data and analyse things more closely than a short-sighted science nerd.
And that is why we bring you the ultimate in full-contact financial competition.
It’s Kangaroo vs Kiwi, Wombat vs Weta, and Kookaburra vs Kakapo all rolled into one – a veritable Bledisloe of the Bourse, if you will – to find out whether it’s Australia or New Zealand who gets crowned Best in Show for Market Performance, every single month until we lose a few on the trot and pretend this never happened.
Everyone here is excited, the referee (certified Not French) is ready to blow his whistle, so let’s stop with the waffling and get down to brass tacks to see whose numbers have stacked up best, between the ASX and the NZX.
And the winner is…
Drum roll please… Australia. The Australia’s S&P/ASX 200 gained 6.6% in November, building on October’s advance to extend its CY Q4 return to 13.0%. Across the Tasman New Zealand’s S&P/NZX 50 Portfolio had a more muted month but was still up 0.5% in November.
On the ASX, large caps outperformed mid and small caps as the S&P/ASX 50 added 7% versus 5% for the S&P/ASX MidCap 50 and 4.9% for the S&P/ASX Small Ordinaries.
In New Zealand, microcaps were the laggards, with the S&P/NZX Emerging Opportunities Index shedding 0.6%.
S&P Dow Jones Indices (S&P DJI) Global Head of Index Investment Strategy Tim Edwards told Stockhead Australia’s relatively heavier representation in the materials sector was a major factor in its rise over the Kiwis in November.
“The Materials sector makes up a quarter of the Australian market, and its 16% gain this month was responsible for over half of the S&P/ASX 200’s monthly gains,” he said.
“By contrast, there are no representatives of the Materials sector in the S&P/NZX 50.”
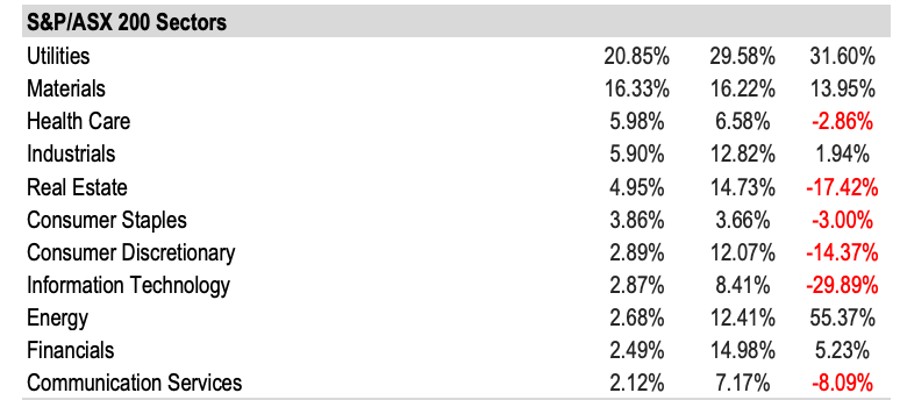
Wash of green for all sectors
The S&P/ASX 200 utilities was the star performer among Australian sectors this month, rallying 20.9%, but even the worst-performing sector, Communication Services, still rose by 2.1%.
“Utilities did well around the world this month, with the S&P Global 1200 Utilities segment rising 8% in US dollar terms but they did even better in Australia, adding a full 22%,” Edwards said.
“There are a few factors at play here, but a common theme is the relative decline in the cost of energy commodities, which are a driver of important input costs to many utilities. ”
The S&P GSCI Energy Index declined 4% in November.
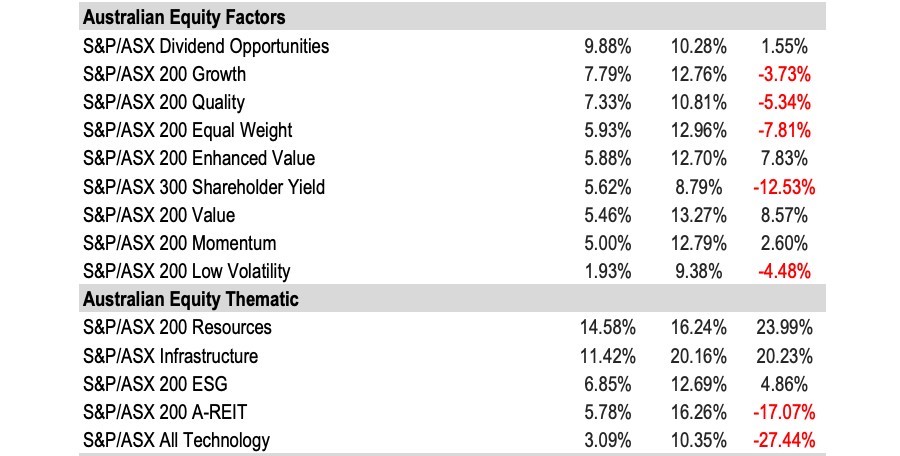
All equity factors up in November
All of our reported Australian equity factor indices rose in November, with the 9.9% gain in the S&P/ASX Dividend Opportunities leading the pack.
Consistent with its long-term track record of lagging in a strongly rising market, S&P/ASX 200 Low Volatility was a relative laggard, advancing just 1.9%.
In terms of equity thematics S&P/ASX 200 Resources led November followed by the S&P/ASX Infrastructure.
Fixed income rises in November
All reported regional fixed income indices finished the month higher. Inflation-linked bonds provided the highest returns in Australia with the S&P/ASX Government Inflation-Linked Bond 0+ Index climbing 2.4% while S&P/NZX Local Authority Bond performing best in New Zealand, rising 1.3% during the month.
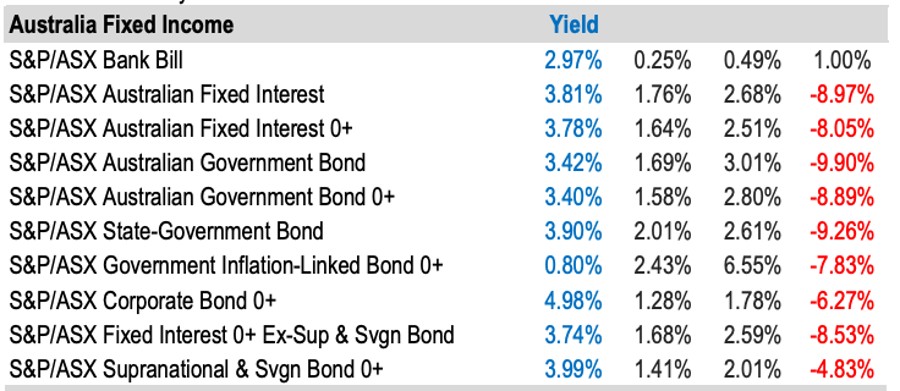
It’s been a rough year for the fixed income markets globally – with longer-dated government bonds in many major markets including the US, the United Kingdom and Australia suffering their worst performances in several decades.
“November’s performances added to a so-far-better Q4 performance, but with all eyes globally on what the US Federal Reserve does next, and on the inflation statistics that will drive their considerations, we may need to see a broader attenuation of inflationary pressures for the better bond performances to continue,” Edwards said.
Easing of jitters in November on ASX
In a further positive sign, reflecting an overall easing of jitters, the S&P/ASX 200 VIX Index dropped 3 points in November to close the month at 13.
The VIX index is used as a tool to gauge market sentiment, and therefore widely referred to as the “Fear Index”.
As Stockhead’s Eddy Sunarto explains, volatility itself is a measure of the speed in which a stock/index price changes. It’s not about up or down, but more to do with how hard the price swings in either direction.
Edwards said market timing and gauging future performance is famously hard but there are a few trends can be identified that may shape the next year or so, including VIX.
“On the plus side S&P/ASX 200 VIX – a proxy for the balance of fear in the Australian equity market – has dropped down over the past month to near its lowest levels of 2022,” he said.
“That’s encouraging, and bulls can find further support in the fact that the Australian equity benchmark is now back in positive territory YTD.
“However, there are certainly dark clouds threatening to cross to the horizon, including the widespread return to lockdowns in China and the high pace of inflation across many developed markets.”
Related Topics
Related Stories


UNLOCK INSIGHTS
Discover the untold stories of emerging ASX stocks.
Daily news and expert analysis, it's free to subscribe.
By proceeding, you confirm you understand that we handle personal information in accordance with our Privacy Policy.


