Aussies vs Kiwis: Who won March and which sector has proven a top performer in Q1 of 2023?

It was a case of Aussie bourse falling less than Kiwi market in March. Pic: Getty Images
- The S&P ASX 200 fell 0.16% in March, while the S&P NZ 50 lost 0.75%
- The S&P ASX 200 consumer discretionary was the best performing sector in Q1 CY23
- Fixed income enjoyed a strong month and quarter in both Australia and New Zealand
For some, it’s a gentle rivalry. For others, it’s an ongoing feud that steadfastly refuses to be settled – like the Hatfields and the McCoys, if they lived on either side of a very, very wide creek and one family spoke with a weird accent and said “bro” a lot more than could be plausibly defended.
But for us here at Stockhead, the ongoing quest to be better than our neighbours across the Tasman at as many things as possible is something that drives our urge to crunch the numbers, wade through the data and analyse things more closely than a short-sighted science nerd.
And that is why we bring you the ultimate in full-contact financial competition.
It’s Kangaroo vs Kiwi, Wombat vs Weta, and Kookaburra vs Kakapo all rolled into one – a veritable Bledisloe of the Bourse, if you will – to find out whether it’s Australia or New Zealand who gets crowned Best in Show for Market Performance, every single month until we lose a few on the trot and pretend this never happened.
Everyone here is excited, the referee (certified Not French) is ready to blow his whistle, so let’s stop with the waffling and get down to brass tacks to see whose numbers have stacked up best, between the ASX and the NZX.
And the winner is…
Australia’s Sevens world champions may have been denied victory, beaten by New Zealand in the inaugural women’s edition of the Hong Kong Sevens, but we won last month on the financial markets, according to S&P Dow Jones Indices Australia and New Zealand Index Dashboard for March 2023.
The S&P ASX 200 fell 0.16% in March, with YTD gains of 3.46%, while across the Tasman the S&P NZX 50 Portfolio fell 0.75% last month reducing YTD gains to 2.19%.
While both markets fell in March, it was a better performance than February and a sign of resilience amidst continued uncertainty for investors.
S&P Dow Jones Indices director of Index Investment Strategy Benedek Vörös said Australian large caps were little changed in March to end the quarter with a respectable 3.5% gain.
Mid and small caps have lagged their blue chip peers both in March and in Q1 CY23. The S&P ASX MidCap 50 was fairly flat finishing up 0.18% in March but is up 4.05% year to date.
Meanwhile, the S&P ASX Small Ordinaries lost 0.72% in March but is up 1.9% YTD.
New Zealand microcaps continued to lag, with the S&P/NZX Emerging Opportunities Index shedding 3.65% in March and 4.27% in Q1 CY 23.
Consumer discretionary tops Q1
The S&P ASX 200 consumer discretionary was the best performing sector in Q1 CY23, up 11.4%. At the back of the pack, financials are down 2.7%, while Real Estate has narrowly escaped closing in the red in Q1 after falling 6.5% in March.
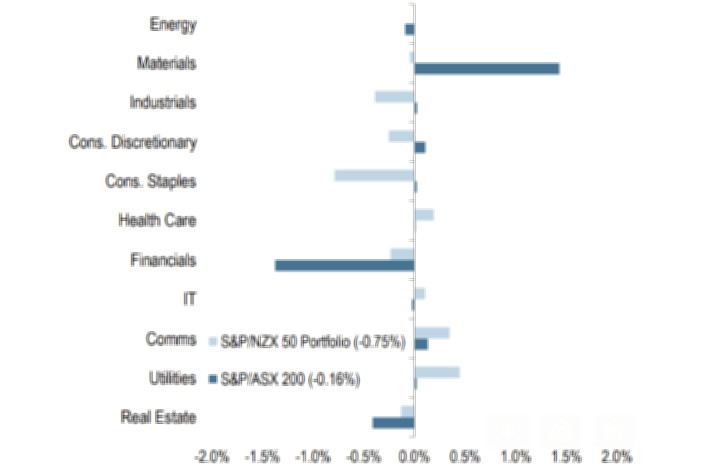
Headline sector contribution March 2023
All but one of the S&P reported Australian equity factor indices closed in the black for Q1 CY23 with Momentum the sole exception, down 1.2%.
Dividend Opportunities performed best both in March and YTD, advancing 1.6% and 6.2% in March and Q1, respectively.
Fixed income enjoys stellar March
After what has been a tough period for fixed income investors, the sector enjoyed a strong month and quarter in both Australia and New Zealand with linkers performing best in both markets.
The S&P ASX Government Inflation-Linked Bond 0+ Index and the S&P NZX Inflation-Indexed Government Bonds Index up 7.0% and 4.3%, respectively in Q1.
Forward rates forecast for the bond markets have come down as fears settled of a banking crisis and consensus seems to be inflation has peaked, which is good news for the bond market as bond prices tend to go up as interest rates fall.
And in some further good news, Australian equity implied volatility barely budged in March and the quarter. The S&P ASX 200 VIX Index closed March at 13, within a point of its level at the previous month end and year-end 2022.
Related Topics
Related Stories


UNLOCK INSIGHTS
Discover the untold stories of emerging ASX stocks.
Daily news and expert analysis, it's free to subscribe.
By proceeding, you confirm you understand that we handle personal information in accordance with our Privacy Policy.


