Actively managed funds vs passive index funds – who won the first half of Game 2022?

Pic:Getty Images
- S&P Indices Versus Active Funds (SPIVA) has come out for H1 CY2022 with active funds falling behind
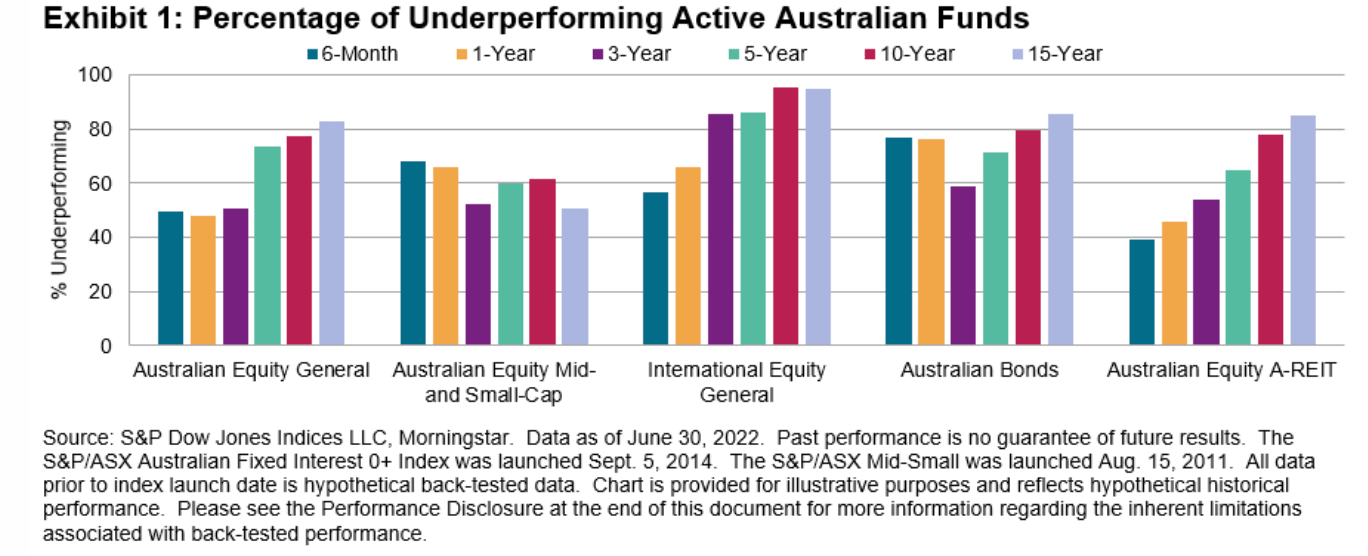
- In the first half of 2022, 50% of Australian Equity General funds underperformed the S&P/ASX 200
- Funds in small caps and fixed income sectors fell behind during H1 as economic volatility wore on markets
Who is winning the actively managed funds vs passive index funds debate in Australia? Well, results are in for the half-time, mid-year 2022 Australian game – and it’s not looking too good for the active managed funds side.
Since the first publication of the S&P Indices Versus Active Funds (SPIVA) US Scorecard in 2002, S&P Dow Jones Indices has become somewhat of a scorekeeper for the ongoing actively managed funds vs passive index funds.
According to S&P Dow Jones the SPIVA Australia Scorecard measures the performance of Australian actively managed funds against their respective benchmarks over various time horizons, covering large, mid and small-cap equity funds, real estate funds and bond funds, providing statistics on outperformance rates, survivorship rates and fund performance dispersion.
In the first half of 2022, 50% of Australian Equity General funds underperformed the S&P/ASX 200, according to the latest SPIVA report. Over the same period, 40% of Australian Equity A-REIT funds underperformed their respective benchmarks.
It was not much better for fixed income and small-cap equity categories with the majority of funds falling behind. An increasing majority of active funds underperformed in every reported category over longer-term horizons.
Market overview
Rising inflation, higher interest rates and surging commodity prices played on economies worldwide during the first half of 2022, leading to broad-based declines in both equities and fixed income securities globally, including Australia.
S&P Dow Jones said in their SPIVA Australia report there have been times in the past when the easiest way to generate outperformance was by getting a few bold selections right.
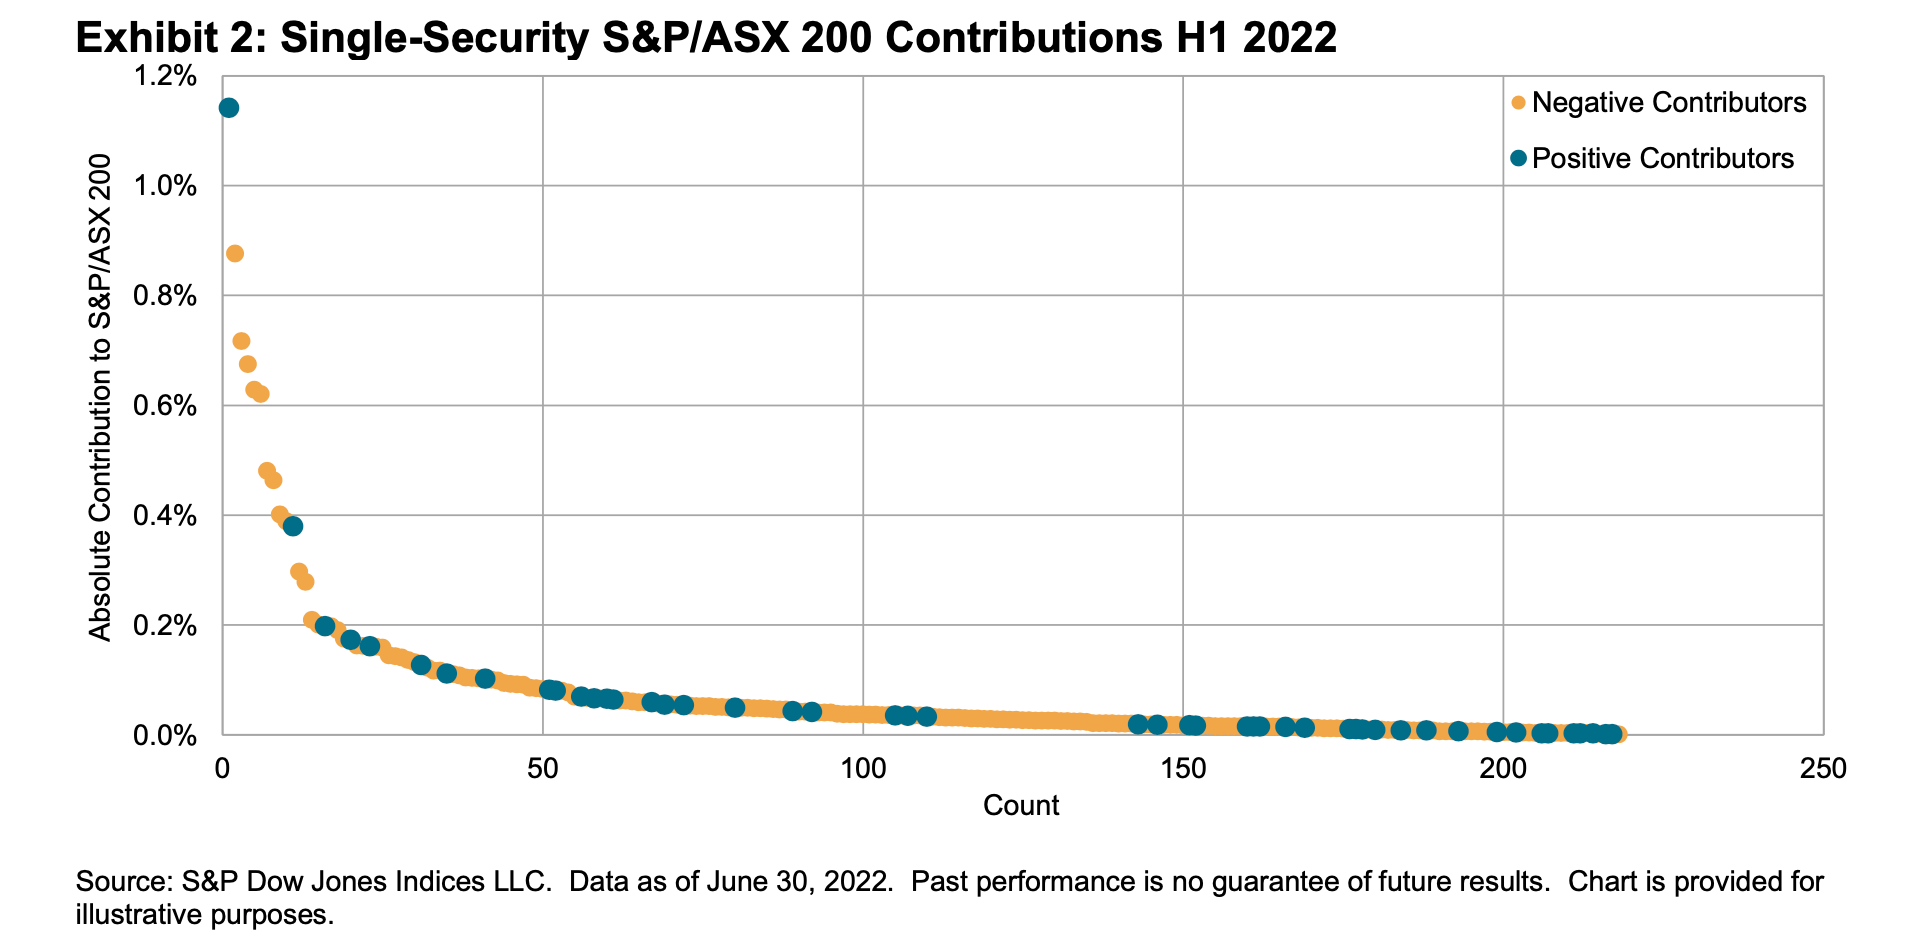
But within large-cap Australian equities during H1 CY22, focusing on a few big names to avoid may have proved more productive with 9 out of the top 10 and 16 out of the top 20 largest absolute contributors to the S&P/ASX 200’s performance having a negative return.
“Although positive returns were available, they were widely dispersed among many small winners,” the report noted.
“Among strategies often favoured by active managers, value benefited from tailwinds in H1 2022, while equal weight lagged capitalisation weightings.”
The S&P/ASX Enhanced Value’s six-month performance placed it on track for the best calendar year in relative terms since 2016, outperforming the S&P/ASX 200 by 10% in the first six months of 2022.
But on the flip side, the S&P/ASX 200 Equal Weight Index is set for its worst year since 2015 in relative terms, lagging the capitalisation-weighted benchmark by 9%.
Australian equity general funds
The S&P/ASX 200 dropped 9.9% in the first six months of 2022 while, according to the SPIVA scorecard, Australian equity general funds shed 10% and 11% on equal and asset-weighted bases, respectively.
Of funds in this category, 49.8% underperformed the benchmark over H1 CY22, with underperformance rates increasing to 73.6%, 77.2% and 82.9% over the 5, 10, and 15-year horizons, respectively.
Australian equity mid and small cap funds feel heat
The S&P/ASX Mid-Small has lost 20.3% in H1 CY22. Just 31.8% of Australian equity mid and small cap funds beat the index, while more than 81% underperformed on a risk-adjusted basis.
Funds in the category lost 24.2% and 26.0% on equal- and asset-weighted bases, respectively, for the same period. The longer-term record within the small- and mid-cap category was relatively stronger, with just 51.0% underperforming over 15 years.
International Equity General Funds
International equity funds returned -17.2% and -16.6% on equal and asset-weighted bases in the six-months ending on June 30, 2022. During the period, 56.9% of funds failed to keep up with the S&P Developed Ex-Australia LargeMidCap. Over the 5 and 10-year periods, more than 85% and 95% of funds underperformed, respectively.
Australian Bond Funds
It’s been a challenging times for fixed income investors and while when there’s prolonged price declines in equities, bond prices generally rise as investors seek a safe haven, this hasn’t been happening during the latest market drawdown.
The S&P/ASX Australian Fixed Interest 0+ Index fell 9.7% in the first six months of 2022, while funds in the Australian Bonds category declined by 9.4% and 8.9% on equal and asset-weighted bases, respectively.
Of the active funds in this category, 77.1% underperformed the benchmark, with a similar record over the longer term: 71.2% and 79.6% underperformed over 5 and 10-year periods, respectively.
Australian Equity A-REIT Funds
In H1 CY22 Australian Equity A-REIT funds posted losses of 22.2% and 22.5% on equal and asset weighted bases, respectively. This category saw 39.2% underperform, although underperformance rates increased over longer time horizons, reaching 85.1% over the 15-year horizon.
Fund Survivorship
Liquidation rates for most active fund categories were moderate in the one-year period ending June 30, 2022. Australian Equity A-REIT funds recorded the highest liquidation rate, at 12.3%.
But in one positive sign for the smaller end of the market only 2.7% of Australian equity mid and small-cap funds failed to survive. Over longer horizons, survivorship rates were significantly lower, with more than 50% of funds merged or liquidated in all but one reported category according to the report.
Stockspot founder not surprised by results
Stockspot founder and CEO Chris Brycki told Stockhead the S&P research mirrors its findings that a simple index ETF outperformed active fund managers both before and after fees.
“The average Australian large cap active manager almost equalled the index ETF returns before fees but fell well short after fees, underperforming by 1.48% p.a. over 5 years. 74% underperformed the index ETF over 5 years, which is consistent with previous S&P research that shows 85% underperform the index over the long run (15 years),” Brycki said.
“A reason for this is that fees eat into the returns over the long-term and can’t match the competitively priced fees that simple ETFs charge.”
“For most investors, a simple rule of thumb is, the longer you are planning to invest, the better you will be by investing in a low-cost ETF rather than paying higher fees to an active fund manager.”
Related Stories


UNLOCK INSIGHTS
Discover the untold stories of emerging ASX stocks.
Daily news and expert analysis, it's free to subscribe.
By proceeding, you confirm you understand that we handle personal information in accordance with our Privacy Policy.


