A Touch of Klassen: How to know when an average economic median doesn’t mean anything

Upside down. Via Getty
In this Stockhead series, the closet mathematician and financial model maker – Nucleus Wealth’s head of investment Damien Klassen – examines and explains the many curly corners of understanding global equity markets.
Damien has a wealth of experience across international equities (Schroders), asset allocation (Wilson HTM) and spent eight years as a founding shareholder of Aegis Equities, one of Australia’s largest independent research firms, Aegis Equities.
But what gets him out of bed are the extensive new methods he’s mapped in research procedures for equities, structured products, hybrids and alternative assets.
When an economic average doesn’t mean anything
In macroeconomics, there is a firehose of data and it never turns off. The flood means you can swim with or against the current, in whichever direction looks safest.
So to are the Days of our Investments. Pick your bias, and you can usually find something to support it.
In this iteration of post-COVID equity markets it’s easy to differentiate. Currently the bulls can point to historical growth – the hard data.
The bears point to surveys and expectations measurements – the soft data.
Stock markets rely on earnings. Paradoxically, they show the opposite. Share prices are often measurements of future value.
When it comes to the streams of information around a stock, an asset or an economy, the bears can point to the hard data: Actual earnings have been bad. But, the bulls can point to the forecasts, where sunshine and roses are the order of the day.
Clearly, both cannot be right.
Historically, stock markets have been the most prone to optimism. And even the hard macroeconomic data is starting to see some cracks. My expectation is that this will be the same once again.
Macroeconomics: Soft vs Hard Data
In financial jargon, data types range between soft and hard.
Soft data consists of surveys and forecasts. Less reliable but usually much more timely. Hard data consists of confirmed results. Hard is much more reliable but arrives after the fact.
Usually, soft data leads hard data.
For example, when it comes to employment:
- First, surveys say businesses are planning to slow hiring.
- A few surveys later, they show hiring slows.
- Then, announcements of layoffs.
- Finally, we see the unemployment rate rise.
Sometimes, it is different.
The soft data signals a problem, but something intervenes, and the problem doesn’t make it to the hard data. That may be the case this time. But there is such a broad and persuasive set of soft data showing problems that it is difficult to believe the soft data is wrong.
Can you come up with an alternative explanation?
Case in point, take the Seek (ASX:SEK) jobs data showing an extraordinary divergence between the number of applications and the number of ads:
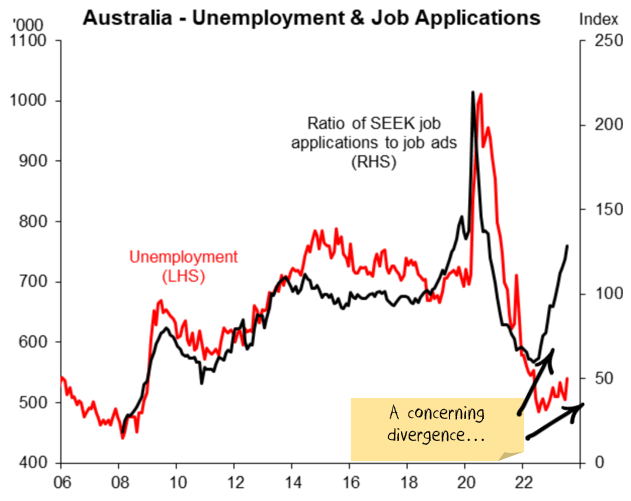
The obvious indication? It is a sign that workers find it difficult to get jobs. And rising unemployment is coming.
But I can paint a similarly bullish picture from the same data as well.
This time is different. The divergence may also be a sign that the record rates of immigration being run at the moment have resulted in a bottleneck of workers looking for jobs. Once they all settle in and start earning, there might be a subsequent boom in spending.
The problem with alternative explanations
On its own, the above story might be enough. The problem is that you are going to need a lot of alternative explanations.
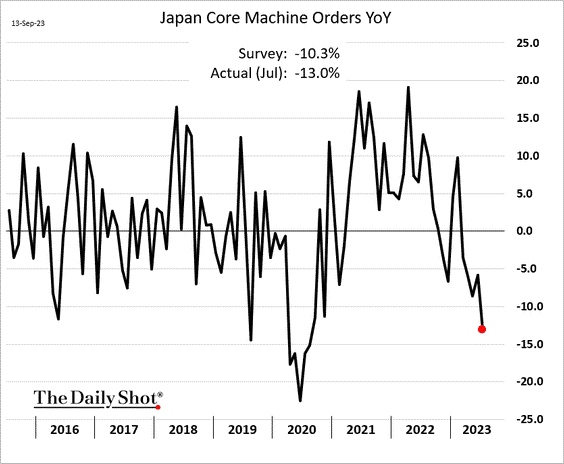
Japan is a big manufacturer; you need to explain why machine tools are in the toilet:
And why fellow manufacturer, Germany, have such pessimistic companies:

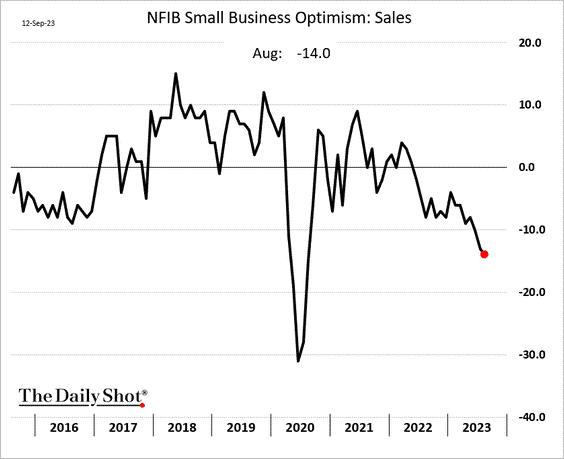
Or why small businesses in the US are so worried about future sales:
Throw in an explanation of why Chinese property starts are crashing. I could go on with rising bankruptcies, lack of credit growth, weakening capital expenditure plans and a dozen other forward-looking indicators.
At some point, maybe the simple explanation is the right one. Perhaps rather than a contorted alternative explanation for every indicator, the outlook is simply not that good.
Company earnings
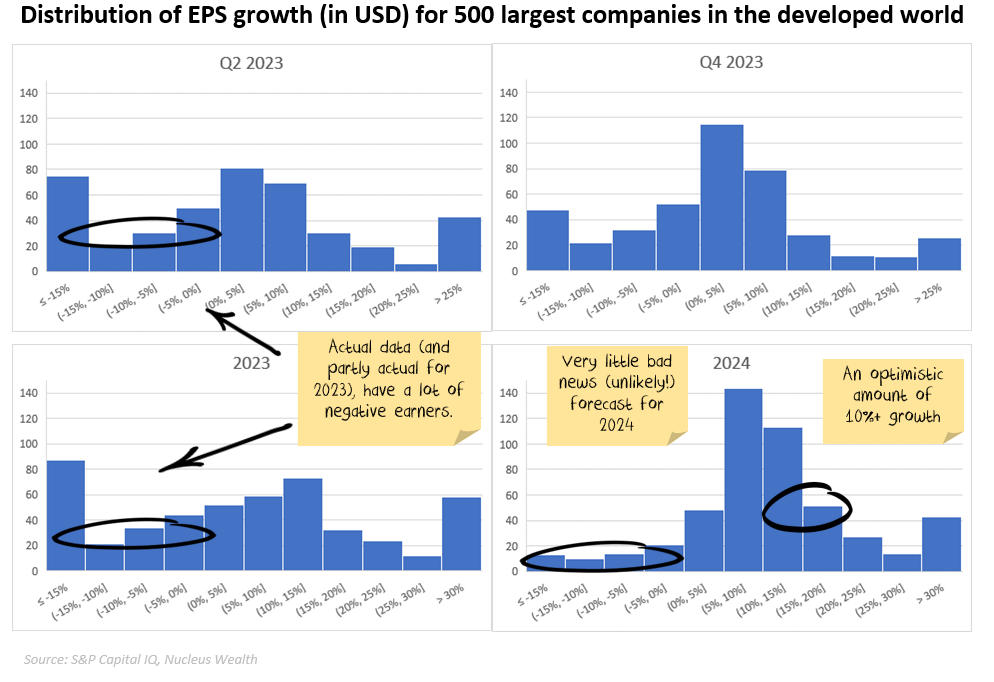
Here is where we turn things upside down. The actual data is bad, but the forecast data is excellent:
- Earnings have already been running at a negative clip. Q1 and Q2 earnings were both down around 5%.
- But, forecasts are for that to stop. Q3 earnings are currently expected to be around 0%.
- Q4, which starts in around two weeks’ time, has earnings expected to be up close to 6%.
- 2024 earnings are expected to be up over 10%.
Is that all AI and tech? In Q3 and Q4, yes. All the growth comes from NVIDIA, Alphabet, Microsoft, Apple, Amazon, Meta. The other 494 stocks combined in our world sample are forecast to detract from growth.
In 2024, that is not the case. Only 2.4% comes from the big six, the other 7.8% comes from the rest of the market.
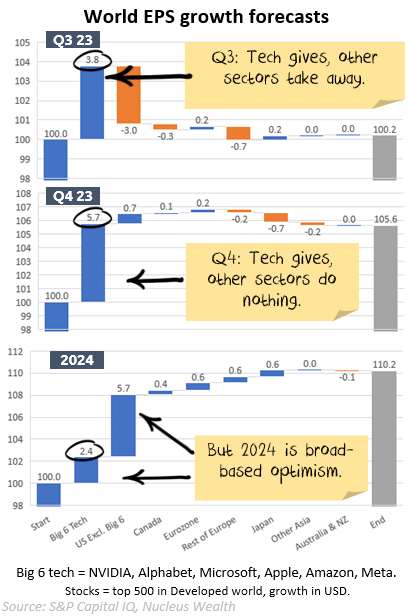
Half of the top 500 companies are expected to grow by more than 10%. Almost a third are expected to grow by 15% or better.
China’s expectations also diverge from reality
China is hugely important for Australia. Around 30% of the ASX is in mining and energy stocks, and there is a massive exposure to government revenue via high commodity prices.
China is very much another case study in expectations vs. results.
In November 2022, China issued a sweeping directive to rescue its property sector. Iron ore rallied hard, up 50%. The problem? There was a lot of noise, not a lot of concrete measures.
My take at the time was that the plan did not change the fundamental demand for new construction. For the most part, the elements were either (a) directives to various banks to lend more to developers, focussed on completing existing projects, or (b) reduced debt constraints or rules on individuals buying houses. Averting catastrophe rather than returning to the old normal.
But I closed my resources underweights anyway, until the euphoria dissipated!
So far, that has turned out to be true. There were more property announcements the next month after November. And the next. And the next. In fact, almost a year since the rhetoric changed, property starts are still falling:
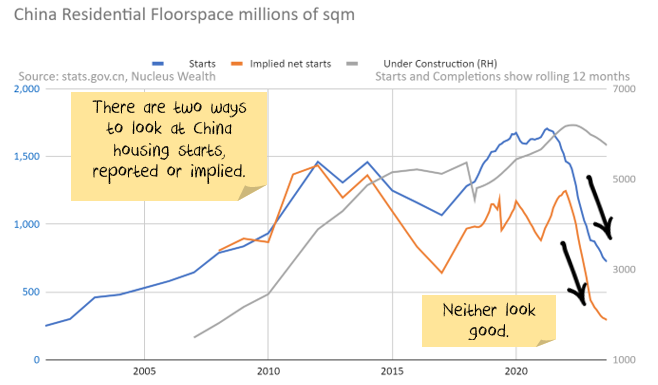
And the Chinese government’s measures are still about completing existing projects. And solving the debt problem with more debt.
Markets seem to be pricing in an expectation that things are so bad in Chinese property that broad stimulus must be coming. I dug into that story last month. Even in the most recent month’s improvements in China’s economy, there was very little for the property optimist to hang on to.
This is China’s fourth attempt in the past dozen years to wean itself off its property construction addiction.
They lost their nerve on three prior occasions. Almost a year of (effectively) the same announcements repeated are thought to be a sign that China had once again lost its nerve. The events on the ground do not support that view.
When does reality bite?
At the moment, it seems markets are pricing for all of the following to occur:
- Forward macroeconomic indicators will be shown to be wrong
- Earnings growth will roar in 2024
- China’s property market will return to growth
They might all happen. But each seems individually unlikely. And so the odds of all occurring will require some new deus ex-machina. An unexpected, dramatically positive development. Could that be AI? We looked and concluded that it was not large enough in the short-term.
I hope that something positive will emerge.
But I won’t position my investments like it is an inevitable outcome.
Damien Klassen is the head of investment at Nucleus Wealth.
He has a wealth of experience across international equities (Schroders), asset allocation (Wilson HTM) and 8 years as a founding shareholder of Aegis Equities, one of Australia’s largest independent research firms, Aegis Equities.
He runs the investment side of Nucleus Wealth, selecting stocks suggested by analysts and implementing the asset allocation.
Damien’s lectured for over a decade at the Securities Institute, Finsia and Kaplan and spent many of those years as the external Chair for the subject of Industrial Equity Analysis.
The views, information, or opinions expressed in the interviews in this article are solely those of the interviewees and do not represent the views of Stockhead. Stockhead does not provide, endorse or otherwise assume responsibility for any financial product advice contained in this article.
This story does not constitute financial product advice. You should consider obtaining independent advice before making any financial decisions.
Related Topics
Related Stories


UNLOCK INSIGHTS
Discover the untold stories of emerging ASX stocks.
Daily news and expert analysis, it's free to subscribe.
By proceeding, you confirm you understand that we handle personal information in accordance with our Privacy Policy.


