Power Up: Energy demand is recovering, but who’s winning?
Will uranium take the energy demand crown? Pic: Getty Images
Energy is an essential piece of modern life and while energy demand fell in 2020 due to the impact of the COVID-19 pandemic, emerging markets and developing economies are expected to drive a 4.6 per cent increase in demand.
In its Global Energy Review 2021, the International Energy Agency noted that demand in emerging markets and developing economies is set to rise to 3.4 per cent above 2019 levels while energy use in advanced economies is on course to be 3% below pre-pandemic levels.
So just how do the different sources of energy shape up?
At first glance, it doesn’t look good for uranium, what with prices sliding for a third straight week and the IEA noting that power generation from nuclear energy is expected to be up just 2 per cent this year, half the 4 per cent decline in 2020.
Nuclear power also accounts for just over 4 per cent of global primary energy consumption in 2019.
Despite this, the outlook for the nuclear fuel to meet future energy demand is looking increasingly positive with several countries already looking to expand its use to help slash emissions.
Existing nuclear power capacity and advanced reactor technology is part of the US plan to slash its carbon dioxide emissions by 50 per cent while Russian President Vladimir Putin referred to low-carbon energy sources, including nuclear, as part of the international effort to address climate change.
China is also in on the game. Its recently completed 14th Five-Year Plan includes plans to increase nuclear power capacity to 70 gigawatt equivalent by the end of 2025 while the China Nuclear Energy Association expects the country will have 200GW of nuclear capacity by 2035.
Even Japan is looking at increasing its nuclear power generation capacity, with its 2018 Basic Energy Plan flagging that nuclear power could generate between 20 per cent to 22 per cent of its generation capacity by the end of the decade to meet energy demand.
Growing energy demand drives fossil fuel bonanza
Coal and gas are also expected to see gains this year with the IEA expecting recovering economic activity to reverse declines in 2020.
Demand for coal is likely see a 4.5 per cent increase, taking it above 2019 levels thanks to increasing use in Asia.
Meanwhile, gas is on track for the biggest rise of any fossil fuel relative to 2019 with energy demand expected to climb by 3.2 per cent to 2021 due to increased demand in Asia, the Middle East and Russia.
Higher carbon prices in Europe have also provided some support for gas over coal.
However, the sluggish aviation sector means that oil’s rebound will be sluggish compared to its compatriots with the IEA flagging that despite a 6 per cent increase over 2020 levels, demand will remain 3.2 per cent below 2019 levels.
And the winner is …
Renewable energy. Were you expecting something else?
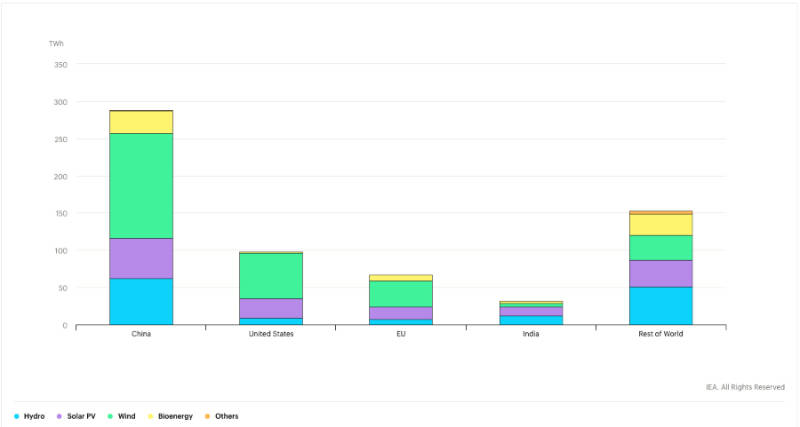
The share of renewable energy in electricity generation is expected to increase to almost 30 per cent in 2021, its highest share since the beginning of the Industrial Revolution and up from less than 27 per cent in 2019.
According to the IEA, long-term contracts, priority access to the grid, and continuous installation of new plants underpinned renewables growth despite lower electricity demand, supply chain challenges, and construction delays in many parts of the world.
Renewable energy demand is responsible for wind taking the lead, with capacity expected to grow almost 17 per cent.
Here’s how a basket of ASX stocks with exposure to oil, gas, uranium and coal are performing>>>
Scroll or swipe to reveal table. Click headings to sort. Best viewed on a laptop:
| CODE | COMPANY | Price | 1 MONTH RETURN % | 6 MONTH RETURN % | 1 YEAR RETURN % | 1 WEEK RETURN % | MARKET CAP |
|---|---|---|---|---|---|---|---|
| OXX | Octanex Ltd | 0.075 | 341 | 477 | 525 | 108 | $18,697,435.68 |
| LIO | Lion Energy Limited | 0.061 | 110 | 336 | 259 | 61 | $13,273,714.56 |
| LCK | Leigh Crk Energy Ltd | 0.225 | 36 | 137 | 137 | 36 | $141,889,181.28 |
| NAE | New Age Exploration | 0.025 | 85 | 67 | 1150 | 32 | $30,488,572.75 |
| TEG | Triangle Energy Ltd | 0.032 | 0 | 0 | 28 | 23 | $16,139,850.51 |
| 88E | 88 Energy Ltd | 0.026 | -16 | 333 | 333 | 18 | $251,321,808.62 |
| BAS | Bass Oil Ltd | 0.0035 | 17 | 133 | 250 | 17 | $11,697,490.34 |
| BLZ | Blaze International | 0.03 | 11 | -14 | 233 | 15 | $7,350,000.00 |
| PH2 | Pure Hydrogen Corp | 0.265 | 2 | 231 | 342 | 15 | $83,529,867.06 |
| STX | Strike Energy Ltd | 0.37 | 16 | 52 | 198 | 15 | $691,192,178.25 |
| GGX | Gas2Grid Limited | 0.0045 | 13 | 125 | 350 | 13 | $8,006,204.16 |
| ICN | Icon Energy Limited | 0.017 | 0 | -23 | 113 | 13 | $10,159,317.95 |
| PRM | Prominence Energy NL | 0.02 | 43 | 233 | 157 | 11 | $12,702,013.51 |
| WEL | Winchester Energy | 0.021 | -5 | -19 | 24 | 11 | $15,894,032.40 |
| EME | Energy Metals Ltd | 0.17 | -13 | 70 | 21 | 10 | $35,646,163.04 |
| OEX | Oilex Ltd | 0.0055 | 120 | 175 | 175 | 10 | $23,700,709.84 |
| ADD | Adavale Resource Ltd | 0.061 | 22 | 79 | 239 | 9 | $16,922,025.71 |
| AUH | Austchina Holdings | 0.013 | 9 | 200 | 500 | 9 | $19,609,492.33 |
| TOE | Toro Energy Limited | 0.024 | -11 | 33 | 200 | 9 | $67,938,870.14 |
| MCM | Mc Mining Ltd | 0.14 | 27 | 40 | -10 | 8 | $21,618,737.70 |
| GRV | Greenvale Mining Ltd | 0.23 | 28 | 360 | 1196 | 7 | $86,720,309.98 |
| MEY | Marenica Energy Ltd | 0.145 | 4 | 63 | 113 | 7 | $30,141,361.85 |
| GEV | Global Ene Ven Ltd | 0.105 | 9 | 15 | 75 | 6 | $47,472,413.42 |
| CRM | Carbon Minerals Ltd | 0.39 | 20 | -3 | 15 | 5 | $6,957,292.41 |
| DOR | Doriemus PLC | 0.065 | 5 | 44 | 117 | 5 | $3,594,953.75 |
| HCD | Hydrocarbon Dynamic | 0.022 | -4 | -24 | 47 | 5 | $9,686,382.33 |
| MAY | Melbana Energy Ltd | 0.022 | 0 | 69 | 529 | 5 | $48,653,879.65 |
| NGY | Nuenergy Gas Ltd | 0.044 | -4 | 267 | 300 | 5 | $65,162,041.87 |
| VEA | Viva Energy Group | 1.87 | 4 | 13 | 32 | 5 | $2,958,055,110.48 |
| BOE | Boss Energy Ltd | 0.14 | -10 | 126 | 126 | 4 | $318,958,682.84 |
| HE8 | Helios Energy Ltd | 0.14 | -18 | -10 | 57 | 4 | $230,223,318.64 |
| IKW | Ikwezi Mining Ltd | 0.28 | -10 | -44 | 180 | 4 | $11,381,992.72 |
| PEN | Peninsula Energy Ltd | 0.13 | 18 | 110 | -16 | 4 | $107,202,195.00 |
| SAN | Sagalio Energy Ltd | 0.026 | -21 | 86 | 1200 | 4 | $5,321,163.38 |
| WGO | Warrego Energy Ltd | 0.235 | 4 | 18 | 96 | 4 | $227,050,387.54 |
| AGE | Alligator Energy | 0.0155 | -3 | 210 | 288 | 3 | $32,989,855.25 |
| SGC | Sacgasco Ltd | 0.035 | -56 | -13 | 218 | 3 | $17,189,759.63 |
| TEK | Thorney Tech Ltd | 0.385 | 0 | 11 | 65 | 3 | $141,099,310.56 |
| JPR | Jupiter Energy | 0.047 | 2 | 12 | -69 | 2 | $7,208,751.57 |
| BKY | Berkeley Energia Ltd | 0.585 | -9 | 50 | 200 | 1 | $150,209,502.00 |
| PDN | Paladin Energy Ltd | 0.37 | -1 | 205 | 288 | 1 | $1,011,934,690.26 |
| 92E | 92Energy | 0.265 | 0 | $11,029,200.28 | |||
| ABL | Abilene Oil & Gas | 0.001 | 0 | 0 | 0 | 0 | $397,614.35 |
| AEE | Aura Energy | 0.0433 | 0 | 0 | 33 | 0 | $11,316,265.56 |
| AJQ | Armour Energy Ltd | 0.032 | 0 | -26 | -9 | 0 | $45,894,483.60 |
| BUY | Bounty Oil & Gas NL | 0.018 | -10 | 38 | 157 | 0 | $19,735,217.68 |
| CCJ | County International | 0.004 | 0 | 0 | 0 | 0 | $960,000.03 |
| CE1 | Calima Energy | 0.01 | 0 | 67 | 100 | 0 | $22,217,796.18 |
| DYL | Deep Yellow Limited | 0.625 | -6 | 89 | 140 | 0 | $203,226,259.38 |
| E2E | Eon Nrg Ltd | 0.001 | 0 | 0 | 0 | 0 | $769,888.93 |
| EER | East Energy Resource | 0.036 | 0 | 0 | 500 | 0 | $115,235,533.26 |
| EPM | Eclipse Metals | 0.019 | -17 | 138 | 217 | 0 | $33,439,180.44 |
| FAR | FAR Ltd | 0.011 | 0 | 0 | -21 | 0 | $109,767,132.17 |
| FDM | Freedom Oil Gas | 0.011 | 0 | 0 | 0 | 0 | $11,847,248.07 |
| GGE | Grand Gulf Energy | 0.013 | 8 | 63 | 333 | 0 | $4,604,993.74 |
| GLV | Global Oil & Gas | 0.023 | -21 | 77 | 128 | 0 | $17,563,878.82 |
| IEC | Intra Energy Corp | 0.009 | 29 | -10 | 80 | 0 | $3,579,516.27 |
| KLR | Kaili Resources Ltd | 0.026 | 0 | -35 | -28 | 0 | $3,832,409.44 |
| LKO | Lakes Blue Energy | 0.0015 | 0 | 0 | 0 | 0 | $50,687,113.44 |
| MEU | Marmota Limited | 0.044 | 5 | -8 | 26 | 0 | $42,615,482.36 |
| MHC | Manhattan Corp Ltd | 0.014 | -7 | -52 | 100 | 0 | $22,894,180.40 |
| MMR | Mec Resources | 0.004 | 0 | 0 | 0 | 0 | $2,737,819.70 |
| NSE | New Standard Energy | 0.004 | 0 | 0 | 0 | 0 | $3,554,995.46 |
| NZO | New Zealand Oil&Gas | 0.385 | -8 | -41 | -14 | 0 | $63,305,826.43 |
| OEL | Otto Energy Limited | 0.01 | 11 | 0 | 54 | 0 | $52,745,107.50 |
| PGY | Pilot Energy Ltd | 0.082 | 0 | 148 | 583 | 0 | $17,905,770.76 |
| PNL | Paringa Resources | 0.041 | 0 | 0 | 0 | 0 | $25,944,078.11 |
| PSA | Petsec Energy | 0.021 | 0 | 0 | 0 | 0 | $8,580,346.40 |
| RES | Resource Generation | 0.064 | 0 | 0 | 28 | 0 | $37,208,341.63 |
| REY | REY Resources Ltd | 0.27 | 4 | 17 | 26 | 0 | $57,220,435.53 |
| RMP | Red Emperor Resource | 0.017 | 0 | 13 | 113 | 0 | $8,929,977.19 |
| ROG | Red Sky Energy. | 0.01 | 150 | 500 | 1100 | 0 | $41,682,799.77 |
| STO | Santos Ltd | 7.02 | -2 | 37 | 62 | 0 | $14,456,478,324.54 |
| TDO | 3D Oil Limited | 0.06 | -2 | 3 | 0 | 0 | $15,911,302.32 |
| TNP | Triple Energy Ltd | 0.025 | 0 | 0 | 150 | 0 | $1,799,901.35 |
| VMY | Vimy Resources Ltd | 0.115 | -8 | 259 | 140 | 0 | $108,887,622.01 |
| GAS | State GAS Limited | 0.525 | -8 | -8 | 46 | -1 | $95,167,767.75 |
| ORG | Origin Energy | 4.07 | -14 | -4 | -18 | -1 | $7,256,189,612.52 |
| WPL | Woodside Petroleum | 23.06 | -6 | 28 | 14 | -1 | $22,017,800,395.10 |
| ALD | Ampol Limited | 25.31 | 1 | -2 | 11 | -2 | $6,026,660,083.71 |
| TER | Terracom Ltd | 0.095 | 10 | -37 | -5 | -2 | $72,346,332.48 |
| COI | Comet Ridge Limited | 0.065 | -4 | -19 | -24 | -3 | $48,263,914.86 |
| EEG | Empire Energy Ltd | 0.33 | -8 | -18 | 83 | -3 | $119,876,068.29 |
| GLL | Galilee Energy Ltd | 0.775 | 1 | 9 | 85 | -3 | $227,350,628.12 |
| HZN | Horizon Oil Limited | 0.087 | 4 | 58 | 78 | -3 | $111,032,773.62 |
| KAR | Karoon Energy Ltd | 1.16 | 9 | 37 | 125 | -3 | $639,461,618.57 |
| OSH | Oil Search Ltd | 3.8 | -10 | 35 | 46 | -3 | $7,729,604,470.08 |
| VMX | Valmec Limited | 0.29 | -8 | 45 | 81 | -3 | $36,506,132.35 |
| ZEL | Z Energy Ltd. | 2.39 | -10 | -14 | -20 | -3 | $1,249,144,447.20 |
| BMN | Bannerman Resources | 0.13 | -4 | 271 | 217 | -4 | $154,587,911.14 |
| BRK | Brookside Energy Ltd | 0.024 | 26 | 380 | 500 | -4 | $63,321,618.39 |
| BYE | Byron Energy Ltd | 0.13 | -7 | -24 | -4 | -4 | $135,238,363.26 |
| CTP | Central Petroleum | 0.12 | -4 | 4 | 58 | -4 | $86,891,239.32 |
| CUE | CUE Energy Resource | 0.064 | -3 | -64 | -22 | -4 | $45,377,781.80 |
| KKO | Kinetiko Energy Ltd | 0.125 | -11 | 52 | 525 | -4 | $73,521,338.13 |
| MEL | Metgasco Ltd | 0.024 | -8 | 18 | 46 | -4 | $13,741,235.60 |
| BPT | Beach Energy Limited | 1.68 | -6 | 31 | 26 | -5 | $3,787,013,868.96 |
| MRM | MMAOffShor | 0.315 | -2 | -19 | -34 | -5 | $107,798,470.80 |
| SXY | Senex Energy Limited | 3.09 | 10 | 29 | 93 | -5 | $572,569,735.92 |
| VEN | Vintage Energy | 0.058 | -13 | 0 | 52 | -5 | $33,291,821.59 |
| ANA | Ansila Energy | 0.0255 | 16 | -29 | 325 | -6 | $46,244,303.15 |
| FZR | Fitzroy River Corp | 0.15 | 15 | 13 | -12 | -6 | $17,272,680.16 |
| HPR | High Peak Royalties | 0.065 | 18 | 14 | 8 | -6 | $13,037,991.53 |
| MCE | Matrix C & E Ltd | 0.145 | 12 | -6 | -26 | -6 | $14,836,607.21 |
| WEC | White Energy Company | 0.099 | -18 | -18 | 22 | -6 | $75,898,914.46 |
| ACB | A-Cap Energy Ltd | 0.052 | -13 | 160 | 189 | -7 | $45,338,013.03 |
| CVN | Carnarvon Petroleum | 0.265 | 0 | 10 | 66 | -7 | $422,652,577.59 |
| LAM | Laramide Res Ltd | 0.56 | -13 | 60 | 124 | -7 | $666,632.40 |
| RNU | Renascor Res Ltd | 0.084 | -44 | 740 | 1100 | -7 | $149,983,837.03 |
| SMR | Stanmore Coal Ltd | 0.7 | -8 | -5 | -30 | -7 | $179,820,216.77 |
| CXU | Cauldron Energy Ltd | 0.037 | -5 | -5 | 54 | -8 | $16,723,981.94 |
| FPL | Fremont Petroleum | 0.0055 | 83 | 83 | 83 | -8 | $32,749,587.64 |
| NWE | Norwest Energy NL | 0.0055 | -8 | 38 | 83 | -8 | $30,440,660.46 |
| PVE | Po Valley Energy Ltd | 0.035 | 17 | 25 | -20 | -8 | $22,655,013.61 |
| TOU | Tlou Energy Ltd | 0.055 | -13 | -24 | -30 | -8 | $33,010,947.15 |
| TSC | Twenty Seven Co. Ltd | 0.0055 | 10 | -21 | -8 | -8 | $11,707,034.07 |
| XST | Xstate Resources | 0.0055 | -58 | 83 | 450 | -8 | $13,447,937.58 |
| YAL | Yancoal Aust Ltd | 2.08 | -9 | 5 | -1 | -8 | $2,772,922,817.70 |
| EDE | Eden Inv Ltd | 0.032 | -11 | 33 | -6 | -9 | $68,569,127.48 |
| ATS | Australis Oil & Gas | 0.044 | -17 | 69 | 52 | -10 | $55,106,327.85 |
| TMK | Tamaska Oil Gas Ltd | 0.009 | 0 | 50 | 50 | -10 | $8,460,000.00 |
| ZEU | Zeus Resources Ltd | 0.028 | -24 | 40 | 460 | -10 | $5,224,350.00 |
| AFR | African Energy Res | 0.016 | -6 | -20 | -20 | -11 | $9,967,370.08 |
| BNL | Blue Star Helium Ltd | 0.034 | 3 | -3 | 750 | -11 | $43,157,202.03 |
| BRU | Buru Energy | 0.195 | 26 | 107 | 135 | -11 | $84,254,477.00 |
| ERA | Energy Resources | 0.205 | -15 | 32 | 24 | -11 | $738,276,639.60 |
| IPB | IPB Petroleum Ltd | 0.034 | 3 | 17 | 143 | -11 | $9,753,065.51 |
| IVZ | Invictus Energy Ltd | 0.17 | 17 | 183 | 795 | -11 | $92,253,471.59 |
| NHC | New Hope Corporation | 1.14 | -17 | 5 | -20 | -11 | $978,019,571.35 |
| ENX | Enegex Limited | 0.11 | 55 | 64 | 2477 | -12 | $15,873,271.04 |
| KEY | KEY Petroleum | 0.0035 | -13 | -30 | 75 | -13 | $6,887,748.44 |
| WBE | Whitebark Energy | 0.0035 | -13 | 17 | -7 | -13 | $14,220,939.43 |
| ADX | ADX Energy Ltd | 0.009 | -18 | 80 | 80 | -14 | $25,417,614.72 |
| COE | Cooper Energy Ltd | 0.255 | -7 | -25 | -35 | -14 | $432,221,917.83 |
| POW | Protean Energy Ltd | 0.012 | 0 | 56 | 290 | -14 | $7,807,355.56 |
| DEV | Devex Resources Ltd | 0.26 | 16 | 27 | 163 | -16 | $80,556,344.40 |
| WHC | Whitehaven Coal | 1.23 | -30 | 24 | -30 | -16 | $1,290,805,290.00 |
| EXR | Elixir Energy Ltd | 0.375 | 7 | 200 | 1342 | -17 | $301,513,708.92 |
| PCL | Pancontinental Oil | 0.0025 | 25 | 150 | 150 | -17 | $12,013,430.97 |
| TPD | Talon Petroleum Ltd | 0.009 | 13 | 200 | 800 | -18 | $53,734,855.73 |
Small cap energy plays
Green hydrogen is the in thing at the moment, so when Lion announced that it was entering the space, its shares rocketed.
The company will raise $2.8 million to explore opportunities in green hydrogen in Australia as well as on Seram Island Indonesia where it currently has oil interests.
Triangle Energy (ASX:TEG) +23%
After months of uncertainty relating to alternatives for the processing of crude oil from its Cliff Head oil field in Western Australia, Triangle has reached an agreement to store crude at BP’s Kwinana Facility.
It has also reached a non-binding agreement with BP Singapore for an offtake agreement for its product.
Related Topics

Related Stories


UNLOCK INSIGHTS
Discover the untold stories of emerging ASX stocks.
Daily news and expert analysis, it's free to subscribe.
By proceeding, you confirm you understand that we handle personal information in accordance with our Privacy Policy.


