Never mind the macro for a minute. These three ‘bottom’ signals suggest Bitcoin’s a buy

"I can 100%, unequivocally tell you that this might be a bottom." (Getty Images)
Yep, Jerome Powell’s impending Jackson Hole speech will likely have a bearing on markets… but, for kicks, let’s take a quick look at three signs that Bitcoin could be bottoming out.
While the week began with a dump, the crypto market has since been looking flatter than the Nullarbor. Technical analysis, on the other hand, seems as volatile and confusing as ever, with various gloom-inducing and hopium-handing metrics competing for skittish crypto traders’ and investors’ attention.
Because it’s Friday, though, here are some of the currently positive-leaning metrics we’ve seen various crypto commentators pushing just lately.
And thanks to YouTuber Crypto Zombie – we’ve taken some inspiration from his latest video for this, in which he goes into a few more “historical bottom” indicators besides…
The 200-weekly moving average
This, according to Zombie, and plenty others (e.g. Crypto Rover as seen below and data analyst Benjamin Cowen) is the single-most significant metric for Bitcoin to determine bull-market strength or bear-market weakness.
You can buy #Bitcoin below the 200 Weekly Moving Average right now.
This is an insane opportunity that won't last forever. pic.twitter.com/VYRU0cUh8N
— Crypto Rover (@rovercrc) August 21, 2022
The orange coin has been trading around or a bit below it for about 10 weeks now, and, based on historical data, this has always proved to be the best time to buy BTC. You could consider dollar-cost averaging, perhaps.
Does that mean it can’t plunge lower? Nope, of course it could and very much might. But the zoom-out view on this looks pretty decent if you’re a long-term thinker with your investments.
“I think if you’re buying Bitcoin below the 200-week SMA [simple moving average], it’s hard to go wrong in a macro sense,” said Cowen in one of his videos today.
Bitcoin’s 200-week SMA is, by the way, very simply, the average price plotted over a 200-week period.
Weekly RSI
The weekly relative strength index (RSI) is a regular fixture in technical analysis, and one Zombie and others have been pointing to quite a bit just lately.
“The RSI has specific bullish crosses below a certain level,” noted Zombie, aka “K-Dub”, who explained it’s at roughly that stage right now for Bitcoin, which has only seen it this low three other times in its timeline – around Dec 05, 2011; Feb 16, 2015; Jan 28, 2019; and recently, around Jul 18 of this year.
The RSI is a momentum metric that measures speed and change of price movements and prescribes a value for that between zero and 100. The bullish crosses Zombie mentions have all occurred below 40, including the latest.
Take that for what you will.
https://twitter.com/AirdropHassan/status/1562920453991170048
Puell Multiple
Here’s another one, then. The Puell Multiple, which was created by on-chain Bitcoin analyst David Puell in 2019.
The data gurus at on-chain market intelligence outfit Glassnode refer to this one a bit, and you can see some of its history in the chart below.
They describe it like this: “The Puell Multiple is calculated by dividing the daily issuance value of bitcoins (in USD) by the 365-day moving average of daily issuance value,” which they go into greater detail and context with here.
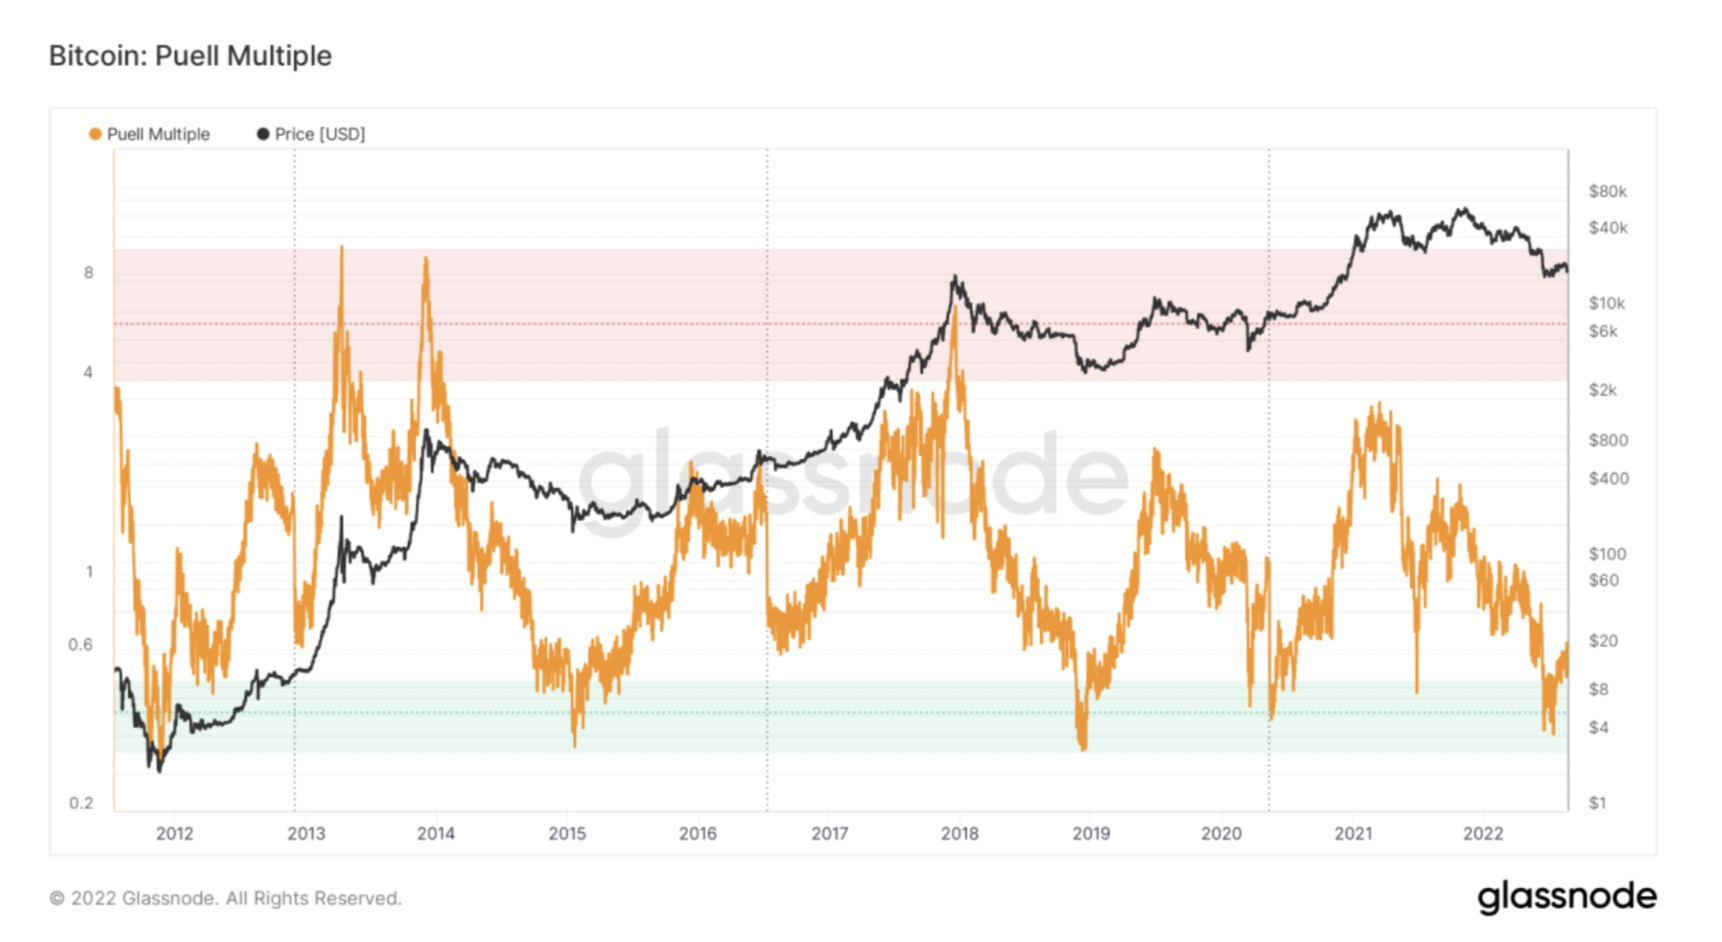
As Zombie points out, when it’s come down to the bottom or close to the bottom of that green zone, it’s represented a stupendously good time to buy BTC for those who can project their investments a bit further than a day, week, or month or two.
“When the Puell Multiple falls below 0.4 and then moves back above it on the break… it’s always signalled amazing opportunities for buying,” noted the YouTuber.
After a more balanced look at Bitcoin’s latest bull/bear metrics? Check out Mooners and Shakers – where things occasionally moon, and more often just lately, shake out.
Oh and it no doubt goes without saying, but let’s say it anyway… absolutely none of the info imparted in this article should be taken as financial advice.
Related Topics
Related Stories


UNLOCK INSIGHTS
Discover the untold stories of emerging ASX stocks.
Daily news and expert analysis, it's free to subscribe.
By proceeding, you confirm you understand that we handle personal information in accordance with our Privacy Policy.


