Gold Digger: Gold hovers around $US1,770/oz ahead of JPow’s JHole speech

Pic: Stockhead, Getty Images
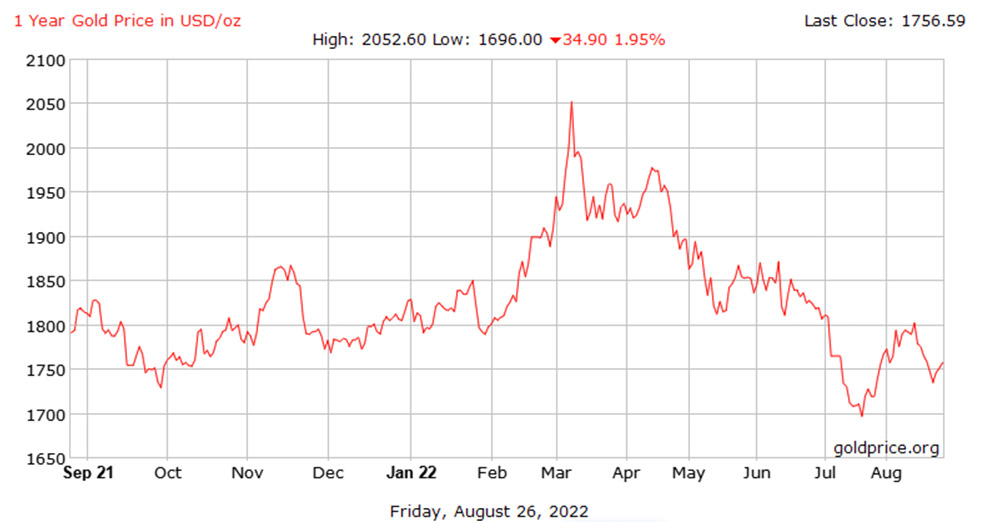
- Gold got a small boost to ~$US1,770/oz ahead of Fed Chair Powell’s speech at Jackson Hole
- Top gold stocks this week: Besra Gold (ASX:BEZ), Alderan resources (ASX:AL8)
Our Gold Digger column wraps all the news driving ASX stocks with exposure to precious metals.
Gold hovers around $US1,7770/oz, awaits JPow’s Jhole speech
Gold got a small boost this week to ~$US1,770/oz as the US dollar softened ahead of Fed Chair Powell’s speech at Jackson Hole, which could give guidance on future interest rate hikes.
Higher interest rates increase the opportunity cost of holding gold, which is non-yielding, while boosting the dollar.
“Another round of US economic data and Fed speak supported the idea that the Fed will remain aggressive tightening policy until inflation is under control,” OANDA’s Edward Moya says.
“Investors want to see if Fed Chair Powell locks the Fed in for another massive 75 basis point rate increase in September, but he will likely stick to the data-dependency script and leave it up to the September 13th inflation report.”
Gold will likely consolidate between the $US1750 to $US1780 zone leading up to Fed Chair Powell’s speech, Moya says, due at 1400 GMT today.
Winners & Losers
Here’s how ASX-listed precious metals stocks are performing:
Scroll or swipe to reveal table. Click headings to sort. Best viewed on a laptop.
Stocks missing from this list? Email [email protected]
| CODE | COMPANY | 1 WEEK RETURN % | 1 MONTH RETURN % | 6 MONTH RETURN % | 1 YEAR RETURN % | PRICE | MARKET CAP |
|---|---|---|---|---|---|---|---|
| WCN | White Cliff Min | 76% | 76% | -8% | 100% | 0.022 | $13,072,067.24 |
| MCT | Metalicity Limited | 67% | 67% | -26% | -42% | 0.005 | $17,293,530.03 |
| AM7 | Arcadia Minerals | 64% | 84% | 44% | 48% | 0.295 | $15,410,304.36 |
| NWM | Norwest Minerals | 43% | 94% | 22% | -6% | 0.066 | $11,920,087.54 |
| CY5 | Cygnus Gold Limited | 33% | 97% | 69% | 144% | 0.305 | $38,268,181.90 |
| RDT | Red Dirt Metals | 27% | 80% | 14% | 276% | 0.62 | $164,459,390.04 |
| RGL | Riversgold | 25% | 61% | 99% | 42% | 0.045 | $26,989,755.87 |
| BEZ | Besragoldinc | 25% | 8% | -53% | 0% | 0.04 | $6,186,598.56 |
| AL8 | Alderan Resource | 22% | -15% | -50% | -79% | 0.011 | $5,315,660.80 |
| GTR | Gti Energy | 20% | 29% | 0% | 8% | 0.018 | $27,098,704.42 |
| RML | Resolution Minerals | 20% | 14% | -37% | -48% | 0.012 | $10,580,954.30 |
| GMN | Gold Mountain | 20% | -14% | -33% | -73% | 0.006 | $8,352,044.19 |
| CDR | Codrus Minerals | 19% | 15% | -29% | -41% | 0.092 | $3,960,000.00 |
| OKR | Okapi Resources | 19% | 22% | -19% | -48% | 0.22 | $29,906,546.56 |
| GMR | Golden Rim Resources | 19% | -6% | -49% | -58% | 0.051 | $16,009,583.20 |
| DTM | Dart Mining NL | 18% | 45% | -10% | -14% | 0.09 | $10,550,292.48 |
| ENR | Encounter Resources | 17% | 36% | 21% | 11% | 0.17 | $53,926,860.42 |
| NAE | New Age Exploration | 17% | -13% | -46% | -42% | 0.007 | $9,333,342.92 |
| GMLDA | Gateway Mining | 17% | 17% | -13% | -34% | 0.105 | $21,471,041.30 |
| SBR | Sabre Resources | 17% | 75% | 56% | 75% | 0.007 | $19,528,117.06 |
| MEK | Meeka Metals Limited | 16% | 67% | 67% | 107% | 0.085 | $96,318,246.12 |
| ALY | Alchemy Resource | 16% | 38% | 69% | 73% | 0.022 | $21,920,703.31 |
| PKO | Peako Limited | 15% | 35% | 44% | -18% | 0.023 | $6,169,082.02 |
| PNX | PNX Metals Limited | 14% | 0% | -27% | -48% | 0.004 | $17,776,231.23 |
| BBX | BBX Minerals | 14% | 1% | -38% | -64% | 0.08 | $38,881,718.00 |
| ICG | Inca Minerals | 14% | -14% | -42% | -54% | 0.057 | $23,612,842.21 |
| VRC | Volt Resources | 14% | 21% | 46% | -32% | 0.0205 | $63,092,611.76 |
| TLM | Talisman Mining | 14% | 14% | -3% | 0% | 0.165 | $30,038,319.52 |
| M2R | Miramar | 14% | 14% | -26% | -40% | 0.125 | $7,702,399.56 |
| GSM | Golden State Mining | 13% | 29% | -20% | -50% | 0.063 | $7,371,894.85 |
| DRE | Dreadnought Resources | 12% | 75% | 176% | 150% | 0.105 | $304,103,355.10 |
| SKY | SKY Metals | 12% | 34% | -26% | -26% | 0.067 | $25,244,492.49 |
| HCH | Hot Chili | 11% | 29% | -35% | -57% | 0.88 | $96,153,390.83 |
| AVM | Advance Metals | 11% | -9% | -41% | -23% | 0.01 | $4,778,774.02 |
| ASR | Asra Minerals | 11% | -13% | -20% | -17% | 0.02 | $29,285,230.68 |
| MHC | Manhattan Corp | 11% | 11% | -29% | -9% | 0.01 | $15,262,786.93 |
| RDN | Raiden Resources | 11% | 25% | -33% | -52% | 0.01 | $14,845,518.70 |
| THR | Thor Mining PLC | 11% | -9% | -23% | -29% | 0.01 | $11,293,426.10 |
| CAZ | Cazaly Resources | 11% | 17% | 2% | -14% | 0.042 | $14,832,871.72 |
| LCY | Legacy Iron Ore | 11% | 11% | 17% | 50% | 0.021 | $128,136,523.98 |
| PNM | Pacific Nickel Mines | 11% | 14% | -12% | 68% | 0.084 | $20,888,240.91 |
| AAR | Astral Resources NL | 10% | 6% | -19% | 10% | 0.085 | $47,694,339.12 |
| GED | Golden Deeps | 10% | 32% | 65% | 50% | 0.0165 | $19,638,854.14 |
| DCX | Discovex Res | 10% | 10% | -42% | 15% | 0.0055 | $18,164,124.54 |
| CDT | Castle Minerals | 10% | 22% | -30% | 154% | 0.033 | $31,983,775.49 |
| XAM | Xanadu Mines | 10% | 43% | 14% | 18% | 0.033 | $46,604,587.10 |
| TG1 | Techgen Metals | 10% | 31% | 70% | 3% | 0.17 | $7,294,388.64 |
| MRR | Minrex Resources | 10% | 58% | 2% | 280% | 0.057 | $61,124,788.07 |
| CPM | Coopermetalslimited | 9% | 10% | -5% | 0% | 0.53 | $17,979,809.04 |
| LEX | Lefroy Exploration | 9% | 2% | -11% | -28% | 0.295 | $42,303,653.72 |
| MTH | Mithril Resources | 9% | 0% | -54% | -65% | 0.006 | $17,641,398.25 |
| NXM | Nexus Minerals | 9% | 11% | -28% | 85% | 0.25 | $74,122,260.41 |
| GSN | Great Southern | 9% | 4% | -24% | -28% | 0.038 | $21,148,111.39 |
| GCY | Gascoyne Res | 8% | 48% | 38% | 20% | 0.385 | $168,283,925.33 |
| GCY | Gascoyne Res | 8% | 48% | 38% | 20% | 0.385 | $168,283,925.33 |
| ZNC | Zenith Minerals | 8% | 0% | 2% | 55% | 0.325 | $112,047,740.68 |
| LM8 | Lunnonmetalslimited | 8% | 14% | 18% | 51% | 0.935 | $101,086,036.84 |
| IGO | IGO Limited | 8% | 30% | 19% | 36% | 13.01 | $9,624,873,903.23 |
| A8G | Australasian Metals | 7% | 28% | -34% | 84% | 0.295 | $12,145,295.73 |
| FG1 | Flynngold | 7% | 5% | -36% | -30% | 0.105 | $6,726,410.25 |
| BRB | Breaker Res NL | 7% | 13% | -4% | 13% | 0.225 | $78,201,822.96 |
| MRZ | Mont Royal Resources | 7% | -5% | -5% | 13% | 0.305 | $20,445,965.06 |
| PRX | Prodigy Gold NL | 7% | 14% | -33% | -61% | 0.016 | $9,322,041.70 |
| PNT | Panthermetals | 7% | 2% | 0% | 0% | 0.24 | $7,250,000.00 |
| MEU | Marmota Limited | 6% | -6% | 14% | 22% | 0.05 | $52,778,197.26 |
| WWI | West Wits Mining | 6% | -5% | -56% | -67% | 0.019 | $38,190,715.77 |
| GSR | Greenstone Resources | 5% | 63% | 129% | 255% | 0.078 | $77,733,572.99 |
| RSG | Resolute Mining | 5% | 7% | 23% | -36% | 0.295 | $331,265,810.70 |
| BTR | Brightstar Resources | 5% | 0% | -26% | -31% | 0.02 | $12,937,217.38 |
| PDI | Predictive Disc | 5% | -2% | 0% | 56% | 0.21 | $367,142,575.49 |
| NVA | Nova Minerals | 5% | 16% | -5% | -22% | 0.86 | $149,567,896.55 |
| GRL | Godolphin Resources | 5% | -23% | -26% | -43% | 0.089 | $8,966,505.97 |
| REZ | Resourc & En Grp | 5% | -12% | -48% | -28% | 0.023 | $9,996,115.78 |
| OZM | Ozaurum Resources | 5% | -8% | -8% | -15% | 0.115 | $8,017,340.00 |
| AAJ | Aruma Resources | 4% | 17% | -11% | -1% | 0.072 | $10,673,382.20 |
| MI6 | Minerals260Limited | 4% | 30% | -17% | 0% | 0.365 | $75,900,000.00 |
| CST | Castile Resources | 4% | -22% | -29% | -44% | 0.125 | $29,579,149.75 |
| LRL | Labyrinth Resources | 4% | 9% | -43% | -39% | 0.025 | $20,960,802.12 |
| PRS | Prospech Limited | 4% | 8% | -43% | -70% | 0.028 | $1,825,068.14 |
| MKR | Manuka Resources. | 3% | -3% | -55% | -50% | 0.15 | $45,763,260.96 |
| LYN | Lycaonresources | 3% | 20% | -14% | 0% | 0.3 | $9,575,625.00 |
| POL | Polymetals Resources | 3% | 67% | 20% | 7% | 0.15 | $5,971,490.34 |
| KCC | Kincora Copper | 3% | -3% | -62% | -68% | 0.062 | $4,562,215.38 |
| GBZ | GBM Rsources | 3% | 11% | -48% | -41% | 0.062 | $33,276,833.10 |
| ADT | Adriatic Metals | 3% | 24% | 4% | -18% | 2.21 | $463,326,085.35 |
| PGO | Pacgold | 3% | -20% | -37% | 108% | 0.48 | $25,557,243.98 |
| CAI | Calidus Resources | 3% | 5% | -10% | 31% | 0.655 | $288,935,925.30 |
| G88 | Golden Mile Res | 3% | 18% | -37% | -40% | 0.033 | $6,723,176.26 |
| GWR | GWR Group | 2% | -15% | -43% | -60% | 0.085 | $28,909,498.95 |
| IVR | Investigator Res | 2% | 5% | -30% | -32% | 0.044 | $58,621,800.91 |
| SNG | Siren Gold | 2% | -10% | -15% | -21% | 0.22 | $22,924,402.16 |
| WRM | White Rock Min | 2% | -8% | -54% | -71% | 0.092 | $17,264,899.54 |
| WAF | West African Res | 2% | 14% | 26% | 29% | 1.3375 | $1,403,915,896.63 |
| KTA | Krakatoa Resources | 2% | 19% | 52% | 21% | 0.064 | $22,061,434.69 |
| TIE | Tietto Minerals | 1% | 8% | -5% | 70% | 0.5175 | $529,771,707.15 |
| BRV | Big River Gold | 1% | 6% | 42% | 16% | 0.355 | $88,245,456.25 |
| BC8 | Black Cat Syndicate | 1% | 14% | -38% | -33% | 0.36 | $80,112,815.63 |
| NAG | Nagambie Resources | 1% | 7% | 49% | -3% | 0.073 | $37,459,669.53 |
| HAV | Havilah Resources | 1% | 54% | 111% | 90% | 0.37 | $117,156,507.70 |
| PNR | Pantoro Limited | 1% | -1% | -40% | -4% | 0.1875 | $307,353,043.92 |
| RRL | Regis Resources | 1% | 1% | -13% | -36% | 1.62 | $1,253,262,464.08 |
| PRU | Perseus Mining | 1% | -3% | -5% | 13% | 1.645 | $2,273,041,686.33 |
| TBR | Tribune Res | 1% | -4% | -20% | -32% | 3.75 | $204,625,500.30 |
| EMR | Emerald Res NL | 0% | 23% | 2% | 41% | 1.16 | $691,428,645.20 |
| CHN | Chalice Mining | 0% | 2% | -40% | -31% | 4.44 | $1,715,915,204.64 |
| SFR | Sandfire Resources | 0% | 17% | -30% | -19% | 4.915 | $2,004,811,456.77 |
| NPM | Newpeak Metals | 0% | 0% | 0% | 0% | 0.001 | $8,853,750.03 |
| ASO | Aston Minerals | 0% | -13% | -33% | -22% | 0.094 | $110,239,562.47 |
| FFX | Firefinch | 0% | 0% | -11% | 0% | 0.2 | $236,248,644.20 |
| AQX | Alice Queen | 0% | -14% | -63% | -77% | 0.003 | $6,461,083.37 |
| AMI | Aurelia Metals | 0% | 2% | -39% | -20% | 0.275 | $346,375,807.96 |
| GIB | Gibb River Diamonds | 0% | 36% | 2% | -20% | 0.06 | $12,479,057.26 |
| TMX | Terrain Minerals | 0% | -13% | -13% | -13% | 0.007 | $5,325,327.06 |
| YRL | Yandal Resources | 0% | 6% | -45% | -67% | 0.165 | $19,155,106.25 |
| FAU | First Au | 0% | -26% | -30% | -42% | 0.007 | $6,519,876.64 |
| MOH | Moho Resources | 0% | 8% | -48% | -57% | 0.026 | $4,319,373.86 |
| PUA | Peak Minerals | 0% | 5% | -9% | -41% | 0.01 | $10,413,707.51 |
| CWX | Carawine Resources | 0% | 9% | -51% | -51% | 0.105 | $14,472,606.44 |
| KAL | Kalgoorliegoldmining | 0% | -13% | -16% | 0% | 0.13 | $9,416,498.00 |
| MEI | Meteoric Resources | 0% | 0% | -14% | -65% | 0.012 | $18,315,568.45 |
| AME | Alto Metals Limited | 0% | 15% | -3% | -12% | 0.075 | $40,090,313.40 |
| TRY | Troy Resources | 0% | 0% | 0% | -5% | 0.0295 | $50,138,963.94 |
| KGM | Kalnorth Gold | 0% | 0% | 0% | 0% | 0.013 | $11,625,120.78 |
| CGN | Crater Gold Min | 0% | 0% | 0% | 0% | 0.017 | $21,063,473.65 |
| LNY | Laneway Res | 0% | 0% | -13% | 30% | 0.005 | $32,690,082.05 |
| ADV | Ardiden | 0% | 14% | -38% | -43% | 0.008 | $21,346,682.85 |
| VMC | Venus Metals Cor | 0% | -3% | -8% | -3% | 0.165 | $28,013,769.53 |
| LCL | Los Cerros Limited | 0% | 3% | -67% | -76% | 0.035 | $22,122,061.07 |
| DDD | 3D Resources Limited | 0% | 0% | -33% | -50% | 0.002 | $8,863,744.18 |
| RMX | Red Mount Min | 0% | 17% | -13% | -22% | 0.007 | $11,496,547.01 |
| TTM | Titan Minerals | 0% | 2% | -49% | -49% | 0.056 | $81,792,790.91 |
| EM2 | Eagle Mountain | 0% | 7% | -60% | -71% | 0.225 | $63,042,289.81 |
| BYH | Bryah Resources | 0% | -7% | -40% | -45% | 0.028 | $7,679,470.54 |
| SVL | Silver Mines Limited | 0% | 9% | -19% | -17% | 0.175 | $226,070,625.03 |
| ICL | Iceni Gold | 0% | 5% | -9% | -53% | 0.1 | $12,819,642.80 |
| PF1 | Pathfinder Resources | 0% | 0% | 16% | 75% | 0.5 | $26,560,505.00 |
| CLA | Celsius Resource | 0% | -18% | -42% | -42% | 0.014 | $19,426,784.56 |
| SFM | Santa Fe Minerals | 0% | -5% | -61% | -1% | 0.081 | $5,898,321.91 |
| SI6 | SI6 Metals Limited | 0% | 14% | -11% | -33% | 0.008 | $10,417,323.55 |
| BGD | Bartongoldholdings | 0% | -13% | -31% | -8% | 0.17 | $12,893,883.45 |
| AUT | Auteco Minerals | 0% | 12% | -41% | -47% | 0.047 | $90,961,295.39 |
| CBY | Canterbury Resources | 0% | 0% | -42% | -60% | 0.044 | $5,420,735.32 |
| TAM | Tanami Gold NL | 0% | -4% | -22% | -38% | 0.046 | $51,704,270.02 |
| WMC | Wiluna Mining Corp | 0% | 0% | -76% | -77% | 0.205 | $74,238,030.68 |
| ALK | Alkane Resources | 0% | 3% | -21% | -23% | 0.745 | $461,577,150.50 |
| OKU | Oklo Resources | 0% | 7% | 65% | 26% | 0.145 | $74,413,230.65 |
| RDS | Redstone Resources | 0% | 0% | -10% | -18% | 0.009 | $6,631,491.56 |
| KAI | Kairos Minerals | 0% | 7% | 26% | 0% | 0.029 | $54,994,617.75 |
| CXU | Cauldron Energy | 0% | 25% | -50% | -68% | 0.01 | $5,354,112.77 |
| VAN | Vango Mining | 0% | -15% | -3% | -37% | 0.039 | $47,877,630.02 |
| AVW | Avira Resources | 0% | 43% | 0% | 25% | 0.005 | $10,593,950.00 |
| S2R | S2 Resources | 0% | 3% | -19% | 15% | 0.15 | $51,674,353.98 |
| NES | Nelson Resources. | 0% | 8% | -39% | -63% | 0.014 | $4,120,160.30 |
| PUR | Pursuit Minerals | 0% | -6% | -24% | -75% | 0.016 | $15,396,137.51 |
| OAU | Ora Gold Limited | 0% | -9% | -47% | -41% | 0.01 | $9,842,312.83 |
| GNM | Great Northern | 0% | 11% | -17% | -50% | 0.005 | $8,545,254.88 |
| TRM | Truscott Mining Corp | 0% | -20% | 25% | 21% | 0.04 | $5,683,339.58 |
| DLC | Delecta Limited | 0% | 0% | 0% | 120% | 0.0275 | $13,253,984.40 |
| AYM | Australia United Min | 0% | 20% | 0% | -33% | 0.006 | $11,055,464.91 |
| OGC | OceanaGold Corp. | 0% | -12% | -6% | -5% | 2.28 | $164,525,229.18 |
| FEG | Far East Gold | 0% | 35% | 0% | 0% | 0.46 | $56,137,116.60 |
| BGL | Bellevue Gold | 0% | 14% | -10% | -14% | 0.8275 | $862,436,235.38 |
| RND | Rand Mining | 0% | 4% | -4% | 3% | 1.495 | $82,470,143.45 |
| TUL | Tulla Resources | 0% | -7% | -15% | 10% | 0.5175 | $83,312,773.44 |
| ARL | Ardea Resources | -1% | -14% | 38% | 114% | 0.96 | $162,948,261.12 |
| ERM | Emmerson Resources | -1% | -3% | -14% | 42% | 0.095 | $51,747,429.86 |
| GOR | Gold Road Res | -1% | 9% | -9% | 5% | 1.325 | $1,450,682,542.35 |
| NST | Northern Star | -1% | 5% | -23% | -21% | 7.66 | $8,971,471,909.40 |
| CYL | Catalyst Metals | -2% | 3% | -31% | -32% | 1.3 | $123,070,185.00 |
| TCG | Turaco Gold Limited | -2% | 7% | -39% | -47% | 0.064 | $26,518,433.48 |
| NCM | Newcrest Mining | -2% | -5% | -26% | -27% | 18.37 | $16,880,029,368.30 |
| GUL | Gullewa Limited | -2% | 2% | -17% | -31% | 0.06 | $11,454,186.00 |
| SMI | Santana Minerals | -2% | 26% | 97% | 785% | 0.885 | $126,769,186.32 |
| AAU | Antilles Gold | -2% | -16% | -42% | -37% | 0.049 | $20,587,264.05 |
| AGG | AngloGold Ashanti | -2% | 3% | -30% | -7% | 4.31 | $391,622,088.35 |
| EVN | Evolution Mining | -2% | 3% | -40% | -37% | 2.51 | $4,695,983,040.00 |
| HAW | Hawthorn Resources | -2% | -1% | -8% | 89% | 0.083 | $27,681,795.88 |
| MM8 | Medallion Metals. | -3% | 5% | -18% | -14% | 0.185 | $20,394,924.14 |
| CMM | Capricorn Metals | -3% | 9% | 4% | 73% | 3.805 | $1,439,350,465.95 |
| SSR | SSR Mining Inc. | -3% | -10% | -23% | -6% | 21.045 | $390,223,005.50 |
| KAU | Kaiser Reef | -3% | -13% | -15% | -28% | 0.17 | $22,072,921.38 |
| SAU | Southern Gold | -3% | 3% | -39% | -49% | 0.034 | $7,253,177.70 |
| BNZ | Benzmining | -3% | 35% | -15% | -33% | 0.5 | $26,598,099.52 |
| IDA | Indiana Resources | -3% | 11% | -2% | 9% | 0.062 | $29,747,898.78 |
| SLR | Silver Lake Resource | -3% | 0% | -25% | 1% | 1.355 | $1,281,987,550.25 |
| BNR | Bulletin Res | -3% | 21% | 16% | 202% | 0.145 | $40,962,754.00 |
| MVL | Marvel Gold Limited | -3% | 12% | -41% | -43% | 0.029 | $20,425,261.73 |
| A1G | African Gold . | -3% | -7% | -61% | -46% | 0.087 | $9,911,057.22 |
| KRM | Kingsrose Mining | -3% | 12% | -21% | 26% | 0.058 | $42,141,485.06 |
| KCN | Kingsgate Consolid. | -4% | 12% | 31% | 136% | 1.62 | $365,178,747.45 |
| MGV | Musgrave Minerals | -4% | 10% | -8% | -11% | 0.27 | $145,036,696.23 |
| GMD | Genesis Minerals | -4% | -4% | -23% | 64% | 1.205 | $346,645,167.41 |
| RVR | Red River Resources | -4% | 0% | -40% | -21% | 0.13 | $68,696,544.66 |
| CEL | Challenger Exp | -4% | -3% | -42% | -31% | 0.19 | $200,404,148.10 |
| MAU | Magnetic Resources | -4% | 0% | -30% | -37% | 1 | $225,310,444.00 |
| TMZ | Thomson Res | -4% | 9% | -58% | -76% | 0.025 | $19,626,672.80 |
| MZZ | Matador Mining | -4% | -4% | -57% | -70% | 0.12 | $35,254,563.75 |
| HRZ | Horizon | -4% | 0% | -40% | -31% | 0.072 | $45,762,717.70 |
| BMO | Bastion Minerals | -4% | -15% | -32% | -32% | 0.115 | $8,731,864.90 |
| SBM | St Barbara Limited | -4% | 4% | -26% | -40% | 0.9475 | $795,341,398.80 |
| KSN | Kingston Resources | -4% | -9% | -45% | -49% | 0.086 | $34,311,919.88 |
| MAT | Matsa Resources | -4% | -4% | -31% | -22% | 0.043 | $15,435,048.66 |
| KWR | Kingwest Resources | -5% | -6% | -62% | -2% | 0.062 | $18,312,243.17 |
| HRN | Horizon Gold | -5% | 4% | -3% | 46% | 0.41 | $50,719,065.99 |
| DCN | Dacian Gold | -5% | 2% | -55% | -59% | 0.1 | $120,898,750.40 |
| BMR | Ballymore Resources | -5% | -5% | 19% | 0% | 0.19 | $13,960,835.39 |
| MLS | Metals Australia | -5% | 10% | 39% | 43% | 0.057 | $35,815,135.27 |
| XTC | Xantippe Res | -5% | 19% | 19% | 533% | 0.0095 | $73,131,611.92 |
| DEG | De Grey Mining | -5% | 20% | -14% | -20% | 0.95 | $1,403,614,466.97 |
| CHZ | Chesser Resources | -5% | -2% | -13% | -46% | 0.087 | $51,166,710.57 |
| RED | Red 5 Limited | -5% | 6% | -17% | 37% | 0.26 | $648,112,503.50 |
| IPT | Impact Minerals | -6% | 6% | -20% | -27% | 0.0085 | $19,850,964.45 |
| HXG | Hexagon Energy | -6% | 0% | -64% | -77% | 0.017 | $7,693,738.52 |
| RXL | Rox Resources | -6% | -2% | -41% | -32% | 0.25 | $43,924,646.22 |
| AUC | Ausgold Limited | -6% | 22% | 11% | 22% | 0.05 | $101,473,727.05 |
| STK | Strickland Metals | -6% | -19% | -18% | 32% | 0.05 | $67,219,366.55 |
| RXL | Rox Resources | -6% | -2% | -41% | -32% | 0.25 | $43,924,646.22 |
| MKG | Mako Gold | -6% | -11% | -29% | -23% | 0.066 | $26,374,670.54 |
| SVY | Stavely Minerals | -6% | 6% | -59% | -59% | 0.165 | $53,287,518.24 |
| RMS | Ramelius Resources | -6% | -11% | -39% | -41% | 0.905 | $797,994,300.28 |
| E2M | E2 Metals | -6% | 3% | -28% | -43% | 0.155 | $28,874,186.84 |
| GAL | Galileo Mining | -6% | -11% | 429% | 224% | 1.005 | $197,408,260.00 |
| NMR | Native Mineral Res | -6% | -30% | -55% | -45% | 0.1125 | $5,978,690.38 |
| SRN | Surefire Rescs NL | -6% | -17% | 25% | 7% | 0.015 | $23,720,452.16 |
| KZR | Kalamazoo Resources | -6% | 5% | -24% | -38% | 0.225 | $31,942,762.28 |
| TSO | Tesoro Gold | -6% | -6% | -47% | -65% | 0.0365 | $31,578,788.82 |
| KIN | KIN Min NL | -6% | -6% | -23% | -36% | 0.073 | $63,227,778.13 |
| QML | Qmines Limited | -6% | -19% | -43% | -56% | 0.145 | $11,592,992.88 |
| AGC | AGC | -7% | -3% | -25% | -42% | 0.07 | $4,808,637.16 |
| GBR | Greatbould Resources | -7% | 28% | -25% | 22% | 0.105 | $44,401,578.17 |
| AWV | Anova Metals | -7% | 8% | -35% | -50% | 0.013 | $19,475,224.60 |
| EMU | EMU NL | -7% | 18% | -13% | -55% | 0.013 | $7,147,588.29 |
| ANX | Anax Metals | -7% | -1% | -13% | -15% | 0.075 | $31,233,368.32 |
| SPQ | Superior Resources | -8% | 56% | 56% | 408% | 0.061 | $105,475,665.92 |
| NML | Navarre Minerals | -8% | -4% | -49% | -44% | 0.048 | $70,456,078.30 |
| AWJ | Auric Mining | -8% | 4% | -15% | -36% | 0.083 | $5,045,266.05 |
| X64 | Ten Sixty Four | -8% | -3% | -27% | -28% | 0.58 | $136,773,780.60 |
| KNB | Koonenberrygold | -8% | 0% | -33% | 0% | 0.08 | $5,980,727.04 |
| OBM | Ora Banda Mining | -8% | 24% | 16% | -36% | 0.057 | $82,439,238.18 |
| G50 | Gold50Limited | -8% | 10% | -27% | -34% | 0.165 | $9,242,970.17 |
| SMS | Starmineralslimited | -9% | -1% | -54% | 0% | 0.085 | $2,514,300.00 |
| AZS | Azure Minerals | -9% | -9% | -42% | -41% | 0.21 | $62,147,144.20 |
| PGD | Peregrine Gold | -9% | 71% | 50% | 90% | 0.76 | $30,009,205.90 |
| M24 | Mamba Exploration | -9% | 5% | -49% | -51% | 0.091 | $4,217,500.30 |
| ARN | Aldoro Resources | -9% | 53% | -36% | -43% | 0.245 | $23,900,956.08 |
| MTC | Metalstech | -11% | -14% | 48% | 56% | 0.295 | $50,832,699.95 |
| BCN | Beacon Minerals | -11% | -17% | -32% | -26% | 0.025 | $92,925,857.53 |
| FML | Focus Minerals | -11% | -11% | -55% | -49% | 0.125 | $35,819,830.63 |
| SLZ | Sultan Resources | -11% | 26% | -20% | -29% | 0.12 | $9,994,126.68 |
| STN | Saturn Metals | -11% | -5% | -32% | -35% | 0.275 | $35,722,273.68 |
| AQI | Alicanto Min | -12% | -12% | -46% | -62% | 0.051 | $19,569,394.47 |
| DEX | Duke Exploration | -12% | -7% | -57% | -76% | 0.065 | $5,593,091.42 |
| VKA | Viking Mines | -13% | 0% | -42% | -71% | 0.007 | $8,202,067.45 |
| MXR | Maximus Resources | -13% | 2% | -27% | -38% | 0.047 | $14,988,571.10 |
| MEG | Megado Minerals | -13% | 28% | 32% | 0% | 0.1 | $10,904,879.80 |
| ZAG | Zuleika Gold | -13% | -9% | -41% | -31% | 0.02 | $10,431,012.50 |
| MDI | Middle Island Res | -14% | -31% | -43% | -31% | 0.069 | $8,569,275.54 |
| HMX | Hammer Metals | -14% | -30% | -18% | -32% | 0.055 | $47,563,436.85 |
| CTO | Citigold Corp | -14% | 0% | -40% | -45% | 0.006 | $19,835,613.64 |
| TSC | Twenty Seven Co. | -14% | 0% | -25% | -14% | 0.003 | $7,982,441.72 |
| AXE | Archer Materials | -15% | 6% | -23% | -58% | 0.76 | $188,835,077.32 |
| ARV | Artemis Resources | -15% | 31% | -53% | -48% | 0.034 | $47,203,253.46 |
| TBA | Tombola Gold | -16% | -3% | 11% | -43% | 0.031 | $30,567,989.57 |
| BAT | Battery Minerals | -17% | -17% | -44% | -58% | 0.005 | $14,626,211.73 |
| NSM | Northstaw | -18% | -15% | -49% | -55% | 0.14 | $5,617,780.00 |
| WGX | Westgold Resources. | -18% | -20% | -56% | -42% | 0.9875 | $551,770,480.45 |
| TAR | Taruga Minerals | -19% | 8% | -28% | -49% | 0.026 | $16,763,398.96 |
| SIH | Sihayo Gold Limited | -20% | -20% | -67% | -80% | 0.002 | $12,204,256.18 |
| MBK | Metal Bank | -20% | -11% | -33% | -58% | 0.004 | $10,431,272.64 |
| DTR | Dateline Resources | -23% | 8% | 11% | 1% | 0.092 | $47,094,380.40 |
| HMG | Hamelingoldlimited | -25% | 15% | -12% | 0% | 0.15 | $16,500,000.00 |
| ADN | Andromeda Metals | -29% | -24% | -60% | -59% | 0.068 | $289,230,784.18 |
| ANL | Amani Gold | -33% | 0% | -50% | 0% | 0.001 | $23,693,441.13 |
Weekly Small Cap Standouts
It’s amazing how rapidly sentiment can change.
Two years ago, gold was hot and you couldn’t give a lithium project away. Now it’s quite the opposite.
Nearly every junior exploration stock in our top 10 this week – White Cliff, Metalicity, Arcadia, Cygnus, Red Dirt, and Riversgold – have dumped precious metals for lithium.
Good on them. Makes writing this column a bit harder, but.
Still, there are those gold stocks receiving some love from investors, starting with …
Can you believe BEZ’s 3.3Moz ‘Bau’ gold project in Malaysia also includes an additional 4.9Moz – 9.3Moz exploration target? The stock is capped at just $6m.
Eight holes have now been successfully completed at the ‘Jugan’ prospect, with assay results including thick hits like 64m at 1.9g/t and 67m at 1.8g/t from about 140m depth.
Drilling then moved to the 644,000oz ‘Bekajang’ prospect to grow the resource. That drilling has already uncovered two new deeper gold targets.
Assay results are pending.
AL8 has just completed a 22-hole drilling program at the Mizpah oxide gold deposit in Utah, US.
The company is verifying historical holes at Mizpah, which was drilled in the 1980’s but never developed into a mining operation.
There are multiple historical (1984-89) shallow high-grade intersections including 10.7m at 2.2g/t gold from surface.
Mizpah is 2km from the historical Drum gold mine which produced 125,000oz at 1.2g/t gold (1984-89) in the same rock units.
Promising stuff.
Mizpah gold assays are expected early in Q4, the company says.
Related Topics

Related Stories


UNLOCK INSIGHTS
Discover the untold stories of emerging ASX stocks.
Daily news and expert analysis, it's free to subscribe.
By proceeding, you confirm you understand that we handle personal information in accordance with our Privacy Policy.


