Today’s lesson from history: BTD
News
Even the most cursory glance at historical Bear v Bull Market data can grant not just insight, but offer some measure of calm and relief. Despite how grim things might seem as we depart the Barcelona bullrings to go visit Goldilocks, it’s by no means the end of the world as we know it.
Markets are cyclical. Corrections, when a market falls 10% from its recent highs, and bear markets, when equity markets are down 20% or more from their recent highs, are a normal part of the investing cycle.
While it may feel like the grizzlies are out right now, there’s more than likely a recovery on the horizon. For the record, technically the ASX is in correction but Goldilocks hasn’t quite entered the bears’ house yet – some sectors are faring better than others.
One of the biggest clichés in markets is stocks take the escalator up, and an elevator down. But the cliché is pretty on the money when you look back at markets throughout history.
Your portfolio can keep gaining slowly over time until there’s a moment when it feels like you gave up all of your gains plus maybe some more as the market takes a swift ride from top to bottom.
Research has shown the average bull market lasts more than nine years, whereas the average bear market lasts just one year.
Vanguard Asia-Pacific Chief Investment Officer Duncan Burns said their analysis of the equity market over the last 50 odd years shows that that there have been five bear markets in that time; in other words, an average of one bear market every decade. Average recovery time over the last five decades is 4.5 years.
“Take for example, the three worst equity selloffs in the last 50 years – the inflation crisis of the 1970s, the recession in the late 1980s and the global financial crisis in the late 2000s,” Burns said.
“The data tells us that it took nearly nine years for investors to break even from the 1970 inflation crisis but only 4-6 years to recover from the next two bear markets.”
| Year | Drawdown | Recovery time (years) | Preceding 10 year return | 10 year return from peak | 20 year return from peak |
| 1970 | -61.9% | 8.6 | 12.9% | 4.2% | 10.8% |
| 1987 | -41.3% | 4.0 | 27.4% | 6.4% | 10.9% |
| 2007 | -50.9% | 5.9 | 15.2% | 3% | 3.9% |
Note: 10-year and 20-year returns are annualised returns. Data provided by Vanguard
There are key differences between today and 1970s where there is now a stronger presence of the inflation targeting regime. In other words, the intervention of central banks globally in targeting inflation means that the chances of inflation coming down eventually are higher, rather than inflation persisting.
Morgans chief economist Michael Knox told Stockhead the 1970s was a period of stagflation (inflation combined with slow economic growth and unemployment) predominantly caused by money flowing out of the US into other currencies.
“In the 1970s Robert Heller was the chief of research at the International Monetary Fund and he wrote a paper which showed the reason for inflation of the 1970s was very rapid flow out of US dollars into other currencies, particularly in 1974,” Knox said.
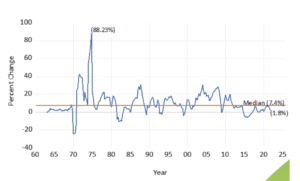
“What he showed was the rate of growth of international reserves as the US dollar is flowing out into other countries generated an increase in total international reserves in 1974 of 88%.
“That then went into the money supplies of all the countries and in turn generated worldwide inflation of the 1970s.”
Knox said the most recent data we have for international reserves based on the same measure Heller invented back in the 1970s is only 2% for the past year.
“What we are actually seeing is a flood of money into the US dollar which is the strongest in 20 years,” he said.

Knox said data on 90-day bill and 10-year bonds in the US are positive enough that a recession is unlikely. As recession fears subside confidence should further return to markets.
Stockspot investment manager Marc Jocum said since 1900, the Australian share market (as measured by the ASX All Ordinaries Accumulation Index) has risen in 80% of years. This means 20% of the time, the Australian market has fallen.
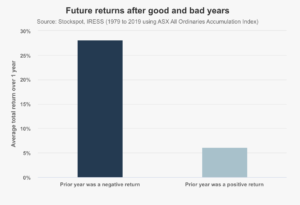
“When the share market has fallen in a calendar year, the return in the next calendar year has averaged 28% which is much better than the typical one year returns,” he said.
“In other words strong bounces back are common.”

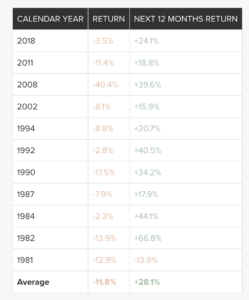
Since 1979, the ASX has experienced 11 years of negative returns, averaging -11.8%. In 10 of those 11 occurrences the next 12 months were positive for equity markets, with the exception being 1981 which had two consecutive years of negative returns.
“However, the next year in 1983 the share market was up an incredible 67%,” Jocum said.

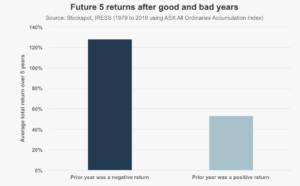
When the share market has fallen during one calendar year, Jocum said the next five years on average have delivered a total return of 128% which equates to 18% per annum.
“That’s over double the five year return after positive years,” he said.
“What makes this year a bit unique is that bonds, which are seen as defensive assets and normally rise when share markets fall, have also seen losses due to rising inflation and higher interest rates.”

Stockspot founder and CEO Chris Brycki told Stockhead every bear market is different with some short and sharp, like 2020, and others lasting for many years, like the mid 1970s.
He said acting on emotion, selling or sitting on the sidelines after a market fall is therefore likely to harm your long-term performance. Knowing when to be in or out by timing the market is extremely difficult.
“Our advice to clients is to avoid the temptation to try to pick the bottom. Instead, focus on holding an appropriate asset allocation that can withstand different environments, and simply sit tight and do nothing,” Brycki said.
“Over the long term, the investment markets have always rewarded disciplined investors with diversified portfolios who keep on investing when others are selling.”