Gold Digger: This is why a strengthening silver price could be bad for gold
Pic: Bloomberg Creative / Bloomberg Creative Photos via Getty Images
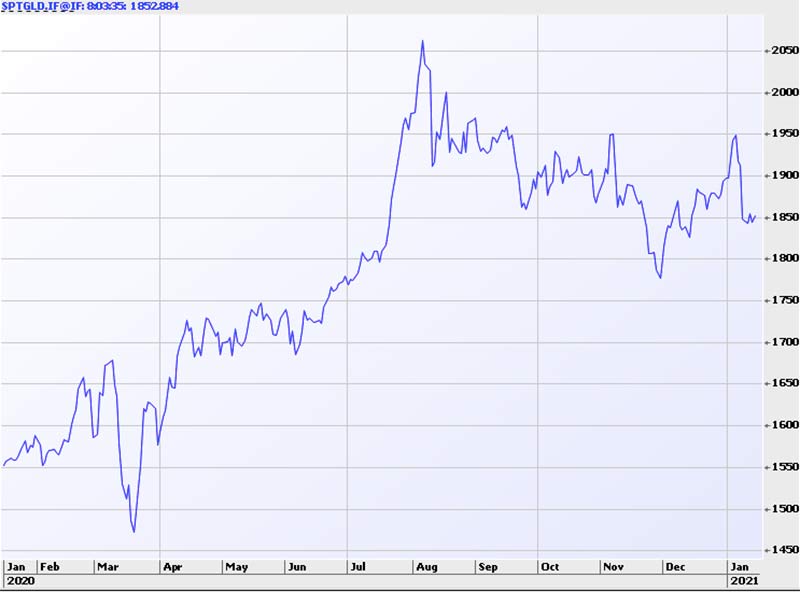
Where’s the gold price going in 2021? No one knows, but there’s a swarm of guesses to choose from.
There was the forecast that gold prices would surge in January (which hasn’t happened, yet).
Metals Focus reckons the yellow metal will hit all-time highs of $US2,300/oz later this year.
US-based natural resource investors Goehring & Rozencwajg is more circumspect. It predicts we are due a small ‘price correction’ in precious metals, a small blip in a larger bull market.
A correction is often referred to as a relatively short term fall of more than 10 per cent (but less than 20 per cent), from a most recent peak.
But why? Goehring & Rozencwajg say a strange thing happens when silver surges relative to the gold price: they both fall right after.
This is a pattern that has played out multiple times over the last half-century.
In gold bull markets over the last 50 years, silver has shown a strong tendency to lag the advancing gold price for many years before catching up suddenly in a “spasm of speculative activity”, Goehring & Rozencwajg say.
Like right now.
After bottoming at $12 per ounce in March, silver has staged an impressive catch-up rally over the last six months, up ~33 per cent to gold’s ~3 per cent.
“We are extremely bullish on gold and do not believe we are repeating the 1979 and 2010 experience [when precious metals prices spent a decade in purgatory],” Goehring & Rozencwajg say.
“However, given silver’s huge move in the last six months, gold and precious metals could now go through a potential correction phase within a larger bull market.”
Which is the good news. A student of history knows that real gold bull markets are of substantial duration, legendary gold investor Rick Rule told Stockhead late last year.
They typically last upwards of eight years, and by his reckoning we’re into this one for around 20 months.
Goehring & Rozencwajg say investors should play the long game.
“We recommend investors use any such corrective phase to build up significant positions in both physical gold and silver and related equities.”
Winners & Losers
Here’s how ASX-listed gold stocks performed January 11 – January 15 [intraday].
Scroll or swipe to reveal table. Click headings to sort. Best viewed on a laptop:
| CODE | COMPANY | 1 WEEK CHANGE % | 1 MONTH CHANGE % | 6 MONTH CHANGE % | 1 YEAR CHANGE % | PRICE | MARKET CAP |
|---|---|---|---|---|---|---|---|
| HXG | Hexagon Energy | 94 | 100 | 131 | 100 | 0.12 | $ 31,626,559.34 |
| HWK | Hawkstone Mining | 43 | 50 | -6 | 88 | 0.015 | $ 19,650,456.05 |
| FNT | Frontier Resources | 27 | 46 | 73 | 90 | 0.019 | $ 9,290,000.00 |
| GNM | Great Northern Minerals | 15 | -12 | -21 | 67 | 0.015 | $ 11,802,954.85 |
| PAK | Pacific American Holdings | 13 | 24 | 189 | -5 | 0.026 | $ 7,550,037.60 |
| E2M | E2 Metals | 12 | -11 | 253 | 216 | 0.6 | $ 89,795,043.60 |
| PNM | Pacific Nickel Mines | 12 | -3 | 107 | -44 | 0.056 | $ 8,537,151.52 |
| CXU | Cauldron Energy | 11 | 29 | 133 | 113 | 0.049 | $ 21,055,977.06 |
| CBY | Canterbury Resources | 10 | 0 | -19 | -50 | 0.11 | $ 9,681,649.45 |
| FFX | Firefinch | 10 | 57 | 63 | 165 | 0.22 | $ 172,019,595.22 |
| MAU | Magnetic Resources | 9 | 9 | -9 | 158 | 1.29 | $ 276,699,362.56 |
| DRE | Dreadnought Resources | 9 | 14 | 85 | 243 | 0.024 | $ 49,760,643.70 |
| GMR | Golden Rim Resources | 9 | 20 | -14 | 20 | 0.012 | $ 24,248,274.57 |
| MKG | Mako Gold | 9 | -8 | 4 | 74 | 0.12 | $ 30,868,992.24 |
| REZ | Resources & Energy Group | 8 | 10 | 179 | 194 | 0.053 | $ 24,605,804.97 |
| ARN | Aldoro Resources | 8 | 38 | 108 | 8 | 0.2 | $ 13,276,160.60 |
| RDS | Redstone Resources | 7 | 36 | 50 | 67 | 0.015 | $ 7,941,235.95 |
| TSO | Tesoro Resources | 7 | 11 | 253 | 638 | 0.3 | $ 153,850,064.76 |
| MBK | Metal Bank | 7 | 25 | 57 | 74 | 0.015 | $ 17,770,000.00 |
| ARL | Ardea Resources | 7 | 14 | 50 | -16 | 0.48 | $ 62,558,585.18 |
| LEX | Lefroy Exploration | 5 | 8 | -2 | 14 | 0.21 | $ 25,202,030.07 |
| EMU | EMU NL | 5 | 13 | 125 | 10 | 0.045 | $ 16,038,244.62 |
| AUT | Auteco Minerals | 5 | 16 | -34 | 1178 | 0.115 | $ 180,225,577.64 |
| BRV | Big River Gold | 4 | -4 | 50 | 182 | 0.048 | $ 69,686,171.88 |
| CEL | Challenger Exploration | 4 | 14 | 9 | 92 | 0.25 | $ 132,582,522.96 |
| PNR | Pantoro | 4 | 9 | 16 | 79 | 0.25 | $ 359,141,548.14 |
| MGV | Musgrave Minerals | 4 | 4 | -25 | 348 | 0.385 | $ 190,543,406.45 |
| NXM | Nexus Minerals | 4 | 0 | 94 | 183 | 0.13 | $ 31,739,717.23 |
| BNR | Bulletin Resources | 4 | 1 | 11 | 282 | 0.084 | $ 14,164,152.85 |
| MHC | Manhattan Corp | 4 | 0 | 12 | 367 | 0.028 | $ 37,135,803.40 |
| AWV | Anova Metals | 4 | 7 | 0 | 230 | 0.029 | $ 41,559,731.80 |
| WCN | White Cliff Minerals | 4 | -3 | 142 | 480 | 0.029 | $ 14,479,775.77 |
| SI6 | SI6 Metals | 3 | 36 | 386 | 1033 | 0.034 | $ 46,540,907.00 |
| DTM | Dart Mining | 3 | 6 | 12 | 146 | 0.19 | $ 18,489,913.06 |
| VAN | Vango Mining | 3 | 3 | -40 | -54 | 0.076 | $ 78,352,569.36 |
| SKY | SKY Metals | 3 | 8 | -9 | 95 | 0.195 | $ 48,096,716.46 |
| TIE | Tietto Minerals | 2 | -3 | -36 | 60 | 0.415 | $ 185,857,286.96 |
| GWR | GWR Group | 2 | 37 | 514 | 438 | 0.43 | $ 126,719,238.24 |
| NAG | Nagambie Resources | 2 | 7 | -13 | 28 | 0.046 | $ 22,996,887.92 |
| OKR | Okapi Resources | 2 | 17 | 32 | 147 | 0.245 | $ 10,792,818.00 |
| AXE | Archer Materials | 2 | 7 | 31 | 255 | 0.55 | $ 126,076,465.76 |
| AMG | Ausmex Mining | 2 | 28 | 97 | -14 | 0.059 | $ 31,211,393.67 |
| GTR | GTI Resources | 2 | 27 | 22 | 205 | 0.0305 | $ 18,046,503.94 |
| GIB | Gibb River Diamonds | 1 | -54 | 86 | 64 | 0.082 | $ 17,555,283.94 |
| NSM | North Stawell Mines | 1 | -5 | 0 | 0 | 0.435 | $ 17,400,000.00 |
| BC8 | Black Cat Syndicate | 1 | 14 | -15 | 140 | 0.755 | $ 79,994,808.58 |
| DDD | 3D Resources | 0 | 13 | 13 | 350 | 0.0045 | $ 14,461,488.37 |
| AQI | Alicanto Minerals | 0 | 4 | 97 | 167 | 0.12 | $ 39,230,095.32 |
| ANX | Anax Metals | 0 | -8 | 106 | 332 | 0.048 | $ 12,329,082.74 |
| ADV | Ardiden | 0 | 24 | 17 | 425 | 0.021 | $ 47,147,361.45 |
| AAJ | Aruma Resources | 0 | 0 | 75 | 133 | 0.007 | $ 9,536,483.42 |
| AYM | Australia United | 0 | -11 | 167 | 100 | 0.008 | $ 14,740,619.88 |
| BCN | Beacon Minerals | 0 | -5 | -3 | 6 | 0.037 | $ 106,080,432.90 |
| CDT | Castle Minerals | 0 | 11 | -23 | 11 | 0.01 | $ 6,592,507.36 |
| CTO | Citigold | 0 | 8 | 180 | 211 | 0.014 | $ 38,089,424.93 |
| CGN | Crater Gold | 0 | -3 | 111 | 58 | 0.019 | $ 23,322,421.47 |
| CY5 | Cygnus Gold | 0 | 0 | -5 | 227 | 0.18 | $ 19,452,617.64 |
| DAU | Dampier Gold | 0 | -7 | 73 | 167 | 0.052 | $ 16,418,028.72 |
| GML | Gateway Mining | 0 | 10 | 83 | 106 | 0.033 | $ 62,905,954.19 |
| GMN | Gold Mountain | 0 | 0 | -25 | -39 | 0.043 | $ 31,981,784.23 |
| GED | Golden Deeps | 0 | -14 | 33 | -52 | 0.012 | $ 9,295,360.14 |
| HAW | Hawthorn Resources | 0 | 21 | 4 | 84 | 0.11 | $ 36,686,717.43 |
| KAU | Kaiser Reef | 0 | 0 | 15 | 0 | 0.41 | $ 10,957,250.41 |
| KGM | Kalnorth Gold | 0 | 0 | 30 | 160 | 0.013 | $ 11,625,120.78 |
| LNY | Laneway Resources | 0 | 0 | -13 | 0 | 0.007 | $ 26,425,461.53 |
| MSR | Manas Resources | 0 | 17 | 17 | 180 | 0.007 | $ 17,941,778.39 |
| MCT | Metalicity | 0 | 0 | -14 | 419 | 0.018 | $ 31,358,125.91 |
| MLS | Metals Australia | 0 | 0 | 0 | 100 | 0.002 | $ 8,381,807.15 |
| MOH | Moho Resources | 0 | -3 | -31 | 100 | 0.09 | $ 8,431,485.21 |
| NPM | Newpeak Metals | 0 | 17 | 75 | 17 | 0.0035 | $ 14,004,487.53 |
| NUS | Nusantara Resources | 0 | -5 | -7 | -16 | 0.28 | $ 64,196,441.96 |
| PUA | Peak Minerals | 0 | -13 | 27 | 135 | 0.028 | $ 15,982,210.30 |
| PUR | Pursuit Minerals | 0 | 55 | 508 | 630 | 0.034 | $ 22,067,208.69 |
| SBR | Sabre Resources | 0 | 22 | 267 | 450 | 0.011 | $ 18,513,700.14 |
| SPQ | Superior Resources | 0 | -13 | 100 | 149 | 0.014 | $ 16,524,882.70 |
| TLM | Talisman Mining | 0 | 8 | -25 | 5 | 0.105 | $ 19,595,980.43 |
| TMX | Terrain Minerals | 0 | -15 | 22 | 175 | 0.011 | $ 8,093,371.10 |
| THR | Thor Mining | 0 | 0 | 183 | 113 | 0.017 | $ 7,370,808.66 |
| TTM | Titan Minerals | 0 | -4 | 0 | -32 | 0.115 | $ 131,037,029.91 |
| TRM | Truscott Mining | 0 | 0 | -5 | 125 | 0.018 | $ 2,302,947.79 |
| TSC | Twenty Seven Co. | 0 | 0 | 20 | -25 | 0.006 | $ 12,717,925.28 |
| VKA | Viking Mines | 0 | 42 | 408 | 291 | 0.044 | $ 18,885,814.91 |
| VRC | Volt Resources | 0 | 0 | -40 | 0 | 0.012 | $ 23,791,109.11 |
| CDV | Cardinal Resources | 0 | -1 | 81 | 210 | 1.07 | $ 593,155,151.63 |
| OBM | Ora Banda Mining | -1 | 18 | 18 | 80 | 0.33 | $ 273,722,136.03 |
| AOP | Apollo Consolidated | -2 | 7 | -11 | 23 | 0.32 | $ 86,110,588.80 |
| HRN | Horizon Gold | -2 | 9 | -1 | 159 | 0.51 | $ 44,777,360.97 |
| AME | Alto Metals | -2 | 11 | 31 | 151 | 0.098 | $ 39,033,887.46 |
| DGO | DGO Gold | -2 | -2 | -2 | 218 | 2.89 | $ 213,300,069.20 |
| STK | Strickland Metals | -2 | -22 | 54 | 187 | 0.043 | $ 18,530,666.92 |
| CYL | Catalyst Metals | -2 | -16 | -21 | -26 | 2.14 | $ 195,898,498.38 |
| KRM | Kingsrose Mining | -2 | 20 | -7 | 35 | 0.042 | $ 30,660,308.78 |
| FML | Focus Minerals | -3 | 18 | 39 | 47 | 0.39 | $ 70,358,197.53 |
| S2R | S2 Resources | -3 | 37 | 32 | 48 | 0.185 | $ 58,254,868.12 |
| KWR | Kingwest Resources | -3 | 13 | 32 | 9 | 0.18 | $ 27,664,894.44 |
| SMI | Santana Minerals | -3 | -3 | 25 | -38 | 0.175 | $ 19,955,711.30 |
| WMX | Wiluna Mining | -3 | -11 | 5 | 24 | 1.36 | $ 162,388,108.82 |
| TBR | Tribune Resources | -3 | 1 | -14 | 11 | 6.03 | $ 316,382,504.31 |
| ONX | Orminex | -3 | 29 | -14 | -61 | 0.031 | $ 17,251,269.38 |
| TRY | Troy Resources | -3 | 2 | -2 | -6 | 0.091 | $ 69,695,866.66 |
| AQX | Alice Queen | -3 | 11 | -3 | 20 | 0.03 | $ 32,746,907.07 |
| FFR | Firefly Resources | -3 | -6 | 134 | 234 | 0.15 | $ 41,970,534.48 |
| RDN | Raiden Resources | -3 | -3 | 329 | 329 | 0.03 | $ 25,619,795.43 |
| BDC | Bardoc Gold | -3 | 19 | -12 | 2 | 0.088 | $ 150,610,691.71 |
| AAR | Anglo Australian | -3 | 7 | 12 | 46 | 0.145 | $ 85,406,215.68 |
| ADN | Andromeda Metals | -3 | 6 | 520 | 579 | 0.285 | $ 624,291,069.83 |
| RGL | Riversgold | -4 | 34 | -18 | 511 | 0.055 | $ 20,578,877.33 |
| A1G | African Gold | -4 | 20 | 86 | 70 | 0.27 | $ 11,326,362.08 |
| RRL | Regis Resources | -4 | -1 | -32 | -15 | 3.71 | $ 1,904,740,733.88 |
| TAR | Taruga Minerals | -4 | 24 | 42 | 264 | 0.051 | $ 22,860,075.30 |
| NCM | Newcrest Mining | -4 | -1 | -18 | -13 | 26.53 | $ 21,785,728,327.12 |
| GSM | Golden State Mining | -4 | 4 | -40 | 218 | 0.1875 | $ 10,477,697.00 |
| KSN | Kingston Resources | -4 | -9 | 19 | 47 | 0.25 | $ 71,113,814.42 |
| STN | Saturn Metals | -4 | -5 | -8 | 56 | 0.615 | $ 68,332,641.30 |
| AL8 | Alderan Resources | -4 | 25 | 14 | 400 | 0.12 | $ 35,752,931.04 |
| CWX | Carawine Resources | -4 | -4 | 33 | 9 | 0.24 | $ 25,589,126.97 |
| TMZ | Thomson Resources | -4 | 14 | 300 | 386 | 0.12 | $ 37,798,595.28 |
| AUC | Ausgold | -4 | 5 | 18 | 229 | 0.046 | $ 61,116,428.43 |
| OAU | Ora Gold | -4 | 0 | 44 | 15 | 0.023 | $ 18,498,594.88 |
| SVY | Stavely Minerals | -4 | -9 | 15 | -11 | 0.79 | $ 204,854,739.82 |
| CAZ | Cazaly Resources | -4 | -15 | 22 | 100 | 0.044 | $ 15,870,503.75 |
| CHZ | Chesser Resources | -4 | 10 | 120 | 193 | 0.22 | $ 96,656,653.88 |
| NWM | Norwest Minerals | -4 | -9 | -45 | -48 | 0.086 | $ 9,360,255.39 |
| RED | Red 5 Limited | -4 | 9 | 19 | -20 | 0.27 | $ 541,999,798.18 |
| BAT | Battery Minerals | -5 | 5 | 110 | 200 | 0.021 | $ 44,908,017.90 |
| HRZ | Horizon | -5 | 0 | -19 | 9 | 0.105 | $ 59,637,396.00 |
| PRS | Prospech Limited | -5 | -7 | 0 | 0 | 0.205 | $ 13,329,220.75 |
| MAT | Matsa Resources | -5 | -17 | -33 | -23 | 0.1 | $ 27,114,670.90 |
| MEG | Megado | -5 | -2 | 0 | 0 | 0.2 | $ 8,004,469.80 |
| FAU | First Au | -5 | 6 | 12 | 90 | 0.019 | $ 9,147,438.81 |
| SIH | Sihayo Gold | -5 | -14 | -30 | 51 | 0.019 | $ 70,023,766.85 |
| ODY | Odyssey Gold | -5 | -5 | -5 | -5 | 0.074 | $ 22,600,000.00 |
| ERM | Emmerson Resources | -5 | -1 | -26 | -36 | 0.074 | $ 36,214,040.55 |
| MEI | Meteoric Resources | -5 | 17 | 106 | 106 | 0.074 | $ 93,279,199.27 |
| SAR | Saracen | -5 | 5 | -23 | 34 | 4.74 | $ 5,338,852,346.30 |
| RND | Rand Mining | -5 | -5 | -14 | -23 | 1.8 | $ 108,267,255.00 |
| KZR | Kalamazoo Resources | -5 | 17 | -10 | 80 | 0.62 | $ 79,219,567.57 |
| NST | Northern Star | -5 | 3 | -13 | 9 | 12.6 | $ 9,513,954,301.32 |
| KTA | Krakatoa Resources | -5 | -1 | -21 | 94 | 0.07 | $ 19,526,500.00 |
| WWI | West Wits Mining | -5 | 27 | 218 | 536 | 0.07 | $ 86,758,902.20 |
| ALY | Alchemy Resources | -6 | 0 | -17 | 58 | 0.017 | $ 11,428,138.70 |
| BRB | Breaker Resources | -6 | 9 | -17 | -30 | 0.2075 | $ 65,168,185.80 |
| ENR | Encounter Resources | -6 | -8 | 10 | 27 | 0.165 | $ 50,490,192.48 |
| EMR | Emerald Resources | -6 | 21 | 41 | 95 | 0.82 | $ 435,510,639.92 |
| NVA | Nova Minerals | -6 | -3 | 181 | 240 | 0.16 | $ 267,191,463.52 |
| SVL | Silver Mines | -6 | 14 | 118 | 142 | 0.24 | $ 238,805,394.06 |
| CAI | Calidus Resources | -6 | -10 | -17 | 83 | 0.475 | $ 156,319,084.88 |
| GRL | Godolphin Resources | -6 | -8 | 21 | 12 | 0.235 | $ 18,919,395.23 |
| PDI | Predictive Discovery | -6 | 5 | -28 | 565 | 0.059 | $ 57,970,247.27 |
| SFM | Santa Fe Minerals | -6 | -6 | 26 | 26 | 0.088 | $ 6,408,053.43 |
| MML | Medusa Mining | -7 | -3 | 7 | -12 | 0.75 | $ 158,962,640.27 |
| BYH | Bryah Resources | -7 | 4 | 31 | 45 | 0.071 | $ 11,054,916.58 |
| BBX | BBX Minerals | -7 | -7 | 60 | 107 | 0.28 | $ 120,249,040.52 |
| GBZ | GBM Rsources | -7 | 4 | 73 | 371 | 0.14 | $ 57,457,438.16 |
| ARV | Artemis Resources | -7 | 0 | 69 | 400 | 0.135 | $ 153,463,182.80 |
| AGG | AngloGold Ashanti | -7 | 1 | -32 | -1 | 5.87 | $ 528,109,968.80 |
| MTC | Metalstech | -7 | -7 | 34 | 400 | 0.195 | $ 28,580,689.41 |
| NAE | New Age Exploration | -7 | 8 | 63 | 333 | 0.013 | $ 15,431,395.33 |
| RML | Resolution Minerals | -7 | 3 | -51 | -22 | 0.038 | $ 10,996,925.86 |
| AZS | Azure Minerals | -7 | -34 | 300 | 257 | 0.5 | $ 155,583,289.11 |
| DCN | Dacian Gold | -8 | 41 | 52 | -44 | 0.485 | $ 261,559,020.38 |
| DEG | De Grey Mining | -8 | -4 | 39 | 1895 | 1 | $ 1,284,807,136.31 |
| HMX | Hammer Metals | -8 | -3 | -14 | 64 | 0.036 | $ 26,967,124.51 |
| LCL | Los Cerros | -8 | 20 | 150 | 114 | 0.12 | $ 56,253,542.64 |
| MVL | Marvel Gold | -8 | -8 | 98 | -55 | 0.048 | $ 24,923,558.84 |
| CHN | Chalice Mining | -8 | 6 | 261 | 1520 | 4.13 | $ 1,469,535,039.45 |
| MEU | Marmota | -8 | 4 | -22 | 68 | 0.047 | $ 48,426,684.50 |
| CMM | Capricorn Metals | -8 | 1 | -9 | 35 | 1.66 | $ 570,998,179.62 |
| RVR | Red River Resources | -8 | 12 | 213 | 90 | 0.285 | $ 147,565,694.60 |
| KAI | Kairos Minerals | -8 | -8 | 10 | 305 | 0.034 | $ 56,972,620.78 |
| MKR | Manuka Resources | -8 | -10 | 49 | 0 | 0.38 | $ 35,135,705.16 |
| SBM | St Barbara | -9 | -10 | -37 | -18 | 2.23 | $ 1,580,002,175.36 |
| YRL | Yandal Resources | -9 | -1 | 65 | 78 | 0.42 | $ 39,942,932.63 |
| KCN | Kingsgate Consolidated | -9 | 15 | 116 | 111 | 0.94 | $ 212,652,383.60 |
| EVN | Evolution Mining | -9 | -4 | -23 | 27 | 4.61 | $ 7,962,388,616.10 |
| OKU | Oklo Resources | -9 | -11 | -35 | 21 | 0.205 | $ 103,326,111.46 |
| SNG | Siren Gold | -9 | -18 | 0 | 0 | 0.66 | $ 40,890,859.23 |
| SSR | SSR Mining | -9 | -4 | 0 | 0 | 23.35 | $ 416,139,815.40 |
| TAM | Tanami Gold | -9 | 17 | 38 | 120 | 0.088 | $ 103,408,540.05 |
| BGL | Bellevue Gold | -9 | -24 | -3 | 106 | 1.02 | $ 880,989,384.56 |
| MDI | Middle Island Resources | -9 | 26 | -33 | 270 | 0.34 | $ 42,431,798.15 |
| WGX | Westgold Resources | -9 | -13 | 12 | 7 | 2.41 | $ 1,029,968,306.10 |
| AMI | Aurelia Metals | -9 | 6 | -16 | 2 | 0.43 | $ 530,760,405.75 |
| TNR | Torian Resources | -10 | -3 | 56 | 265 | 0.028 | $ 21,598,911.80 |
| CLA | Celsius Resources | -10 | 20 | 139 | 244 | 0.055 | $ 43,692,212.54 |
| GBR | Great Boulder Resources | -10 | -6 | 14 | 23 | 0.045 | $ 8,650,749.42 |
| BAR | Barra Resources | -10 | 4 | 37 | 24 | 0.026 | $ 17,617,810.63 |
| MZZ | Matador Mining | -10 | 19 | -15 | 50 | 0.345 | $ 57,925,378.06 |
| M2R | Miramar | -10 | -12 | 0 | 0 | 0.3 | $ 12,879,393.60 |
| AGS | Alliance Resources | -11 | 3 | 1 | 74 | 0.17 | $ 30,311,013.60 |
| BNZ | Benz Mining | -11 | 0 | 0 | 0 | 1.43 | $ 21,800,108.40 |
| RMS | Ramelius Resources | -11 | -6 | -19 | 27 | 1.57 | $ 1,274,202,193.95 |
| PRU | Perseus Mining | -11 | 3 | -14 | 14 | 1.19 | $ 1,471,748,244.00 |
| AAU | Antilles Gold | -11 | 34 | 71 | 141 | 0.082 | $ 15,416,190.27 |
| AVW | Avira Resources | -11 | 0 | 60 | 300 | 0.008 | $ 9,625,280.00 |
| PKO | Peako | -11 | 0 | 157 | 35 | 0.024 | $ 4,609,300.25 |
| GOR | Gold Road Resources | -11 | 1 | -30 | -6 | 1.24 | $ 1,104,305,558.74 |
| SLR | Silver Lake Resources | -11 | -7 | -25 | 26 | 1.7 | $ 1,511,901,665.23 |
| ZNC | Zenith Minerals | -12 | -12 | 15 | 85 | 0.115 | $ 33,851,403.45 |
| GSN | Great Southern Mining | -12 | 25 | -44 | 33 | 0.084 | $ 38,672,485.70 |
| GUL | Gullewa Limited | -12 | -20 | 4 | 203 | 0.088 | $ 16,048,832.80 |
| SRN | Surefire Resources | -12 | -43 | 538 | 920 | 0.0255 | $ 24,225,269.85 |
| LCY | Legacy Iron Ore | -12 | 125 | 800 | 1700 | 0.036 | $ 224,900,586.61 |
| DCX | Discovex Resources | -13 | 17 | -13 | 17 | 0.007 | $ 8,373,148.53 |
| WAF | West African Resources | -13 | -1 | -5 | 136 | 0.955 | $ 843,775,340.16 |
| RSG | Resolute Mining | -13 | 0 | -37 | -38 | 0.73 | $ 844,477,920.09 |
| ALK | Alkane Resources | -13 | -13 | -28 | 39 | 0.82 | $ 485,241,872.00 |
| NES | Nelson Resources | -14 | 2 | 87 | 103 | 0.086 | $ 10,102,588.50 |
| NML | Navarre Minerals | -15 | -4 | 35 | 62 | 0.18 | $ 103,577,008.69 |
| SAU | Southern Gold | -15 | 5 | -15 | -44 | 0.11 | $ 23,466,163.16 |
| SLZ | Sultan Resources | -16 | -22 | 15 | 211 | 0.19 | $ 13,211,533.91 |
| G88 | Golden Mile | -17 | -4 | -21 | -7 | 0.05 | $ 6,273,934.73 |
| PRX | Prodigy Gold | -17 | 2 | -33 | -33 | 0.045 | $ 26,708,869.88 |
| VMC | Venus Metals | -17 | -2 | -23 | 11 | 0.2 | $ 26,438,769.53 |
| MRZ | Mont Royal Resources | -17 | -14 | 14 | -6 | 0.24 | $ 7,970,608.80 |
| DTR | Dateline Resources | -20 | 0 | 0 | 0 | 0.002 | $ 16,420,156.15 |
| MTH | Mithril Resources | -20 | 18 | -20 | 67 | 0.02 | $ 43,828,578.07 |
| XTC | Xantippe Resources | -20 | 0 | 0 | -33 | 0.002 | $ 10,186,411.01 |
| RXL | Rox Resources | -22 | -22 | -44 | 56 | 0.039 | $ 88,142,623.91 |
| ANL | Amani Gold | -25 | 50 | 50 | -25 | 0.0015 | $ 9,386,996.75 |
| CST | Castile Resources | -26 | -15 | 31 | 0 | 0.23 | $ 43,936,226.62 |
| RMX | Red Mountain Mining | -28 | 0 | 117 | 160 | 0.013 | $ 14,707,192.36 |
Small cap highlights
Frontier Resources (ASX:FNT) surged after picking up a rock containing up to 101g/t of gold at the Kimono prospect in PNG.
Trench sampling is planned for late January to dial in on some drill targets.
Hawkstone Mining (ASX:HWK) is a gold focussed explorer right now, but its recent spike can be attributed to positive battery metals sentiment.
Its Big Sandy project in the US, currently on the backburner, hosts a big 320,800 tonne lithium carbonate equivalent (LCE) resource.
Great Northern Minerals (ASX:GNM) hit thick, high grade gold at the Camel Creek project in Queensland.
Highlights include 5m grading 12.2 grams per tonne (g/t) gold from a depth of 59m.
“At Camel Creek we have now tested 1000m of the total 3.3km of total mineralised strike and previous mined areas,” managing director Cameron Mclean says.
“The surface has only been scratched and from what we know about this style of gold deposit is that it should continue to great vertical depth. We now need to drill the entire gold system.”
Pacific American (ASX:PAK) has locked in a previously announced farm in deal over the Porphyry North gold project in WA.
A drill rig has also been secured, with 3,600m of drilling due to kick off at the end of January, the company says.
Related Topics

Related Stories


SUBSCRIBE
Get the latest breaking news and stocks straight to your inbox.
It's free. Unsubscribe whenever you want.
By proceeding, you confirm you understand that we handle personal information in accordance with our Privacy Policy.


