Chart of the Day: Zip behaving like a proper stock is a beautiful thing to behold

Pic: Thinkhubstudio / iStock / Getty Images Plus via Getty Images
What a superb chart this one is.
A broad uptrend, as can be clearly seen in this one-year view.
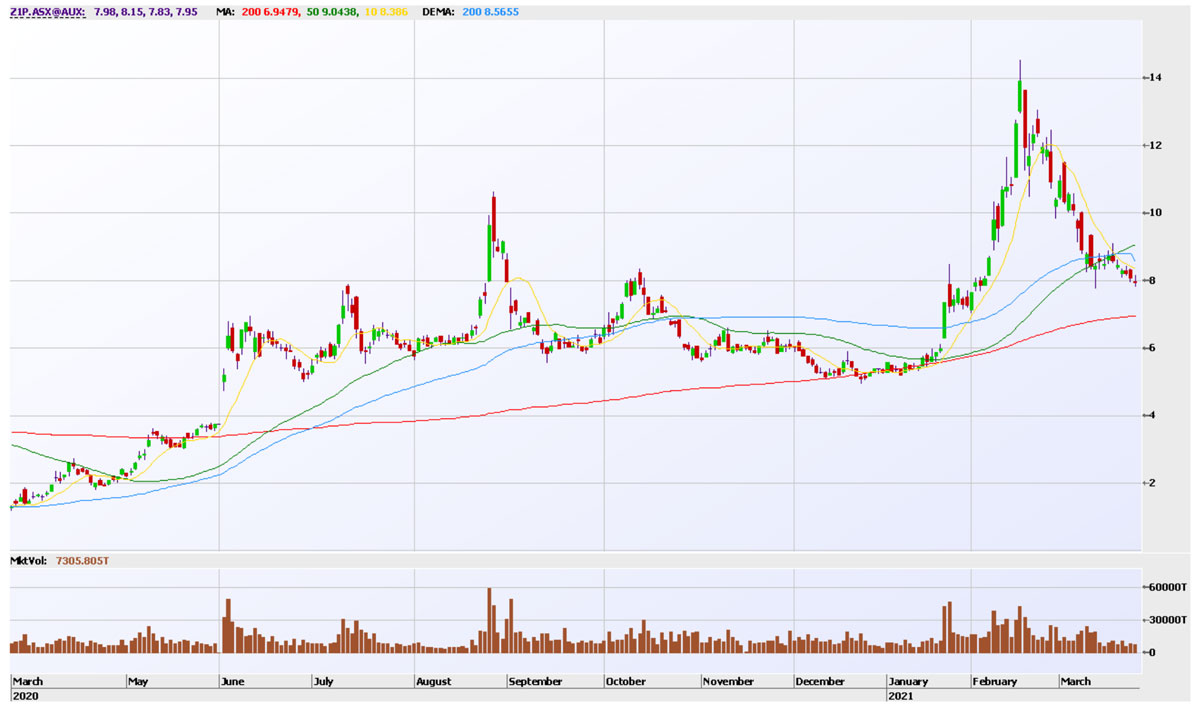
Every so often an exponential move within the context of that broader uptrend, the most recent and impressive of which was the run to $14 in the middle of Feb.
And then as soon as the move is done, the stock switches to a majority of bearish candles, and duly comes back to settle at the level of previous support.
In the middle part of 2020, that support can clearly be seen as $6, until the break lower in December which took it down to the simple 200 day moving average, as depicted in red.
The hugging of that average through the end of 2020 and into the start of 2021 is a work of art.
Once released from its envious clutches, the most impressive exponential move of the year kicked off, commencing with a yet to be filled gap from $6 on the day it all began on the 30th of January.
And so at the close yesterday we loiter with intent around $8, previous resistance turned support from October 2020, and July 2020 before that.
Rather than add to the universe of conjecture around Z1P’s actual prospects, let’s focus on how technically compliant the Z1P price action actually is.
Not to mention just how liquid it is.
It’s a fantastic stock to talk about when talking about ‘flows’, which I would argue are more intrinsic to the structure of the market than at any time previous.
So either $8 holds or it does not.
The money, if to be made, will be made more easily should the uptrend resumes, but we can afford to let the stock tell us that is a greater probability of occurring, with a break of those several moving averages that are hemming it in, the 10 day in yellow as a starting point.
If $8 does not hold, that gap back down to $6.13 will be the target, and if to be filled, a break of that critical 200 day simple moving average will already have occurred.
As I am so fond of saying, whilst any number of narratives will always be available to engage in that seek to explain what is happening in the market – at the end of the day we can only ever trade in ‘price’.
Steve Collette of Collette Capital Pty Ltd (ABN 56645766507) is a Corporate Authorised Representative (No. 1284431) of Sanlam Private Wealth (AFS License No. 337927), which only provides general advice.
Collette Capital only makes services available to professional and sophisticated investors as defined by the Corporations Act, Section (s)708(8)C and 761G(7)C.
The Collette Capital Wholesale IMA Strategy has returned +24.57% p.a. net of all fees as at the end of February 2021 since inception in January 2015 (using the Time Weighted Return method of calculating returns).
Learn more at www.collette.capital
Related Stories


UNLOCK INSIGHTS
Discover the untold stories of emerging ASX stocks.
Daily news and expert analysis, it's free to subscribe.
By proceeding, you confirm you understand that we handle personal information in accordance with our Privacy Policy.


