Guy on Rocks: Gold, silver and everything else from the podium
‘Guy on Rocks’ is a Stockhead series looking at the significant happenings of the resources market each week. Former geologist and experienced stockbroker Guy Le Page, director, and responsible executive at Perth-based financial services provider RM Corporate Finance, shares his high conviction views on the market and his “hot stocks to watch”.
Market Ructions: Precious and base metals retreat from record highs
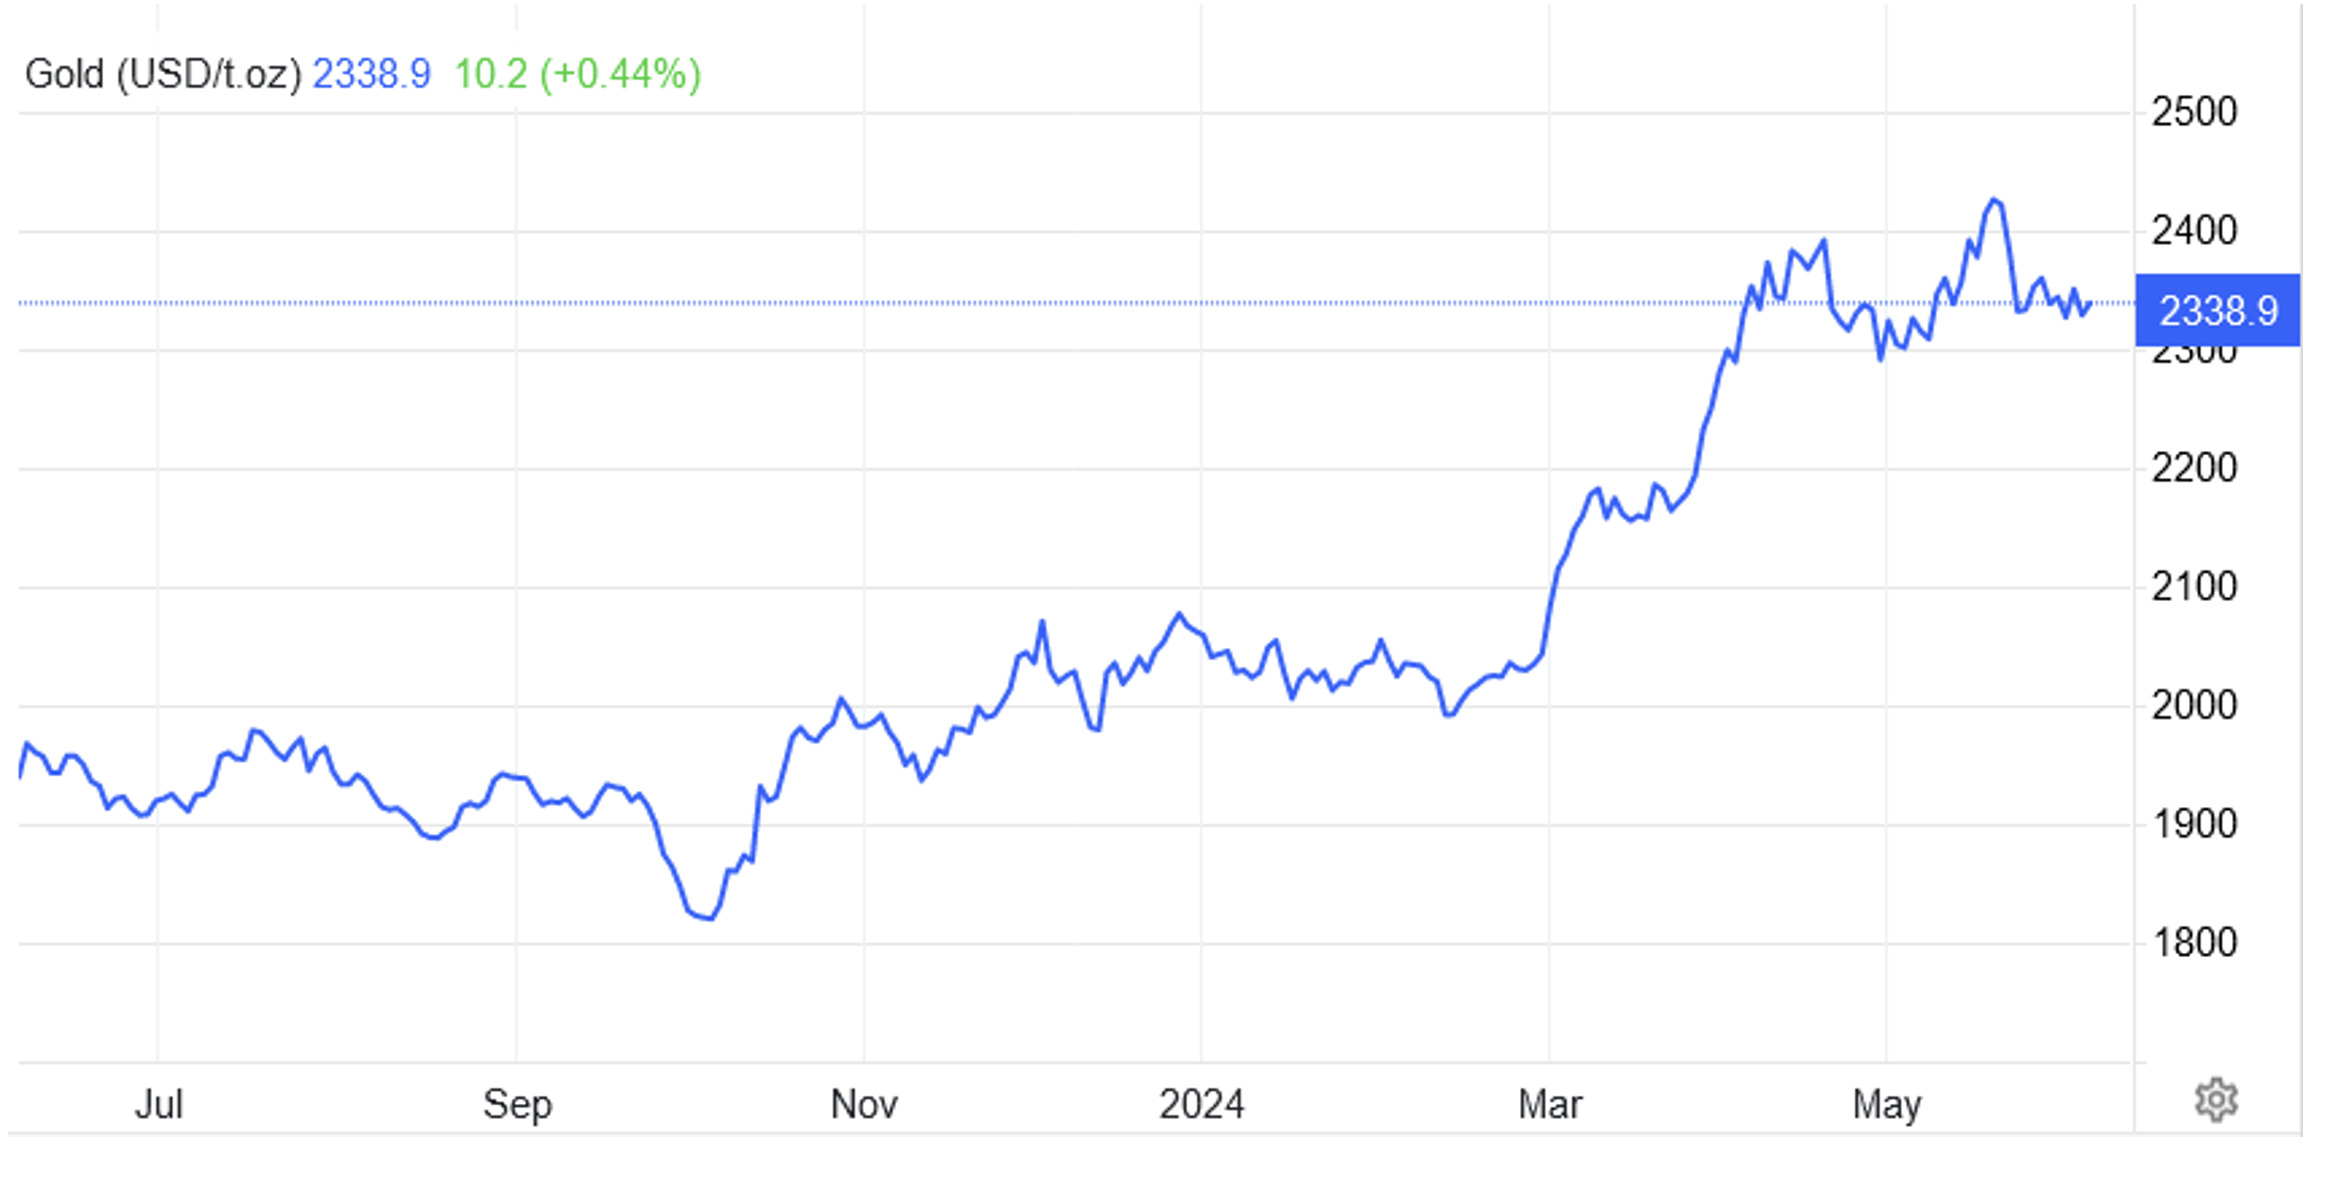
Volatility has settled down in precious metals with gold coming off US$2,421.20 per ounce a few weeks ago and has been trading in a sideways pattern over the last week between US$2,356 and US$2,314 closing at US$2,338/ounce in late Wednesday afternoon trading (figure 1).
The gold price tanked two weeks ago on the release of the minutes from the April/May FOMC meeting where some of the committee members were open to increasing rates if necessary on the basis that stubborn inflation and strong economic data in the US persists.
Silver was down to US$29.71 off over US$2/oz over the last weeks after trading over US$32/ounce. US treasuries were marginally lower at 4.31% in mid-week trading while the DXY is slightly lower at 104.21. The VIX remains at very low levels at 12.97 up from 11.93 last week.
The World Gold Council reported earlier that central bank buying remains strong with over 33 metric tonnes purchased over April up from 3 tonnes in March.
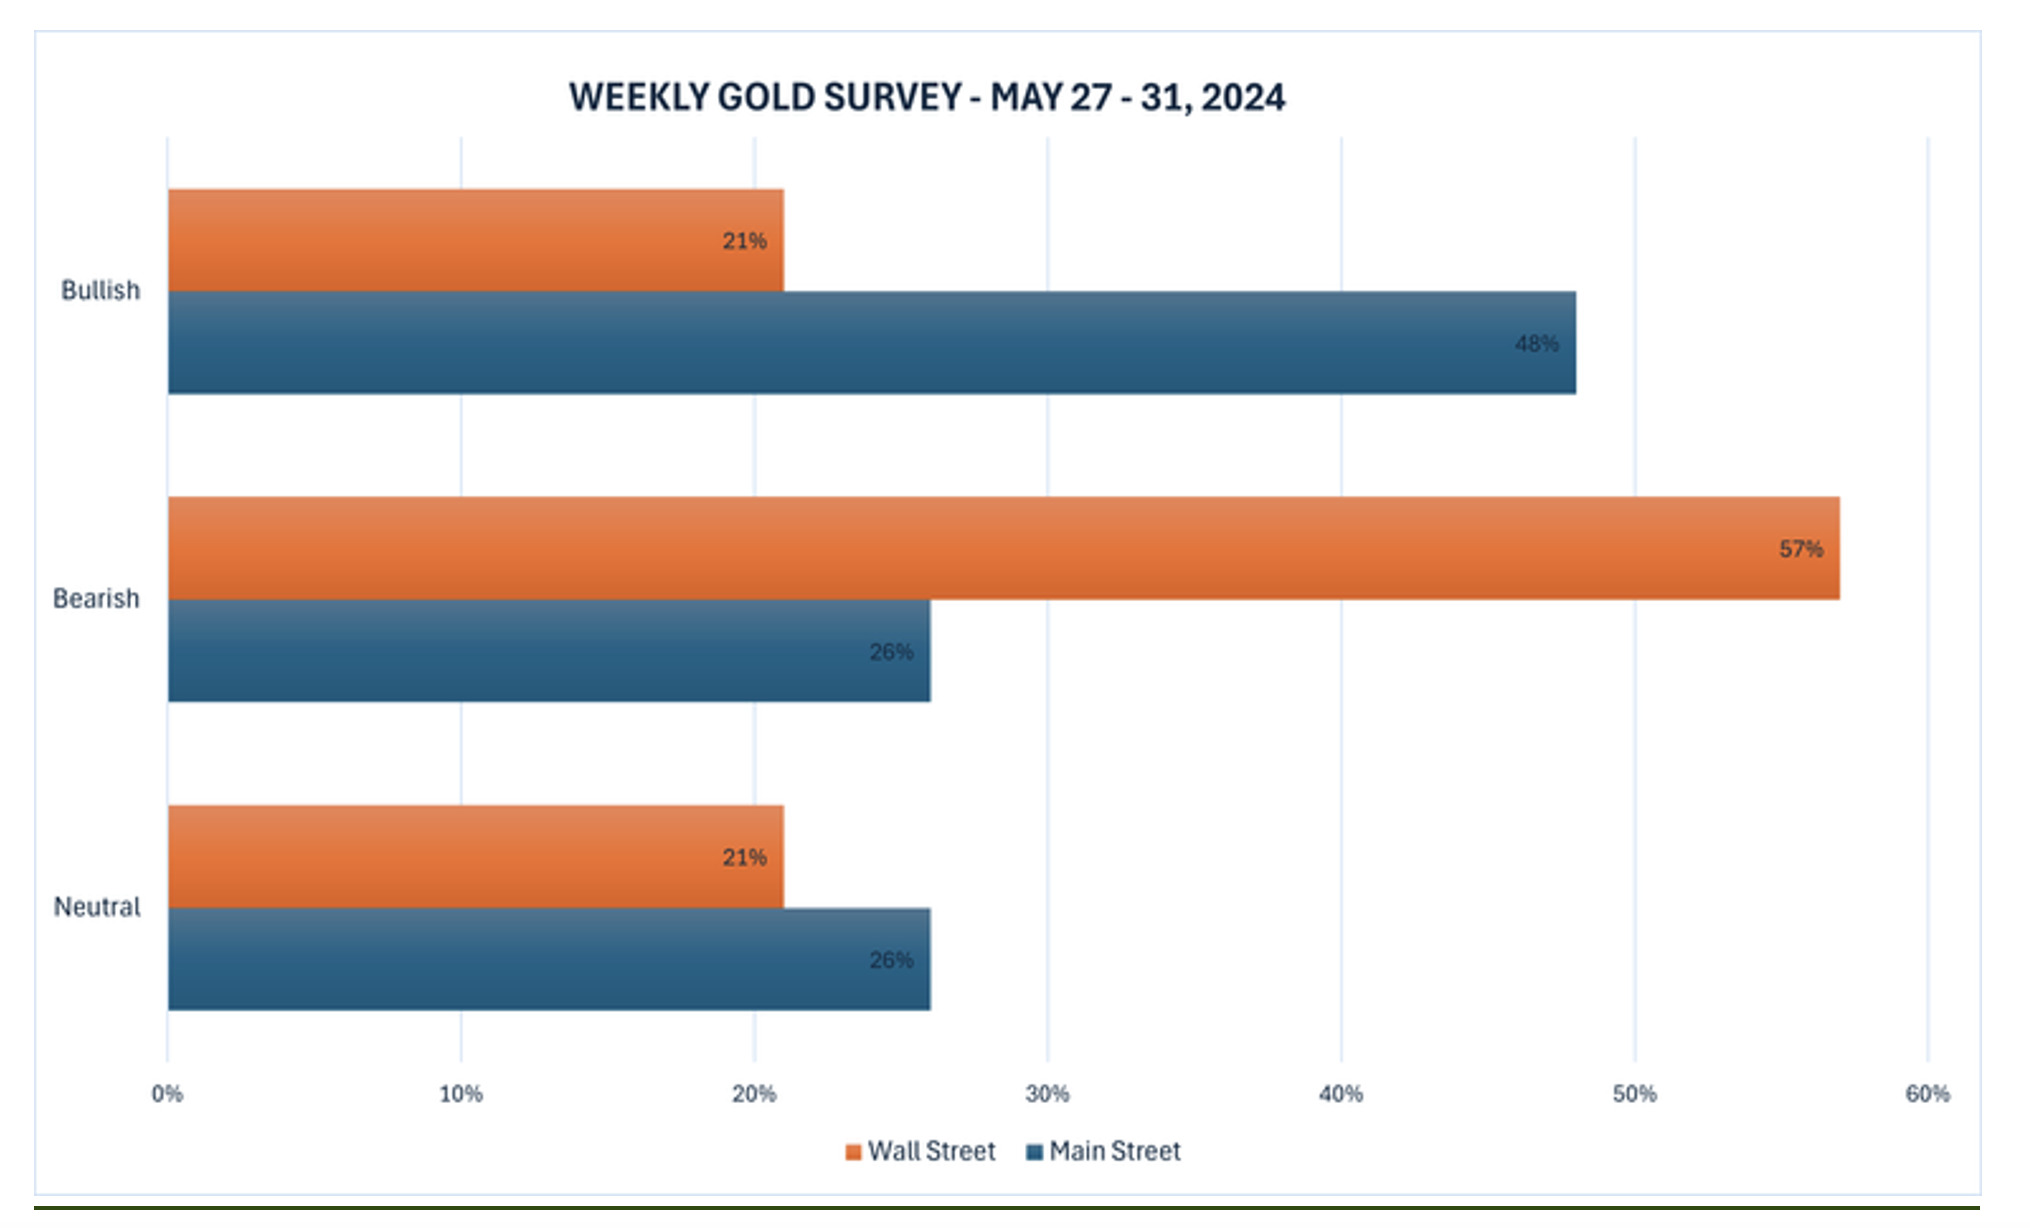
The Kitco News Weekly Gold Survey over the last week of May (figure 2) had over three-quarters of industry experts believing gold prices have peaked for the time being and are likely to decline as we move into June.
Yesterday’s ADP national employment report for May showed an increase of 152,000 compared to market expectations of a 175,000 increase. This, according to Neils Christensen in a recent Kitco news article, is supportive for a further rally in gold and silver markets today.
Other important U.S. data out this week includes Friday’s May employment report from the Labor Department. Market commentators are projecting an increase in key non-farm payrolls of 178,000 versus the April report showing a gain of 175,000 jobs.
Thursday’s European Central Bank (ECB) meeting will also be weighing on markets with an expectation that the ECB will cut interest rates by 25 basis points.
Darin Newsom, from Barchart.com believes “June Gold has more room to the downside to finish its 3-wave downtrend next week.
This means the contract would be expected to take out Friday’s low (so far) of $2,326.30. Daily stochastics (a short-term momentum study) are above the oversold level of 20%, also indicating the contract has time and space to move lower.”
I think US$3,000 is probably not far away no matter which direction interest rates head. Central banks, together with Asian demand, are highly likely to tighten the gold market on any pullback which should see good support for gold around US$2,300/ounce. Therefore, a decoupling from US Treasuries and the USD may well be on the cards.
Copper futures continued their downward trend to US$4.5/lb their lowest levels in over a month after hitting records highs in a classic short squeeze a few weeks ago. Tepid Chinese demand was evident in a contraction in official manufacturing PMI coupled with excess supply from Chinese refiners held output at elevated levels through scrap usage.
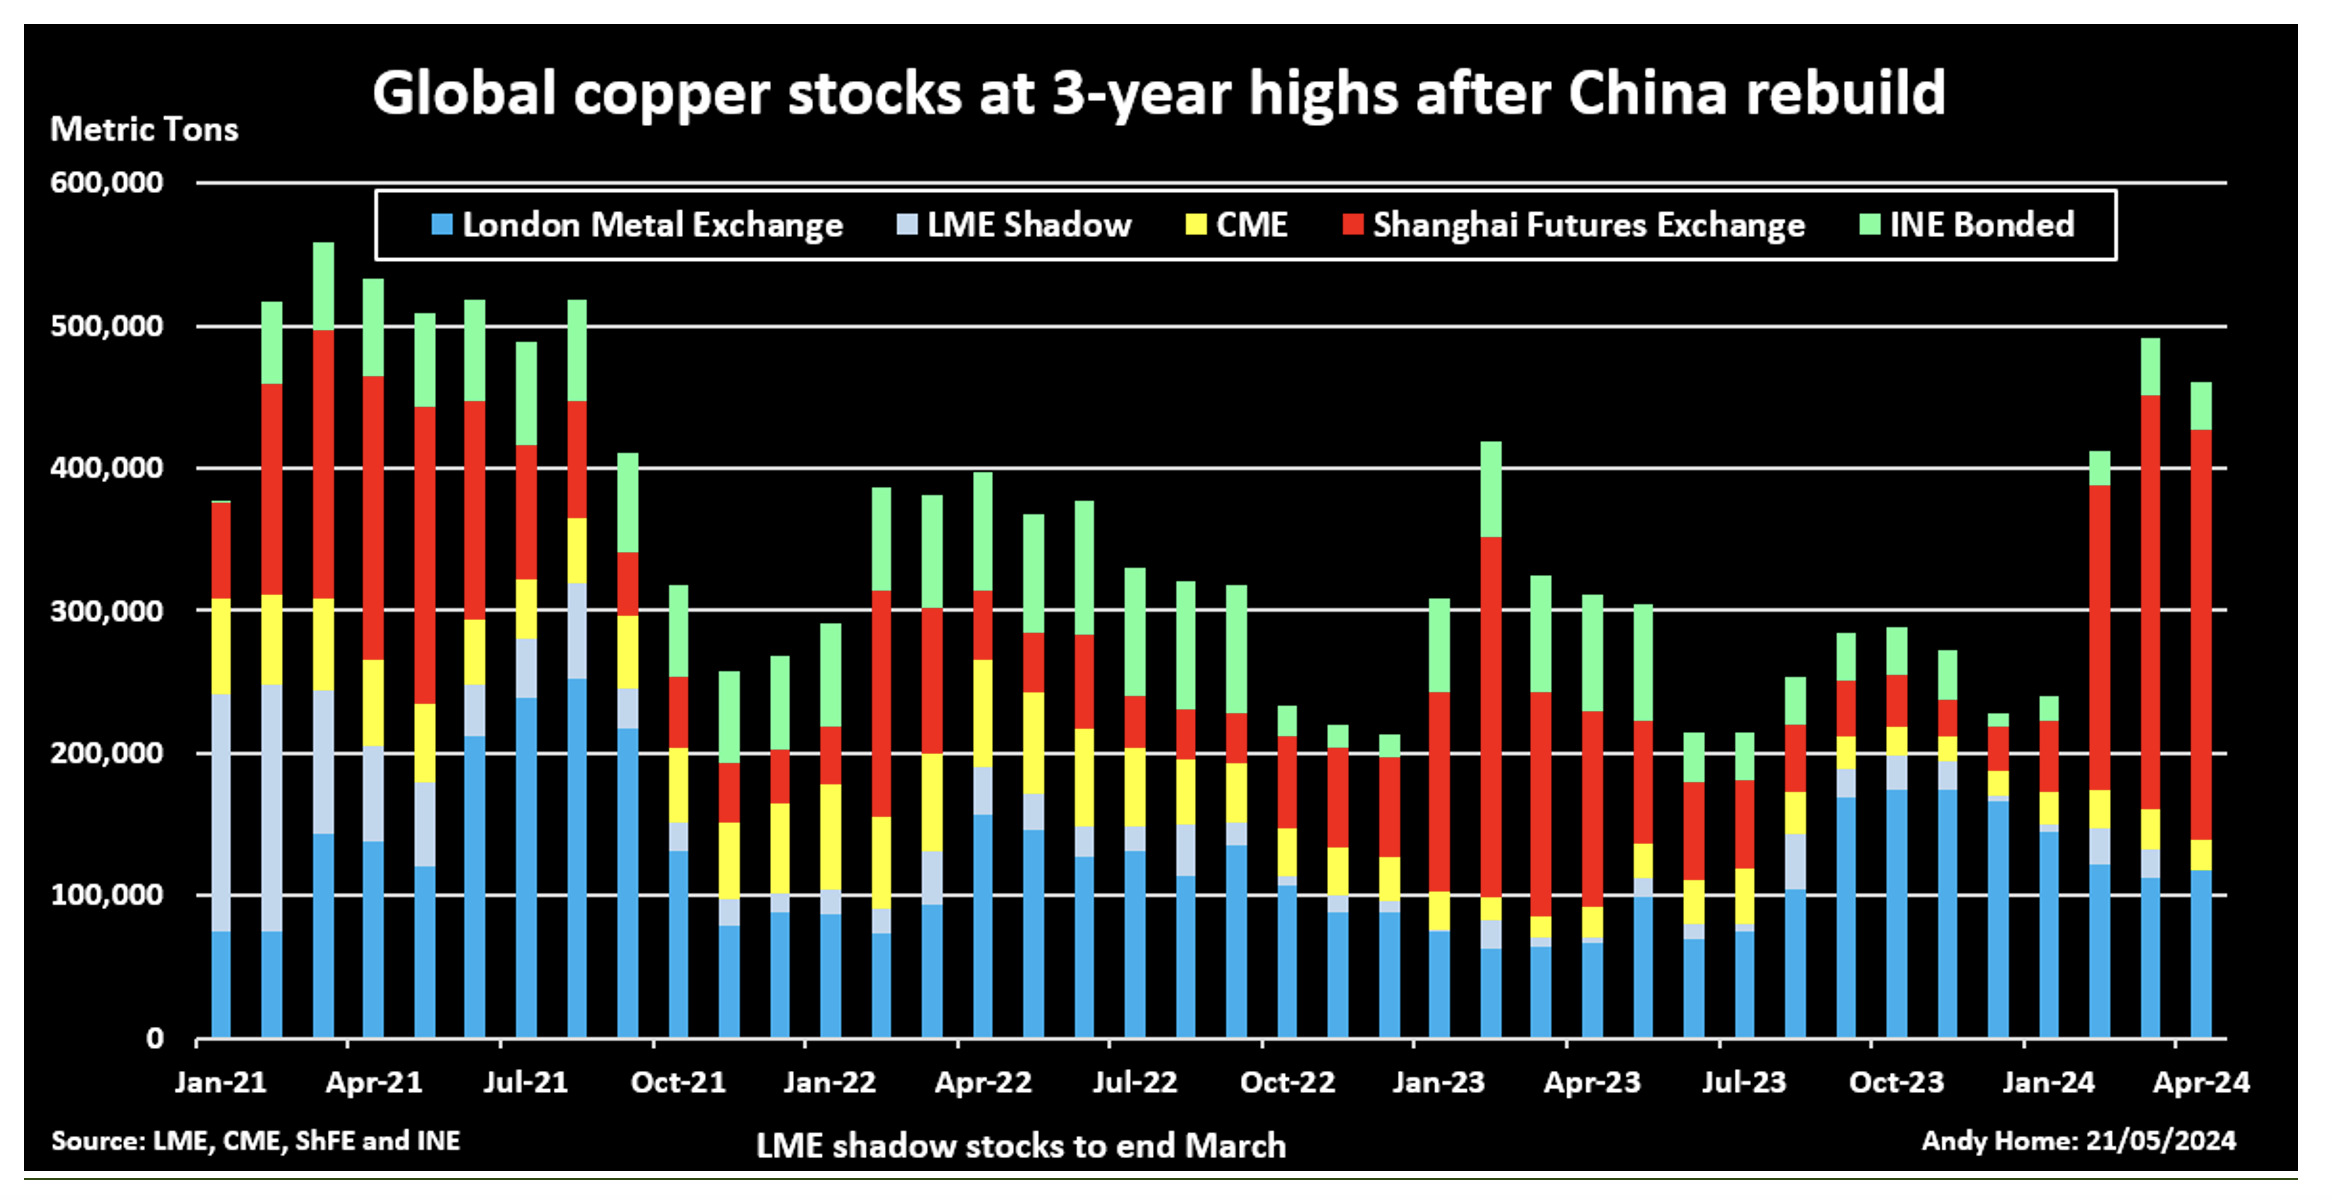
As a result, Chinese inventories continued their upward trend reaching their highest levels since 2020. LME stockpiles in Asia also increased. Copper deliveries from Shanghai bonded warehouses continued to trade at a discount to LME for the second straight week.
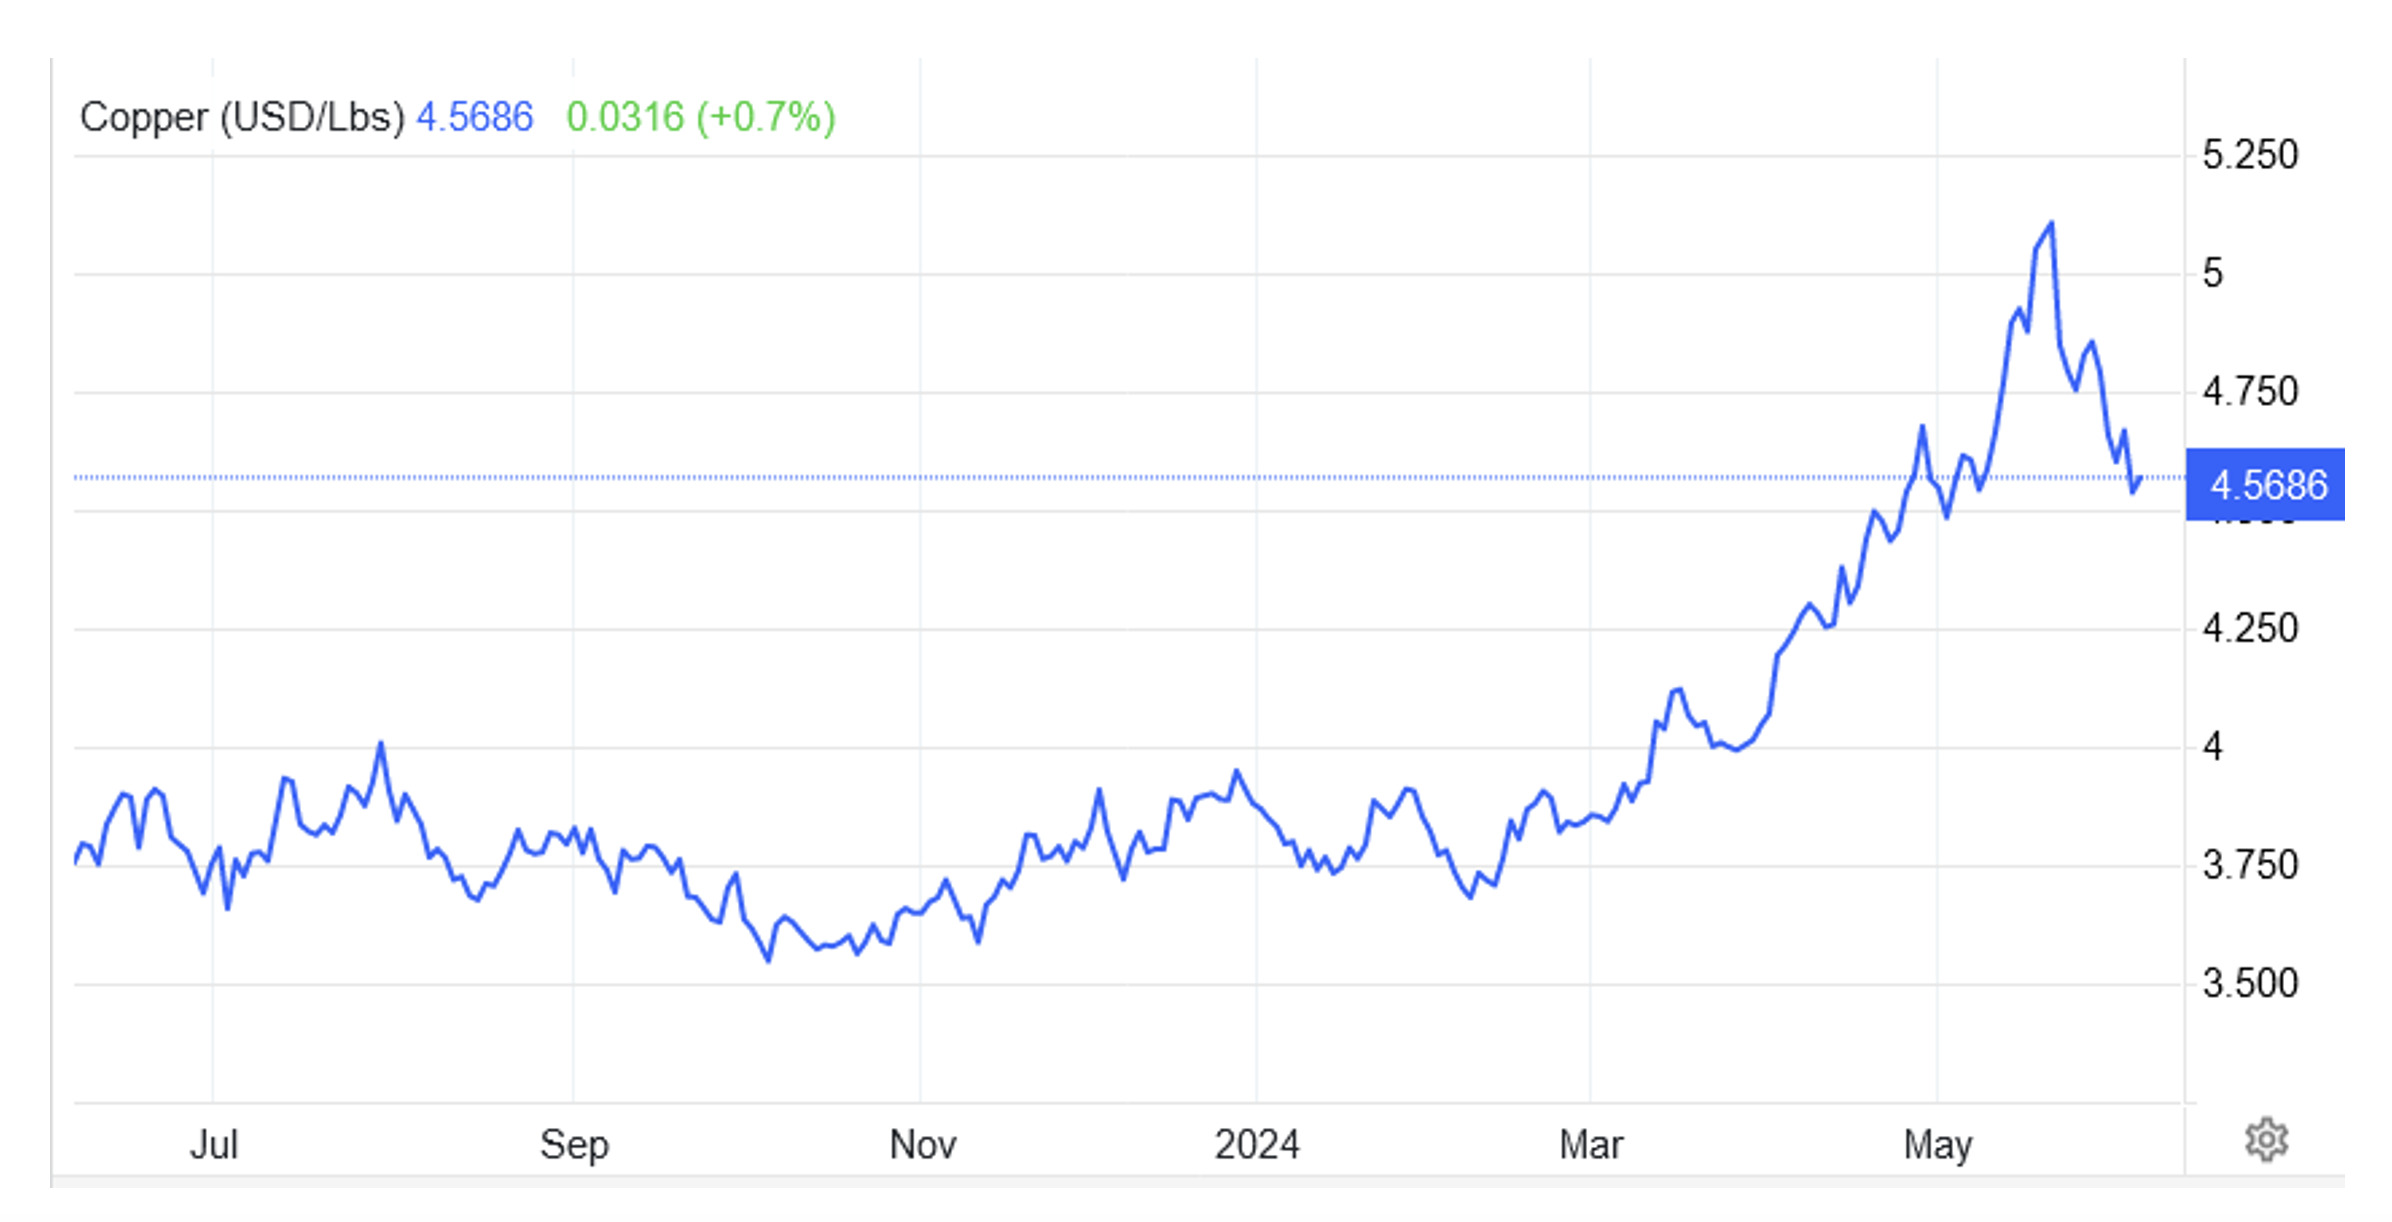
The last two weeks follows on from Copper’s wild ride in late May (figure 3) after reaching all-time highs of US$5.20/lb in a classic short squeeze two weeks ago on the COMEX that saw copper being shipped to the US to covert various short positions.
Despite the recent selldown over recent weeks copper has still put on over 25% since the start of the year as the drive towards electrification and tight supply has many analysts projecting a 5Mt deficit by 2030. In China however the story is different with inventories at elevated levels.
The Shanghai Futures Exchange (ShFE) was holding around 291,020 tonnes late last week compared to 105,900 at the LME and 18,244 at the CME (figure 4).
The elevated levels in China are due in part to high levels of imports and rising domestic output. Imported copper concentrate rose by 7% year-on-year to 9.34Mt over January-April this year with Chinese players adjusting to the loss of the Cobre Panama mine following its closure late last year.
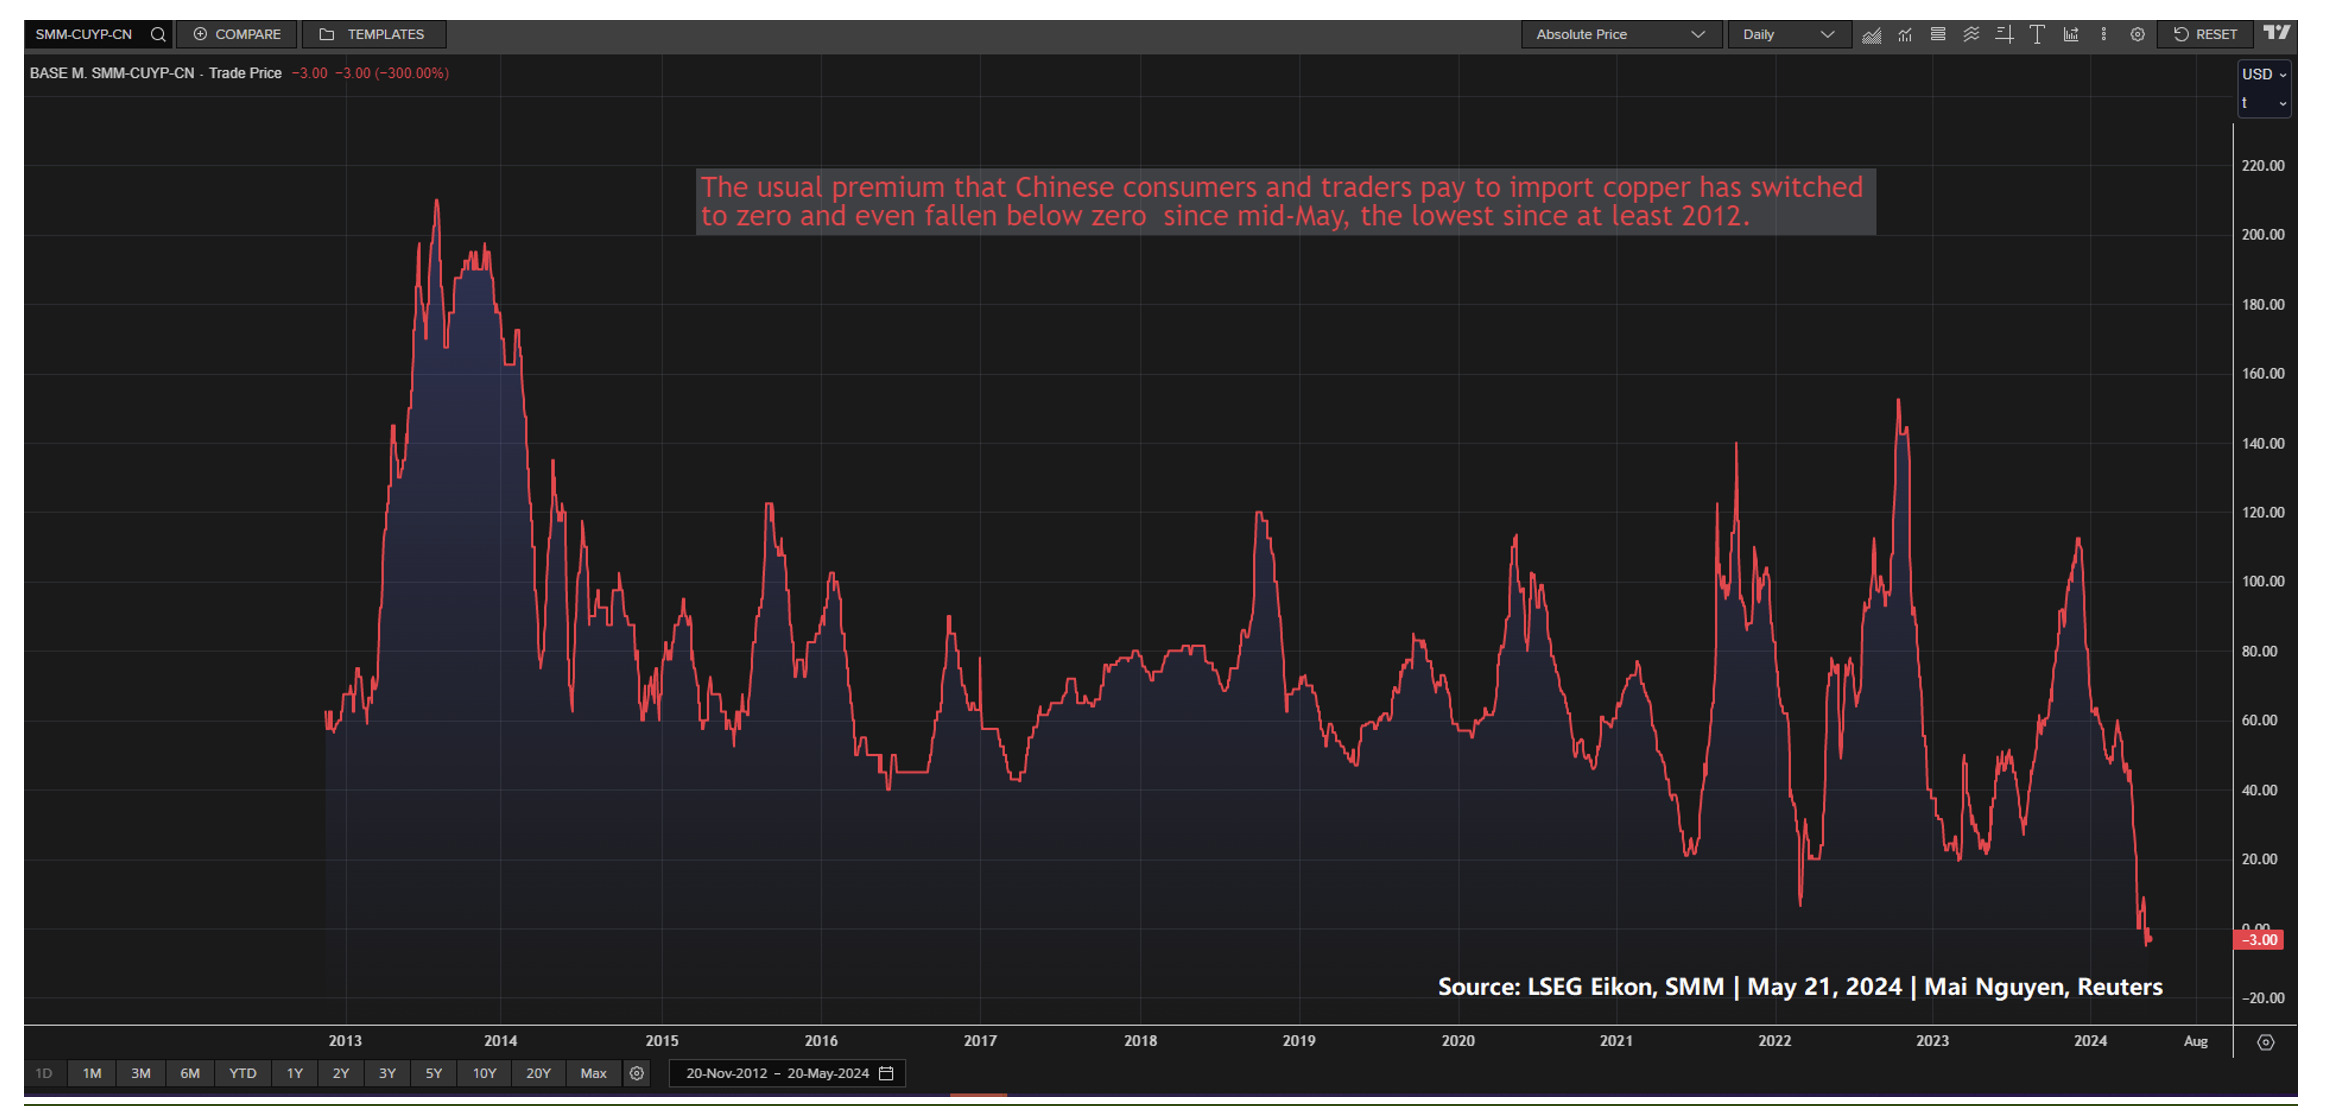
The disconnect between China and the result of the world has seen a collapse in Yangshan import premiums (figure 5) which the Shanghai Metal Markets is currently reporting at minus $5 per ton, its first-time trading at a negative value since its commencement in 2013.
Not surprisingly the Macquarie Commodities Strategy Team has increased price targets for copper on the back of reduced mine supply and refined demand moving lower but with a net tightening of the balance leading to a higher short term price outlook.
Macquarie’s revised forecasts are for CY24 prices to increase by 7% to US$9,671/t with 2QCY24 up 12% to US$9,940/t, 3QCY24 up 3% to US$9,800/t and 4QCY24 up 14% to US$10,500/t. CY25 prices have also been lifted, up 9% to US$9,575/t.
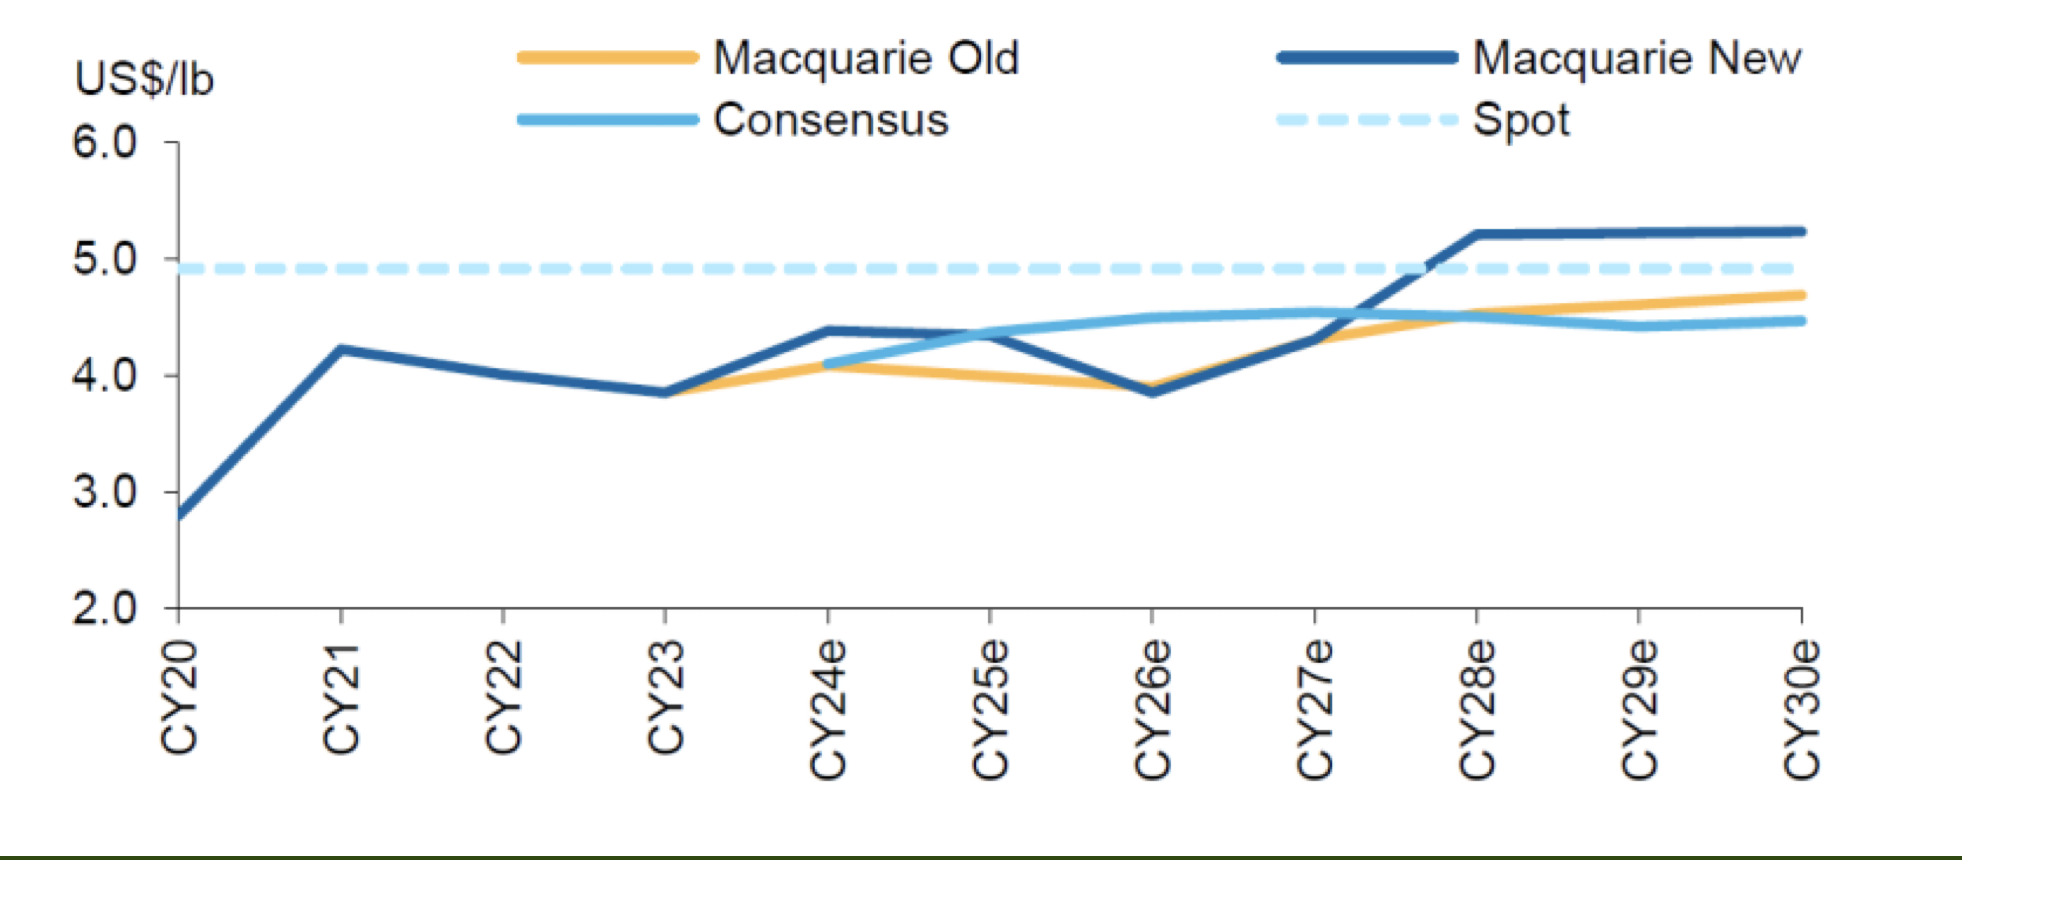
Interestingly Macquarie believes that the medium-term outlook will see the copper price back in balance (figure 7) with CY26 prices forecast to fall by 1% to US$8,500/t and CY27 prices unchanged at US$9,500 but rising to US$11,500/tonne in 2028 due to the tighter balance.

The copper wars are well and truly on, but BHP couldn’t quite swallow Anglo American with the deal being scuttled two week ago with the parties unable to come to an agreement on BHP’s complex US$74 billion deal. Apparently Anglo American is refusing to engage in further discussion.
Elsewhere iron ore (62% fines) futures hit three-month highs two weeks in response to Chinese government support for the property sector despite high levels of inventories at Chinese ports.
Three- month futures on the Dalian Commodity exchange reached US$126.95/dmt two weeks ago representing upticks in the price over five straight days before pulling back to US$107.65/dmt in mid- week trading.
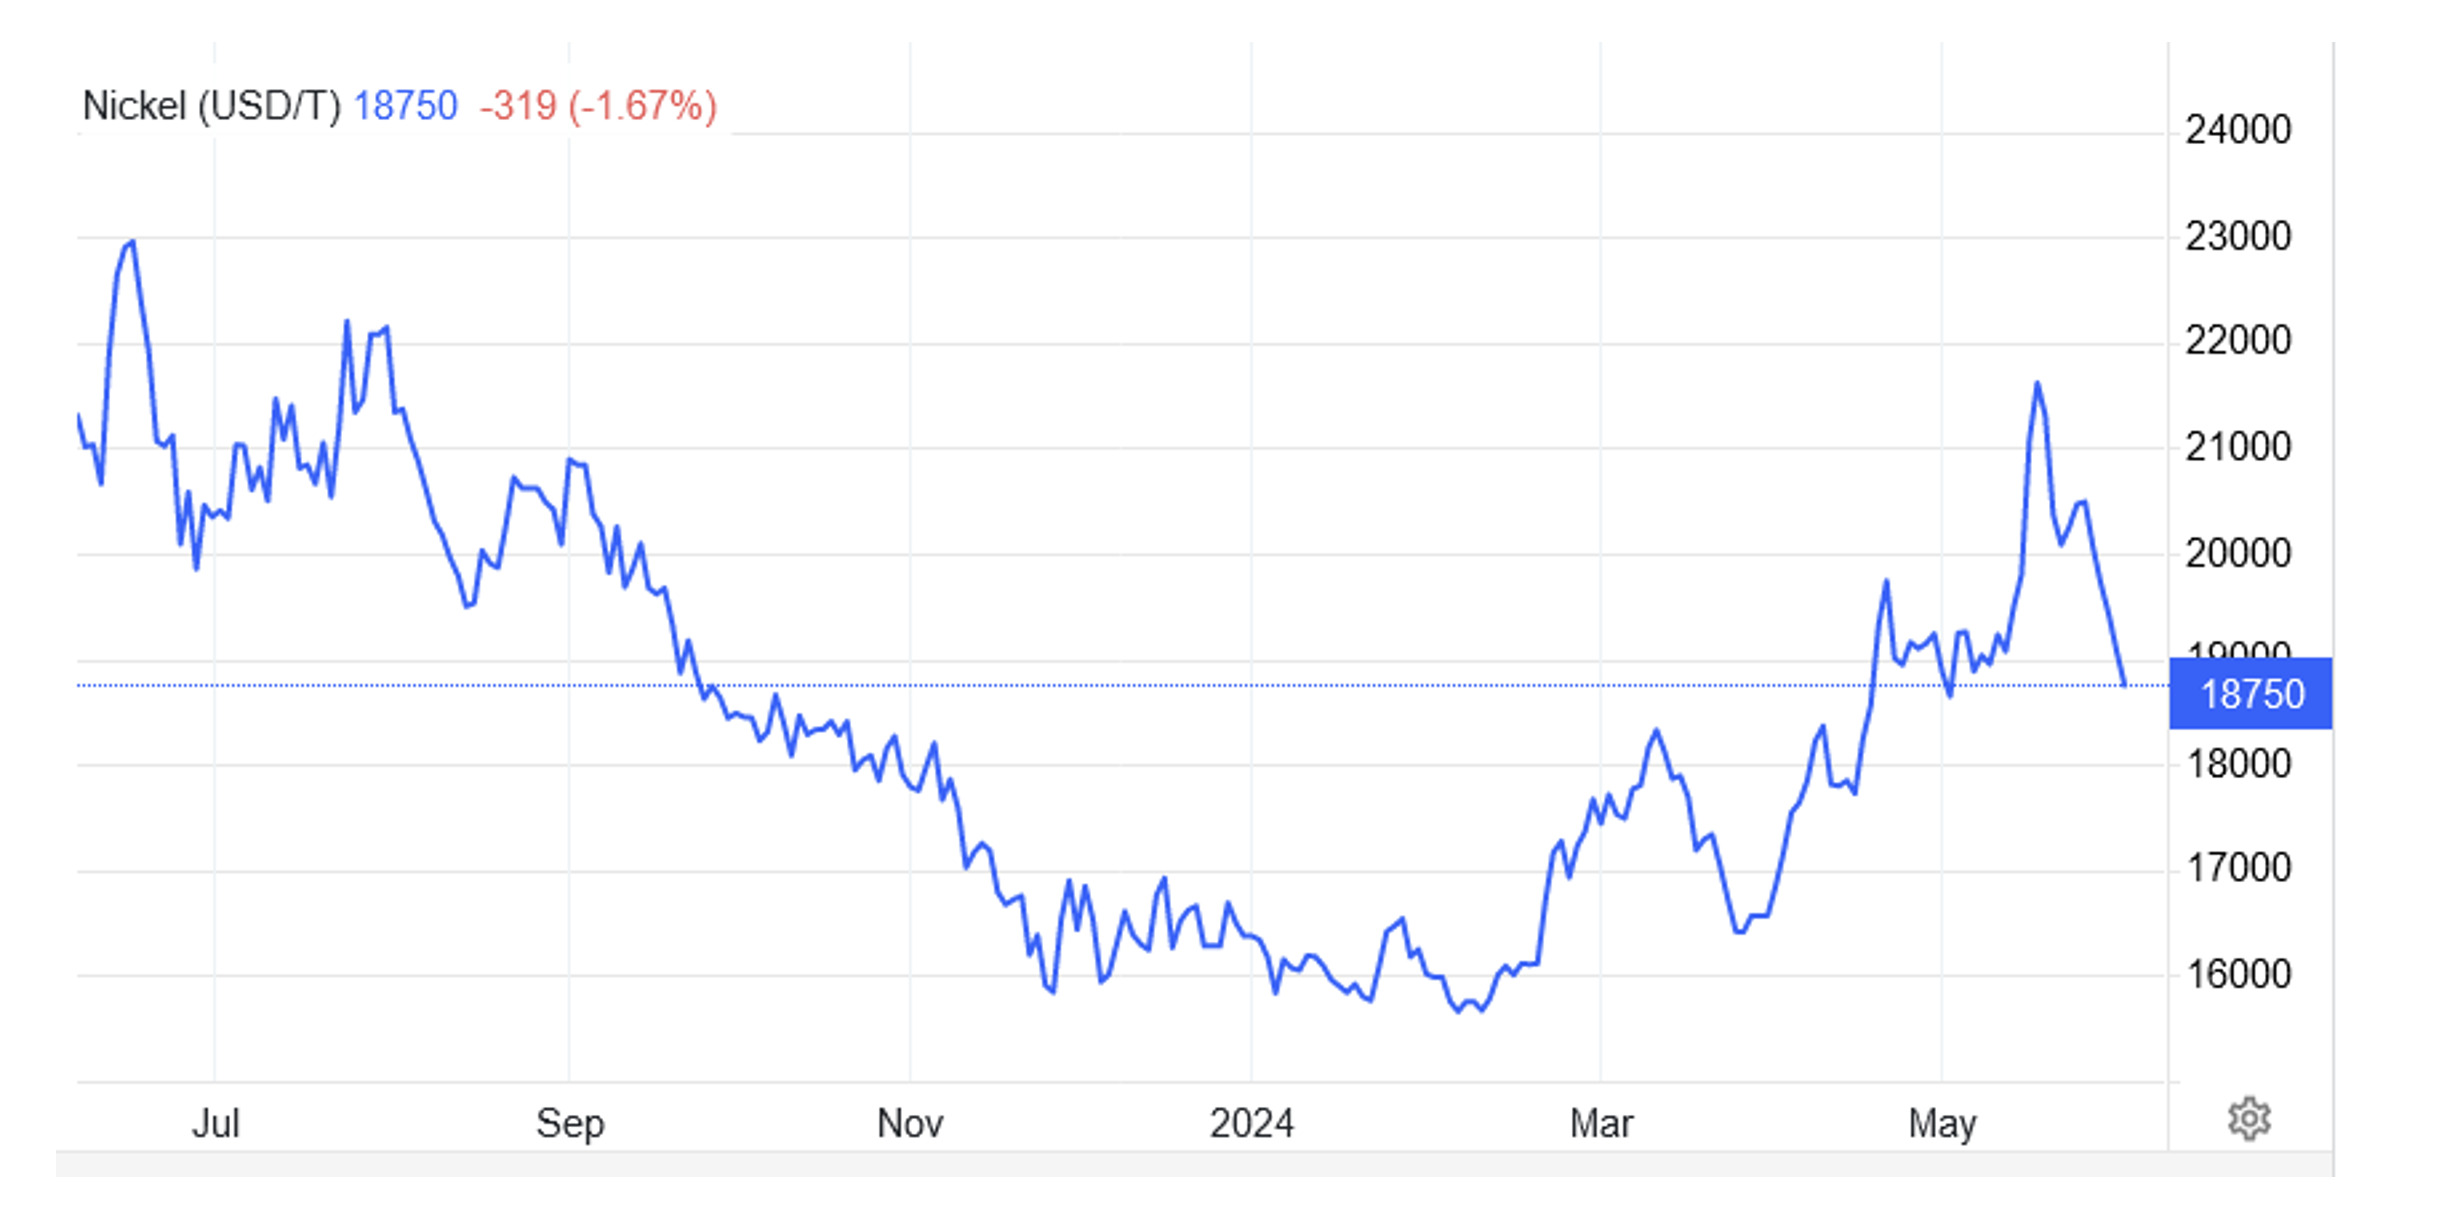
A glimmer of hope for nickel (figure 8) which recovered to US$21,600/tonne in late May, before pulling back to US$18,750/tonne in mid-week trading, as civil unrest in New Caledonia (world’s third largest producer), mine shutdowns (Ravensthorpe) and a ban on Russian nickel from the LME have seen a bounce from its US$15,600/tonne lows earlier this year.
However, according to Dim Ariyasinghe from UBS this won’t be enough to offset surging nickel laterite production from Indonesia. He says nickel will pull back to $US16,550/t over the next two years.
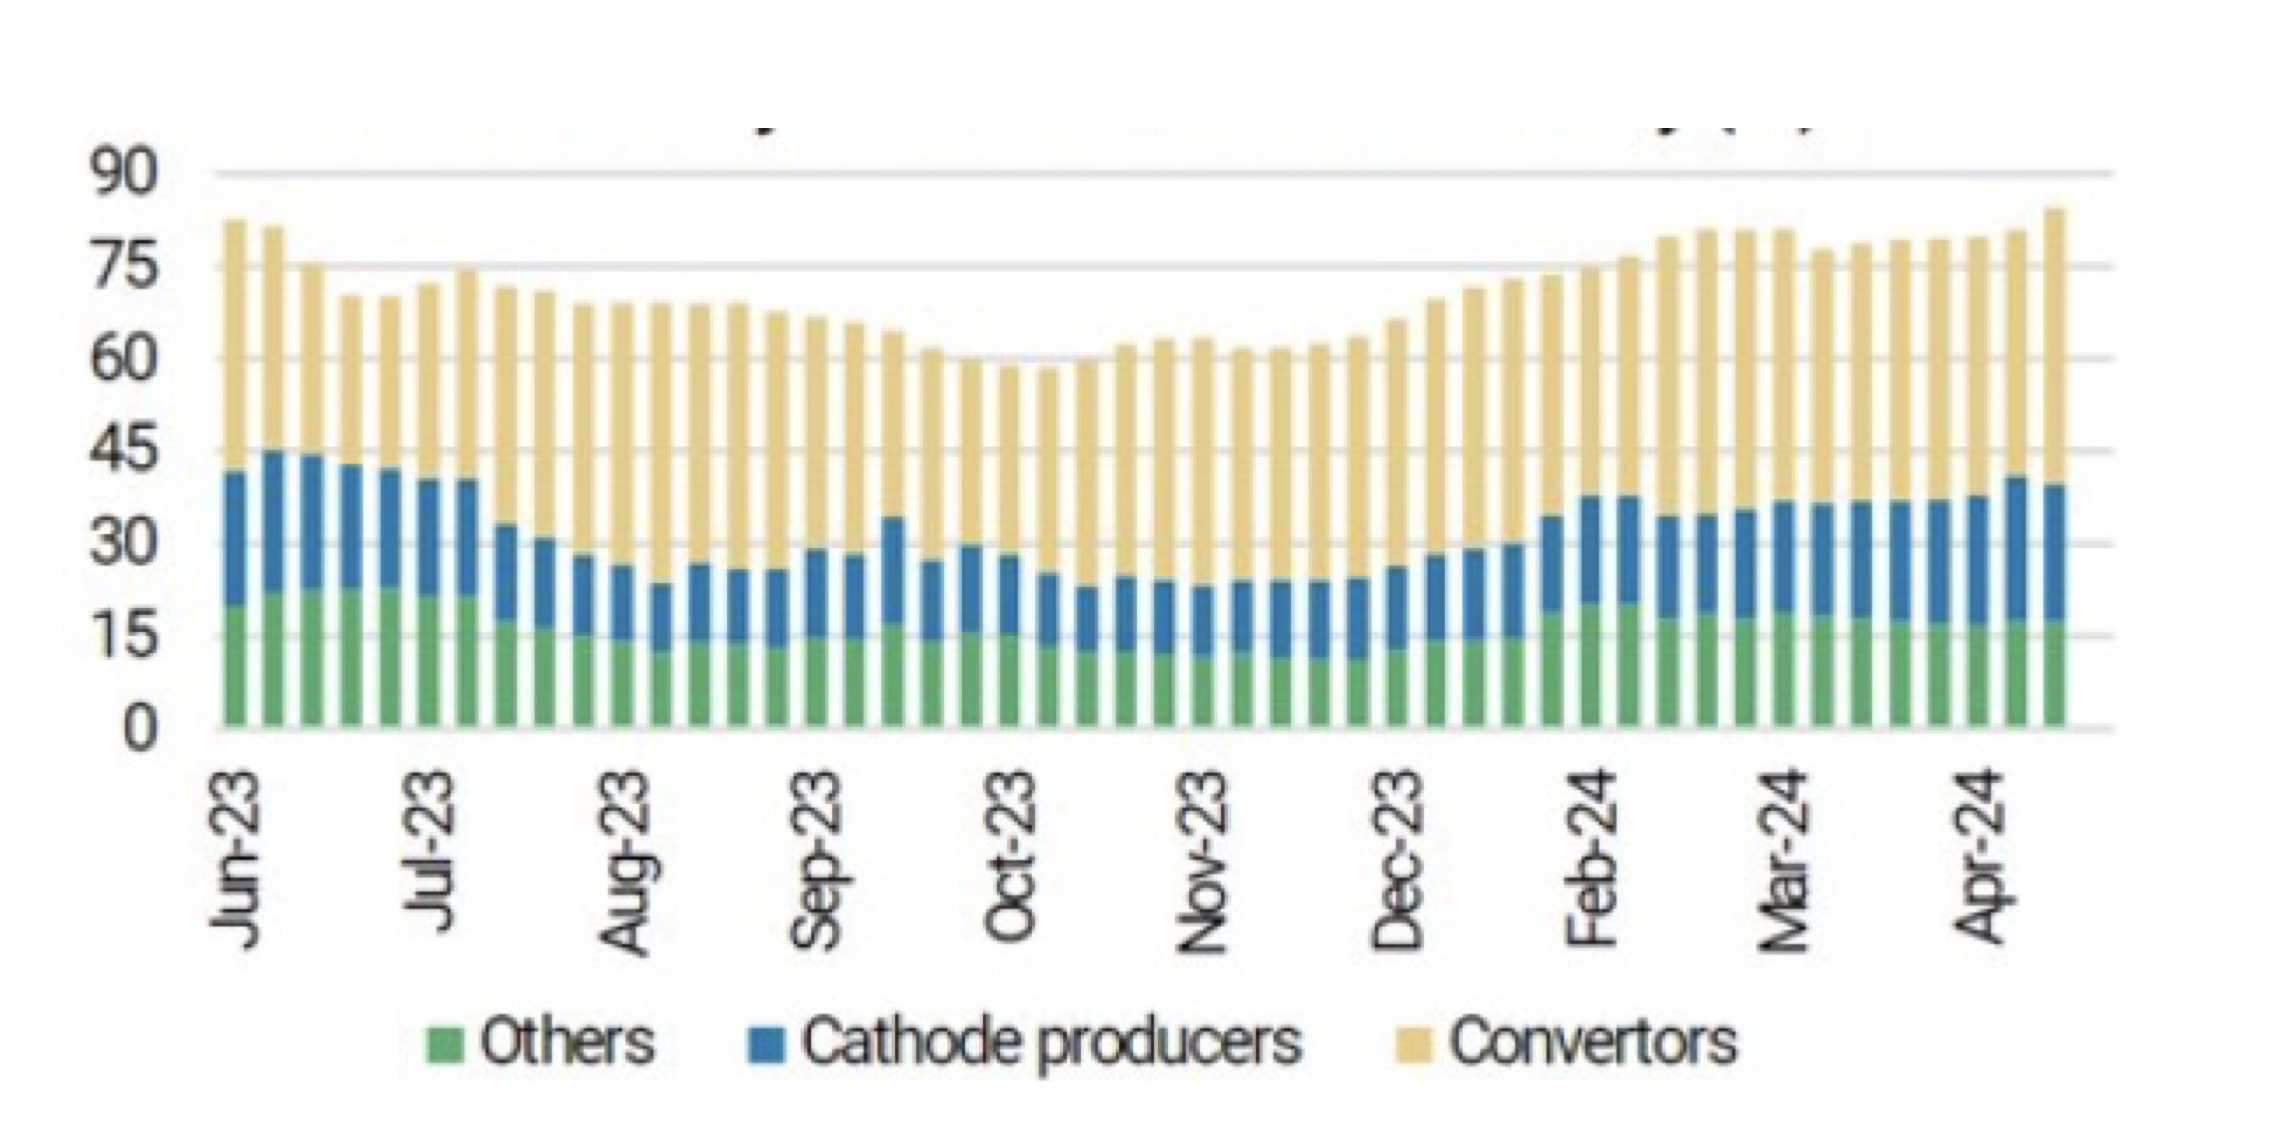
Finally, despite lithium prices recovering this year some analysts believe that we are nearing an end to Chinese cathode restocking with supply also on the rise.
Lithium inventories (figure 9) remain high with EU tariffs potentially having an adverse effect on China’s battery and EV exports. The team sees the lithium balance loosening in the coming months as supply ramps up from all jurisdictions as well, with downside to its Li carbonate base case of US$13,500/t.
New Ideas…Magnificent
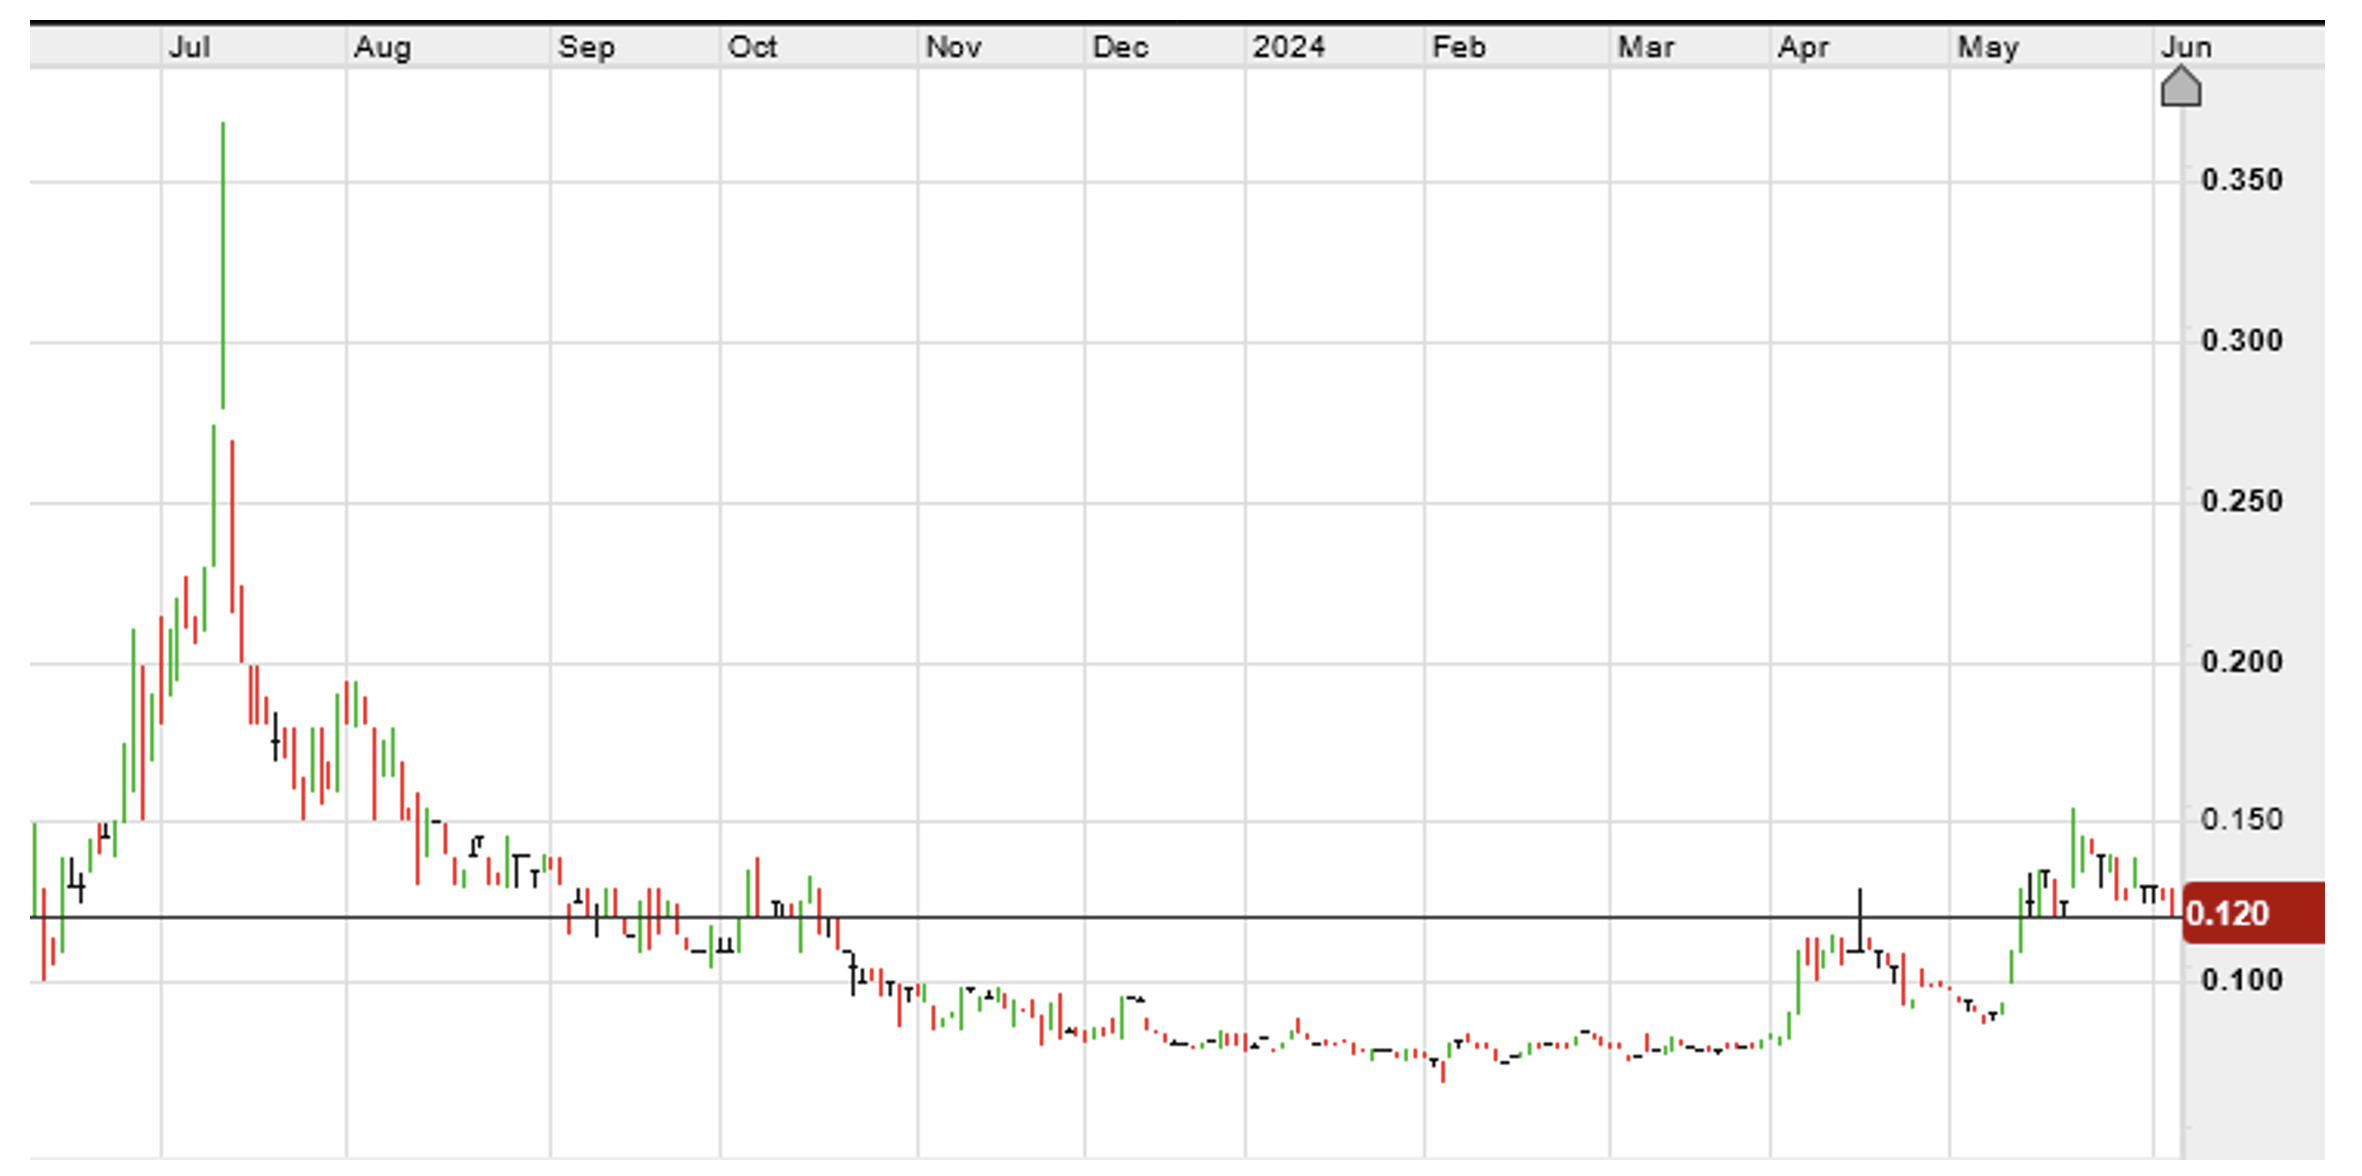
The Stockhead faithful must be over the moon about my 24 April 2024 highlighted stock for that week which was Everest Metals Corporation (ASX:EMC) (figure 10) a junior resource company headed by the “Magnificent” Mark Caruso.
Well in this short space of time the stock has moved from 9 cents and recently hit a nine-month high of 15 cents before pulling back to 12 cents in early trade on Thursday. The Company remains in a trading halt pending an announcement on a capital raising.
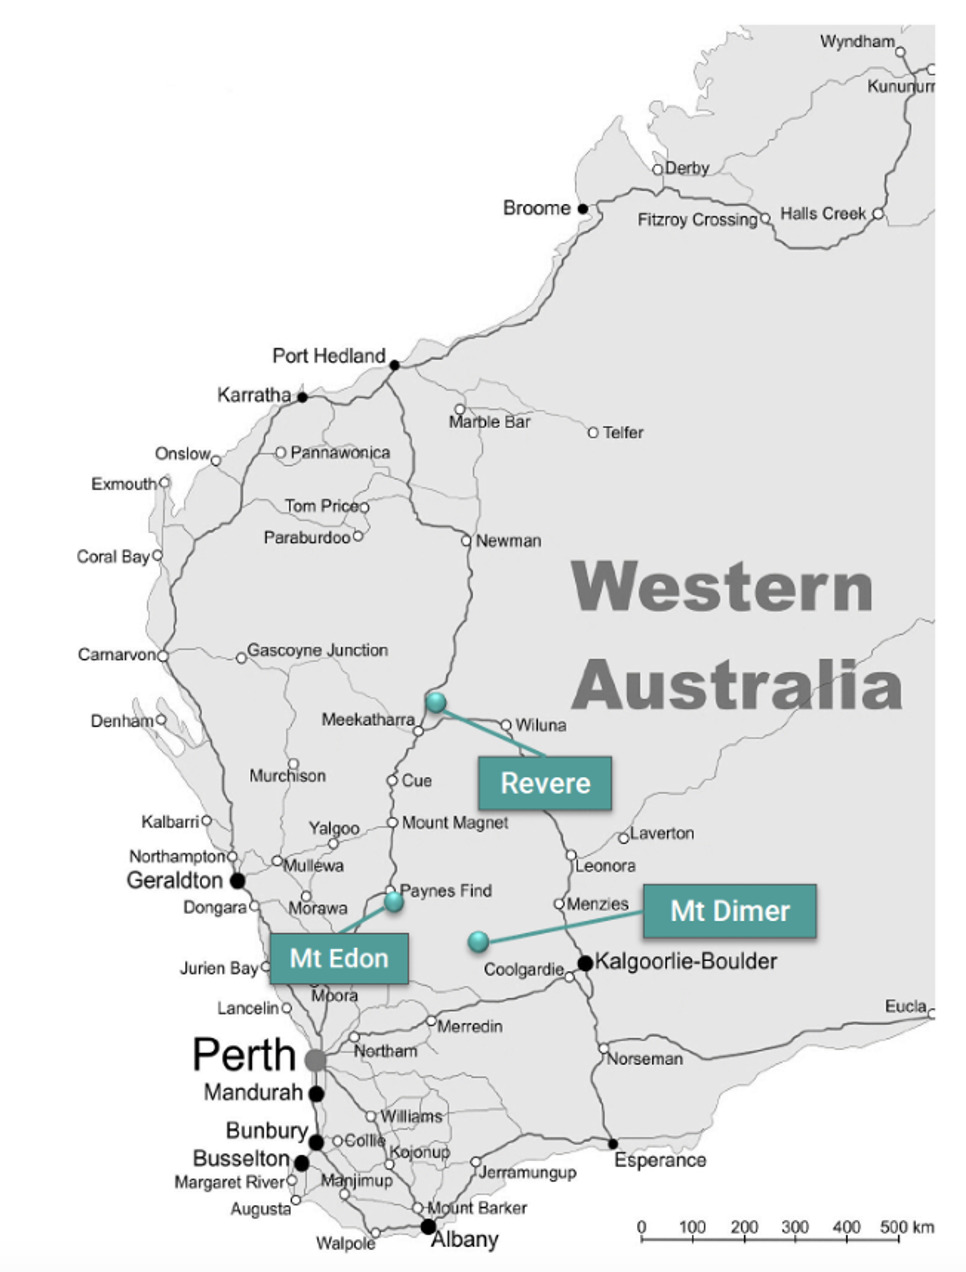
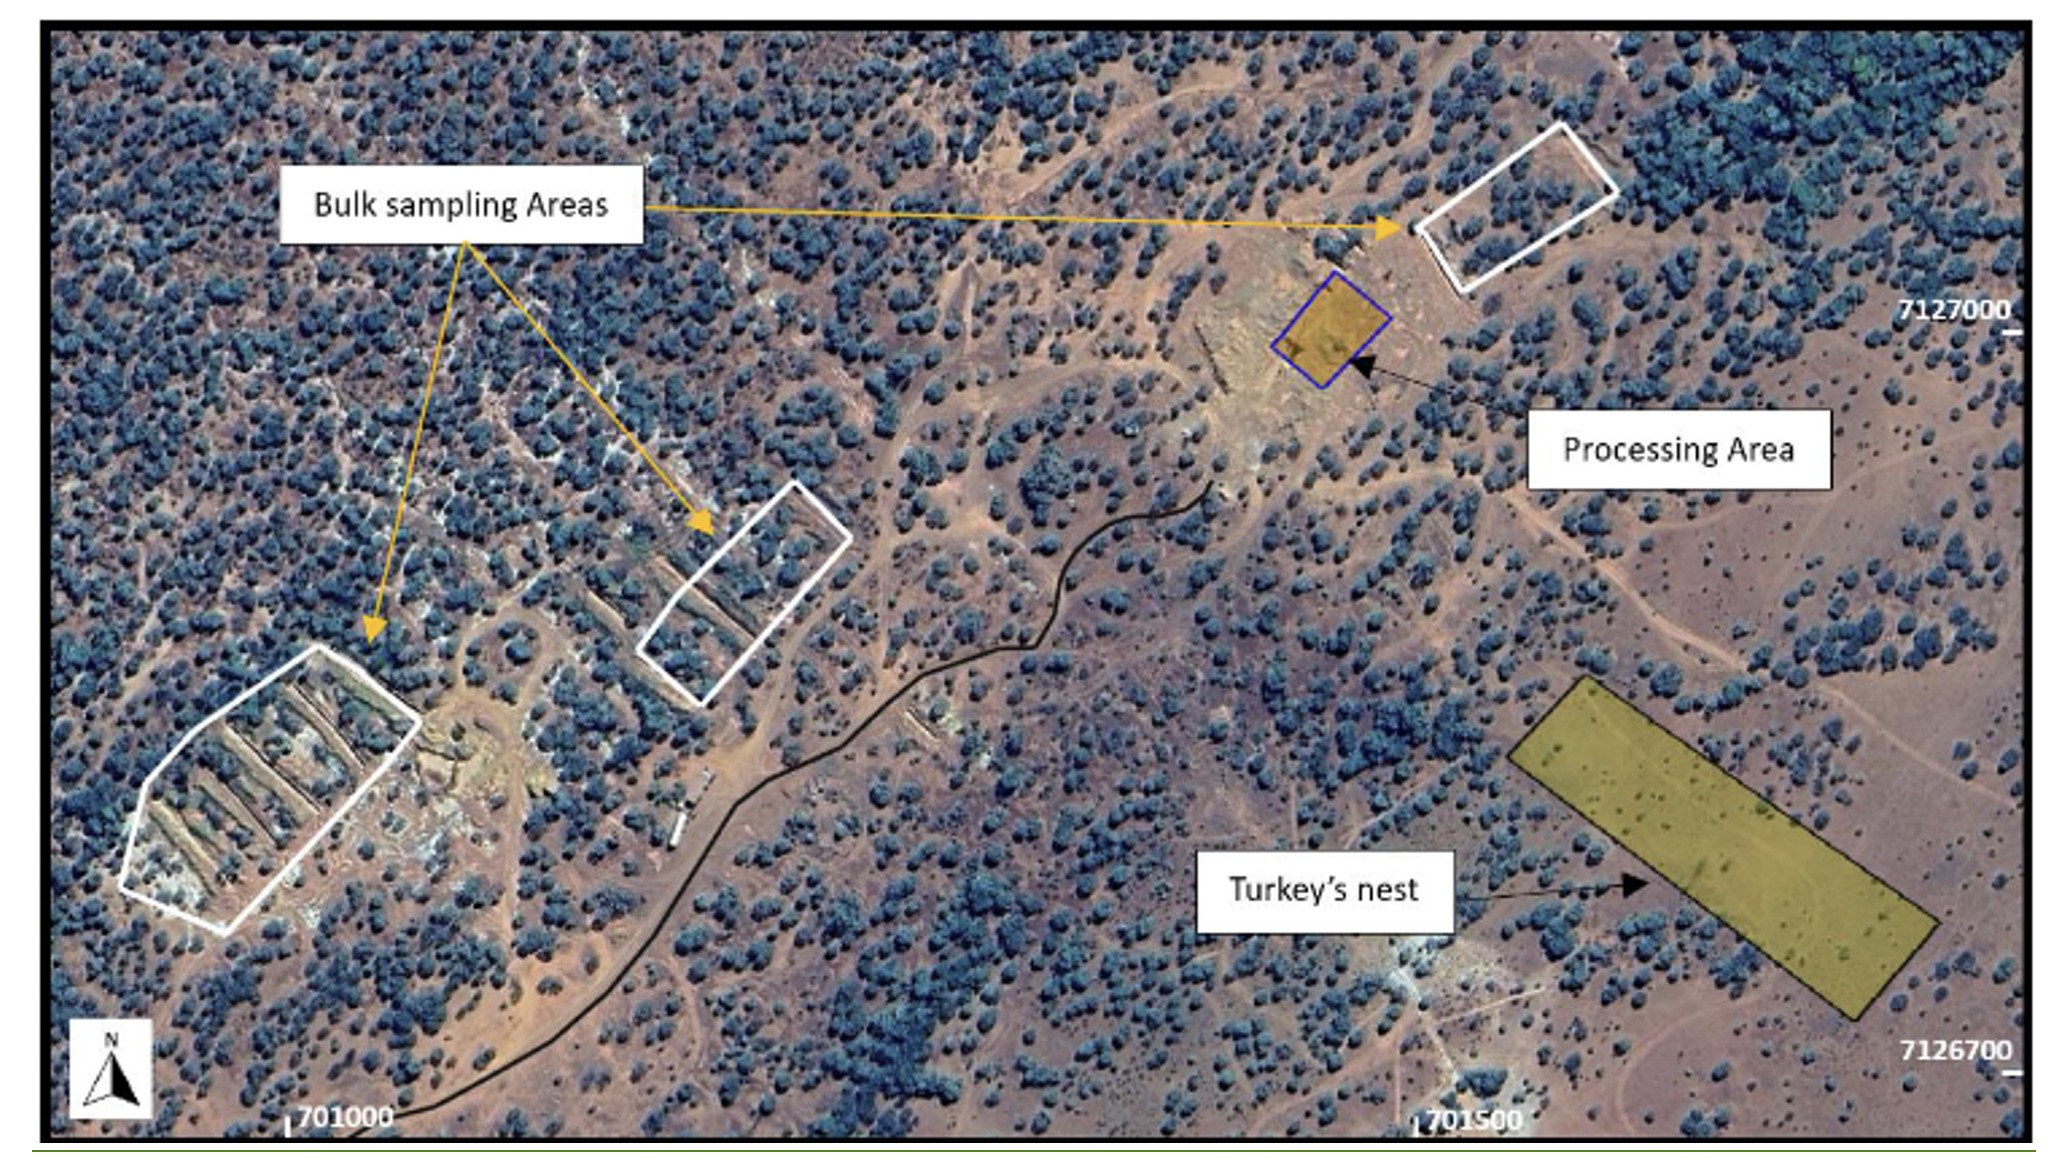
As predicted, the Company has delivered some excellent results at its Revere project (figures 11, 12, 13 and 14) with assays received from drill and blast works undertaken as
part of the bulk sampling program.
Better results included 1m samples returning;
- H12-8 – 97.0 g/t Au from 8m
- H13-9 – 46.8 g/t Au from 2m
- H13-9 – 81.4 g/t Au from 3m
- H13-8 – 38.7 g/t Au from 2m
- H33-8 – 21.0 g/t Au from 3m
This high-grade mineralisation according to EMC appears to support the case for a larger scale orogenic gold system. Well, that is a big call however this does look like a near-term high-grade gold operation that could be brought on-line very cheaply with ore crushing and processing scheduled for Q2-Q3 2024.

Equally important was the high-grade rubidium story at the Mt Edon Critical Minerals project where mineralisation is associated with irregular shaped felsic rubidium rich pegmatites that have intruded into a sequence of mafic, ultramafic, and sedimentary rocks.
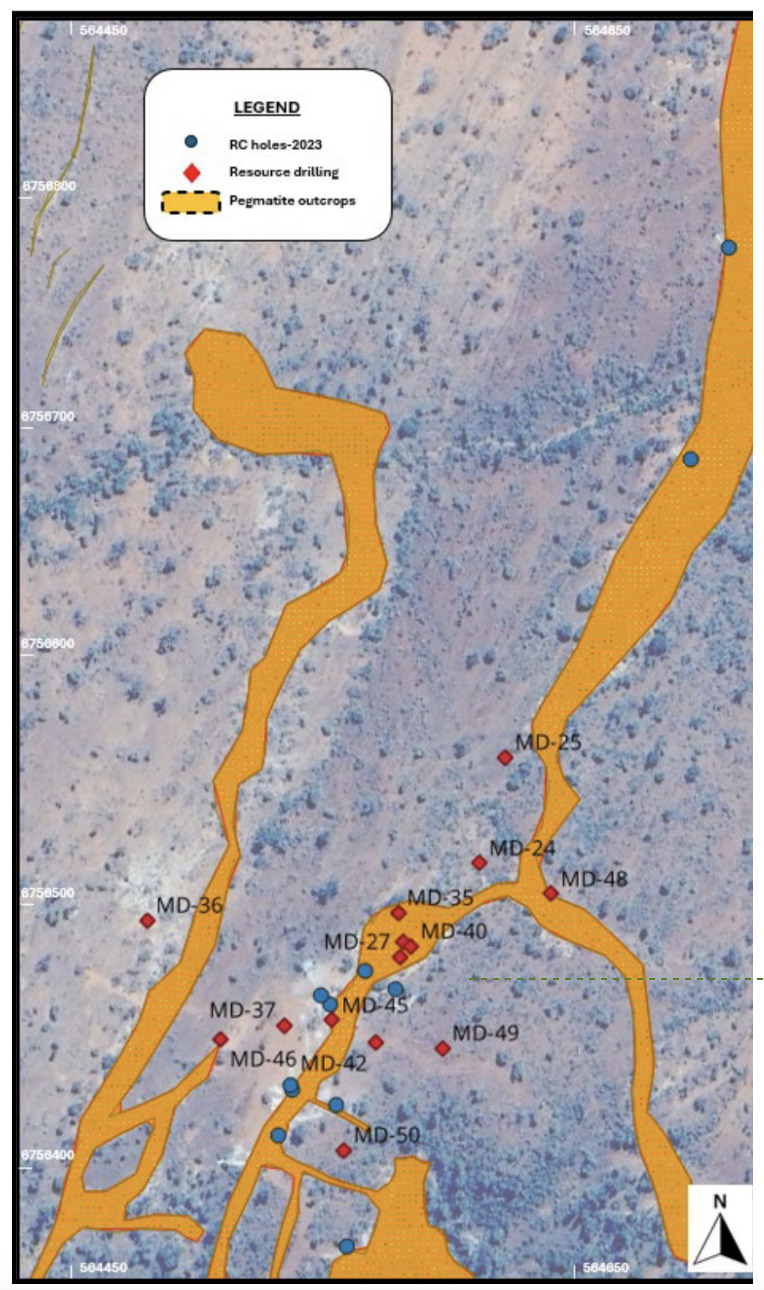
The Phase 1 resource drilling program (figure 14), which covered an area of 450m x 100m, wrapped up the other day according to the Company’s 28 May 2024 announcement with numerous broad pegmatite intersections including;
- MD 50 – 125m from surface to 125m
- MD 45 – 89m from 34m to 123m, plus 10m from 5m to 15m downhole
- MD 35 – 89m from 37m to EOH at 126m open
- MD 25 – 50m from 46m to 96m
- MD 24 – 40m from 8m to 48m
- MD 27 – 35m from 34m to 69m
Assay results are anticipated to be available in early July and a maiden Mineral Resource Estimate should follow soon after.
Good to see the Magnificent Caruso not holding back and referring to the project has an “emerging world class Rubidium deposit”.
I think EMC’s previously stated exploration target of 3.2 to 4.5Mt is a little on the conservative side but the grade of 0.23-0.35% and 0.08 to 0.12% lithium looks about right.
The Rubidium market (used in photocells among other things) is very small at approximately 2.5 tonnes per annum, and with the project capable of producing north of 200 tonnes per annum, the ability to grow Rubidium markets is critical to the project’s success.
I note the announcement also states that the Company has “initiated consulting arrangements with international industry marketing and business development advisers to assist in the commercialisation of the project”.
I am going to take a wild stab in the dark here and suggest that if more Rubidium is produced then the market could grow rapidly and therefore its very small market size could be a function of supply constraints, rather than a lack of demand.
We tend to think of commodities as more demand driven, and therefore prices respond to more demand than supply side pressures. More recently however, we have seen some extreme volatility in copper driven in large part by supply constraints.
While metallurgical testwork is ongoing at ECU I don’t see the outcome of this work as essential to the project’s success although it could significantly enhance project economics.
So just a recap for some of the Stockhead faithful who were asleep at the wheel back in April of this year:
An 80% recovery and 65% payability on a 100,000 tonnes @ an average grade of 0.30% could produce around 240 tonnes per annum, which would equate to payable metal of around US$150 million per annum with potentially very low capital and operating costs. This assumes a Rubidium price of around US$1,000,000/tonne.
There is a long way to go, and I hope I have this one right, but I think either Revere or Mr Edon could continue to drive the share price for the foreseeable future.
If we are looking for the share price to go off like the Magnificent Caruso’s Mt Etna in his ancestral homeland of Sicily, my money is on Mt Edon which, according to my extensive knowledge of Hebrew, means “place of pleasure”.
If I am wrong in my assessment here I am expecting a horse’s head at the end of my bed.
Mind you I have found worse things on there over the journey…
Guy Le Page is a director and responsible executive at Perth-based financial services provider RM Corporate Finance. A former geologist and experienced stockbroker, he is involved in a range of corporate initiatives from mergers and acquisitions, initial public offerings to valuations, consulting and corporate advisory roles.
He was head of research at Morgan Stockbroking Limited (Perth) prior to joining Tolhurst Noall as a Corporate Advisor in July 1998. Prior to entering the stockbroking industry, he spent 10 years as an exploration and mining geologist in Australia, Canada, and the United States.
The views, information, or opinions expressed in the interviews in this article are solely those of the interviewees and do not represent the views of Stockhead. Stockhead does not provide, endorse or otherwise assume responsibility for any financial product advice contained in this article.

UNLOCK INSIGHTS
Discover the untold stories of emerging ASX stocks.
Daily news and expert analysis, it's free to subscribe.
By proceeding, you confirm you understand that we handle personal information in accordance with our Privacy Policy.


