Tesla alone needs ~26pc of projected global nickel supply by 2030

Pic: Schroptschop / E+ via Getty Images
Electric vehicle trailblazer Tesla could need up to 1.15 million tonnes of nickel a year — almost 50 per cent of current global supply — by 2030 to meet ambitious production targets.
Tesla is jumping into cathode and battery cell production as part of plans to reduce battery costs by 50 per cent and scale production to 3,000 gigawatt-hours (GWh) by 2030.
That’s far greater than any major battery manufacturer has announced, according to Wood Mackenzie.
“We estimate the total planned cell manufacturing capacity, excluding Tesla, to be 1,300 GWh by 2030,” the consultancy says.
“Tesla’s announcement is more than twice the total global pipeline capacity.”
>>Scroll down for the performance of 54 ASX nickel stocks
Initial estimates from Benchmark Mineral Intelligence suggest that Tesla’s nickel-based battery cells could account for 1350GWh of this ambitious production figure.
That’s a lot of nickel.
Which is partly why this figure is unlikely to be achieved – even if global nickel production does reach a projected 4.3 million tonnes a year by 2030.
“Tesla would face stiff competition for supply from other cell producers ramping up their own nickel-rich battery capacity, and the stainless-steel industry,” Benchmark reports.
“Ultimately, from Benchmark’s perspective, the 3 TWh [terrawatt-hour] cell production figure is unlikely to be achieved when raw material availability and forecasted market demand are considered.”
Nonetheless, the figure is a statement of intent from Tesla, Benchmark says.
“Furthermore, Tesla’s proclamations undoubtedly help fuel the bullish outlook for nickel demand from the EV industry and underscores the necessity for further upstream investment in raw materials to help come some way towards meeting the potential exponential growth in demand.”
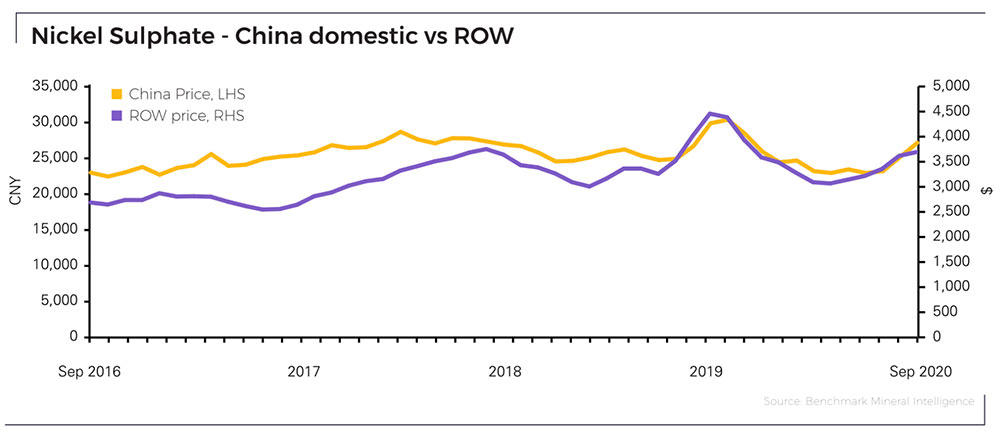
In September, the Benchmark Nickel Price Assessment recorded a 7.9 per cent and 2.1 per cent increase in domestic Chinese and international nickel sulphate prices, respectively.

This fairly healthy nickel price, plus that shout out from Elon Musk, has put the spotlight back on a number of hard-working ASX-listed nickel stocks.
Here’s how 54 ASX-listed nickel exposed stocks have performed over the last 12 months
Scroll or swipe to reveal table. Click headings to sort. Best viewed on a laptop:
| CODE | COMPANY | PRICE | 1 MONTH RETURN % | 6 MONTH RETURN % | 1 YEAR RETURN % | MARKET CAP |
|---|---|---|---|---|---|---|
| CHN | Chalice Gold Mines | 2.6 | 76 | 386 | 1200 | $ 793,361,532.60 |
| LEG | Legend Mining | 0.145 | -12 | 7 | 292 | $ 374,953,000.94 |
| MAN | Mandrake Resources | 0.065 | 12 | 550 | 282 | $ 17,241,960.34 |
| SBR | Sabre Resources | 0.011 | 57 | 1000 | 267 | $ 12,506,462.58 |
| SLZ | Sultan Resources | 0.22 | -12 | 193 | 261 | $ 12,018,186.50 |
| ARV | Artemis Resources | 0.13 | 65 | 519 | 233 | $ 151,178,580.50 |
| DEV | Devex Resources | 0.29 | 38 | 517 | 205 | $ 66,434,536.80 |
| BSX | Blackstone | 0.435 | -16 | 314 | 200 | $ 128,873,823.61 |
| STK | Strickland Metals | 0.073 | 22 | 387 | 192 | $ 31,775,715.60 |
| IPT | Impact Minerals | 0.024 | 0 | 300 | 167 | $ 40,875,261.60 |
| IPT | Impact Minerals | 0.024 | 0 | 300 | 167 | $ 40,875,261.60 |
| CZI | Cassini Resources | 0.22 | -4 | 219 | 159 | $ 97,147,853.44 |
| CTM | Centaurus Metals | 0.51 | 0 | 386 | 143 | $ 159,670,008.40 |
| CNJ | Conico | 0.018 | 29 | 200 | 125 | $ 9,373,392.56 |
| RXL | Rox Resources | 0.054 | -18 | 200 | 116 | $ 106,383,080.08 |
| LTR | Liontown Resources | 0.21 | 56 | 176 | 112 | $ 327,663,858.37 |
| AQD | Ausquest | 0.03 | -3 | 173 | 100 | $ 20,319,980.43 |
| PGM | Platina Resources | 0.047 | -8 | 194 | 81 | $ 19,396,151.66 |
| ESR | Estrella Resources | 0.014 | -13 | 133 | 75 | $ 10,285,069.16 |
| S2R | S2 Resources | 0.285 | 63 | 256 | 73 | $ 79,022,250.65 |
| ALY | Alchemy Resources | 0.02 | 11 | 71 | 57 | $ 13,444,869.06 |
| PM1 | Pure Minerals | 0.028 | 65 | 180 | 56 | $ 19,104,749.95 |
| VMC | Venus Metals | 0.26 | 7 | 75 | 54 | $ 39,280,457.58 |
| GAL | Galileo Mining | 0.2 | -43 | 18 | 54 | $ 29,335,747.03 |
| OZL | OZ Minerals | 13.8 | -7 | 96 | 48 | $ 4,344,456,564.00 |
| MOH | Moho Resources | 0.11 | -4 | 62 | 47 | $ 7,648,476.77 |
| BOA | Boadicea Resources | 0.29 | 14 | 32 | 45 | $ 16,122,766.34 |
| MCR | Mincor Resources | 0.83 | -1 | 68 | 42 | $ 360,152,226.72 |
| CWX | Carawine Resources | 0.25 | 18 | 60 | 24 | $ 20,349,906.46 |
| AVL | Australian Vanadium | 0.013 | 8 | 86 | 18 | $ 35,081,588.27 |
| LIT | Lithium Australia | 0.051 | -6 | 28 | 13 | $ 40,405,542.34 |
| ARL | Ardea Resources | 0.465 | -20 | 107 | 9 | $ 56,136,260.70 |
| NIC | Nickel Mines | 0.675 | -8 | 46 | 8 | $ 1,393,905,265.51 |
| CZN | Corazon | 0.0025 | 25 | 29 | 3 | $ 6,506,718.29 |
| GBR | Great Boulder Resources | 0.051 | -7 | 89 | 0 | $ 9,214,928.73 |
| POS | Poseidon Nickel | 0.052 | -13 | 63 | 0 | $ 137,420,495.21 |
| PUR | Pursuit Minerals | 0.01 | -41 | 150 | 0 | $ 4,801,093.16 |
| ATM | Aneka Tambang | 1 | 0 | 0 | 0 | $ 1,303,649.00 |
| BHP | BHP Group | 36.1 | -6 | 21 | -1 | $ 103,458,300,957.28 |
| CLQ | Clean Teq | 0.28 | 56 | 107 | -3 | $ 197,811,954.33 |
| AZS | Azure Minerals | 0.215 | 26 | 264 | -7 | $ 44,805,634.15 |
| BUX | Buxton Resources | 0.08 | -30 | 82 | -13 | $ 10,204,157.40 |
| G88 | Golden Mile Resources | 0.06 | 9 | 140 | -17 | $ 7,381,099.68 |
| AOU | Auroch Minerals | 0.069 | -15 | 90 | -22 | $ 15,493,632.42 |
| SRI | Sipa Resources | 0.072 | -17 | 50 | -25 | $ 12,573,913.90 |
| IGO | IGO | 4.21 | -6 | -3 | -33 | $ 2,404,543,928.38 |
| RFR | Rafaella Resources | 0.08 | 0 | 60 | -33 | $ 7,246,045.68 |
| SGQ | St George Mining | 0.105 | -9 | 35 | -36 | $ 49,845,418.82 |
| ESS | Essential Metals | 0.11 | 13 | 22 | -39 | $ 17,350,789.11 |
| AUZ | Australian Mines | 0.0145 | -15 | 81 | -40 | $ 51,498,900.05 |
| HNR | Hannans | 0.006 | -14 | 20 | -40 | $ 13,915,681.77 |
| PNN | PepinNini Minerals | 0.145 | 42 | 63 | -46 | $ 2,930,772.63 |
| PAN | Panoramic Resources | 0.096 | 13 | -1 | -59 | $ 190,735,002.37 |
| MLX | Metals X | 0.07 | -16 | 4 | -62 | $ 62,601,358.62 |
Related Topics
SUBSCRIBE
Get the latest breaking news and stocks straight to your inbox.
It's free. Unsubscribe whenever you want.
By proceeding, you confirm you understand that we handle personal information in accordance with our Privacy Policy.


