High Voltage: Lithium prices jump, but supply chain scares in Chile and China may just be a hiccup

Lithium prices jumped this week as news of supply disruptions spread. Pic: Getty Images
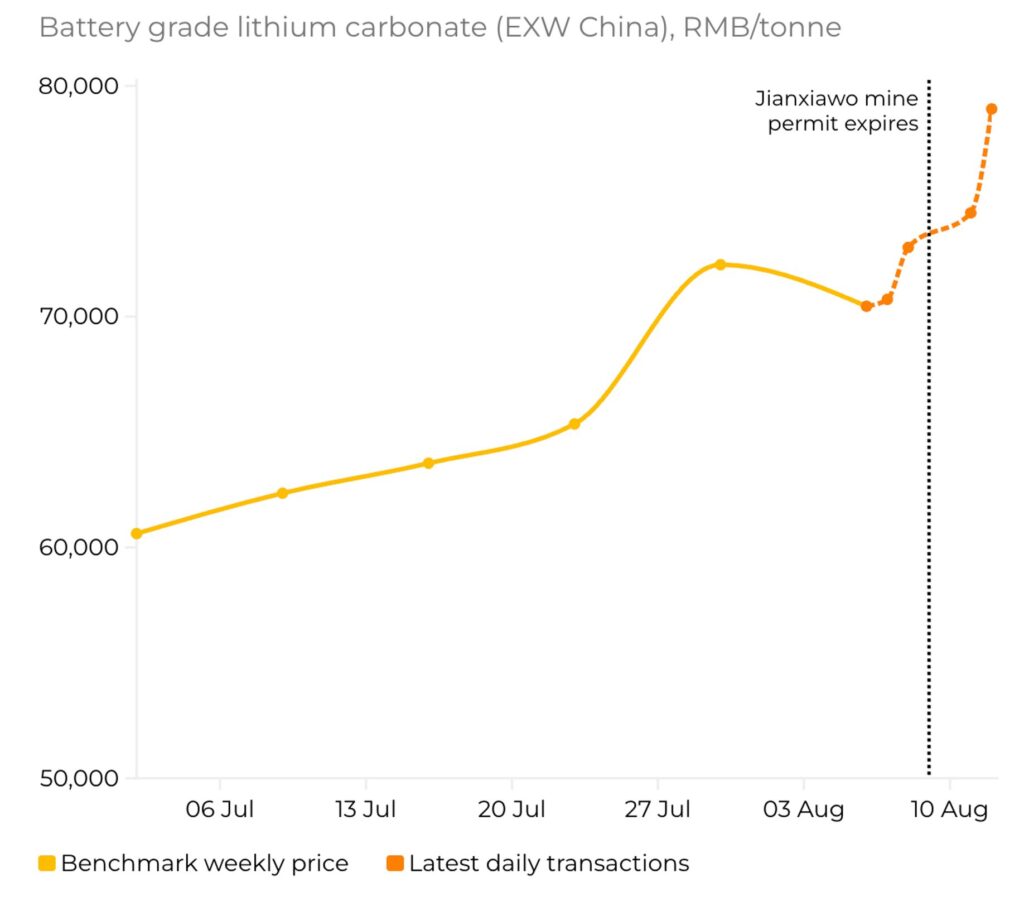
- Lithium prices rise after Albemarle suspends Chilean operations due to an explosion
- China’s CATL also recently closed the Jianxiawo mine impacting sentiment further
- Benchmark Minerals Intelligence says price moves don’t reflect shift in market fundamentals
Our High Voltage column wraps all the news driving ASX stocks with exposure to lithium, cobalt, graphite, nickel, rare earths, and vanadium.
Frailties in the lithium supply chain have been put on display for the second time in a week after Albemarle suspended operations in Chile following an acid tank explosion at a chemical plant in La Negra.
The news sent prices climbing as high as 80,000–87,000 RMB/tonne ($11,100–12,100) for EXW China lithium carbonate, according to Benchmark Minerals Intelligence. It came hot on the heels of the suspension of CATL’s Jianxiawo mine late last week, with supply side issues sending speculative interest in both hard rock and chemical lithium products sharply higher.
The actual impact on production from Albemarle’s Chilean salt lakes appears to be limited to one of three production lines which were forced offline for several days, and the US giant says its processing facility is operating as normal, with no sales to be impacted.
Albemarle is projected to produce 67,000 tonnes LCE from its Chilean operations in 2025.
But markets are anxious at the moment, with news of production issues driving futures in the key Guangzhou exchange higher.
Benchmark estimates CATL’s Jianxiawo lepidolite operation produces around 3% of the world’s lithium raw material supply, making the suspension a bellwether for sentiment on lithium pricing, which has been crunched by a supply flood following 2022’s price boom.
It’s the second time the mine has been shut in less than a year. This time it will reportedly last for at least three months and it’s due to non-compliance with permitting requirements.
“So far procurement activity has been slow as participants evaluate the impacts of recent news of supply disruptions,” BMI said.
“Indeed, with significant inventories existing in China – estimated by Benchmark at roughly 130,000 tonne LCE as of July – this week’s price movements are primarily being driven by sentiment and reflect the speculative nature of lithium trading in China, rather than signalling a significant shift in market fundamentals.”
Battery Metals Winners and Losers
Here’s how a basket of ASX stocks with exposure to lithium, cobalt, graphite, nickel, rare earths, magnesium, manganese and vanadium is performing >>>
Code Company Price % Week % Month % Six Month % Year Market Cap XTC XTC Lithium Limited 0.2 19900% 19900% 19900% 19900% $17,528,272 OD6 Od6Metalsltd 0.09 233% 210% 84% 105% $10,911,821 BMM Bayanminingandmin 0.145 101% 142% 222% 222% $14,196,703 ETM Energy Transition 0.082 86% 71% 26% 242% $139,581,306 LIN Lindian Resources 0.225 80% 142% 125% 96% $254,435,781 VRX VRX Silica Ltd 0.13 51% 60% 271% 294% $97,149,427 AGY Argosy Minerals Ltd 0.041 46% 52% 58% 11% $62,972,758 KNG Kingsland Minerals 0.165 43% 112% 38% -3% $10,521,332 CRR Critical Resources 0.007 40% 75% 40% 0% $19,390,598 KTA Krakatoa Resources 0.015 36% 36% 50% 50% $10,851,876 ZEU Zeus Resources Ltd 0.019 36% 0% 138% 111% $14,348,733 ASR Asra Minerals Ltd 0.002 33% 0% -33% -60% $8,000,396 AXE Archer Materials 0.36 31% 36% -1% 53% $86,647,984 CXO Core Lithium 0.125 30% 19% 40% 36% $257,161,865 VTM Victory Metals Ltd 1.73 30% 92% 381% 368% $213,491,394 SLM Solismineralsltd 0.11 29% 33% -4% -8% $15,518,820 LU7 Lithium Universe Ltd 0.009 29% 29% 13% -24% $9,687,837 MTC Metalstech Ltd 0.18 29% 38% 44% -8% $38,859,618 PLS Pilbara Min Ltd 2.19 28% 41% -2% -23% $6,886,600,250 GT1 Greentechnology 0.041 28% 78% -33% -37% $20,432,312 GL1 Globallith 0.245 26% 36% 2% 7% $65,433,031 BYH Bryah Resources Ltd 0.005 25% -29% 25% 0% $5,142,663 EMT Emetals Limited 0.005 25% 67% 25% 25% $5,100,000 S2R S2 Resources 0.086 25% 25% 23% -18% $45,132,214 KZR Kalamazoo Resources 0.13 24% 44% 60% 103% $30,760,046 GW1 Greenwing Resources 0.037 23% 42% 3% 3% $11,316,817 GED Golden Deeps 0.032 23% 45% 33% 7% $5,668,022 FRB Firebird Metals 0.16 23% 52% 67% 60% $19,930,596 ARU Arafura Rare Earths 0.22 22% 13% 52% 38% $517,509,025 EVR Ev Resources Ltd 0.011 22% 0% 120% 167% $24,502,537 PNT Panthermetalsltd 0.011 22% 10% 57% -56% $3,309,950 OCN Oceanalithiumlimited 0.088 21% 42% 226% 211% $14,278,306 RAS Ragusa Minerals Ltd 0.024 20% 71% 20% 50% $4,276,771 AZI Altamin Limited 0.024 20% 33% -4% -20% $13,788,069 CRI Critica Ltd 0.018 20% 20% 0% 0% $48,567,279 IDA Indiana Resources 0.043 19% 17% 39% 107% $27,680,496 MNB Minbos Resources Ltd 0.062 19% 41% 38% -13% $61,428,126 GCM Green Critical Min 0.0355 18% 54% 109% 1675% $92,448,312 DM1 Desert Metals 0.026 18% 24% 13% 13% $11,499,451 LML Lincoln Minerals 0.009 18% 45% 57% 89% $17,020,558 BM8 Battery Age Minerals 0.079 18% 49% 4% -25% $10,170,722 SYA Sayona Mining Ltd 0.027 17% 50% 17% 4% $311,668,992 EGR Ecograf Limited 0.34 17% 6% 196% 251% $138,540,705 M79 Mammothmineralsltd 0.11 17% 41% 69% 53% $49,008,077 RGL Riversgold 0.0035 17% -13% -30% -13% $6,734,850 GRL Godolphin Resources 0.014 17% 27% -18% 8% $6,284,226 ZNC Zenith Minerals Ltd 0.043 16% 30% 2% -2% $22,766,586 IGO IGO Limited 5.44 16% 18% 12% 8% $4,043,810,121 LPM Lithium Plus 0.08 16% 31% 31% -18% $9,963,000 INR Ioneer Ltd 0.1275 16% 21% -23% 2% $346,030,860 CMO Cosmometalslimited 0.022 16% -4% 12% -12% $8,721,230 BOA BOA Resources Ltd 0.023 15% 28% 5% 15% $2,837,115 LYC Lynas Rare Earths 13.66 15% 41% 97% 124% $12,750,140,865 WC8 Wildcat Resources 0.195 15% 18% -11% -19% $254,024,003 AAJ Aruma Resources Ltd 0.008 14% 0% -27% -47% $2,623,524 SMX Strata Minerals 0.016 14% 33% -54% -30% $3,917,635 TLG Talga Group Ltd 0.525 14% 31% 12% 17% $225,371,865 PGD Peregrine Gold 0.325 14% 71% 160% 76% $27,999,755 LSR Lodestar Minerals 0.019 14% 76% 76% -52% $6,778,305 TMB Tambourahmetals 0.041 14% 95% 46% -9% $6,784,518 LKE Lake Resources 0.042 14% 35% 8% 27% $79,512,291 VR8 Vanadium Resources 0.042 14% 121% 56% -7% $25,613,385 LLM Loyal Metals Ltd 0.21 14% 0% 150% 121% $27,456,277 SRL Sunrise 1.345 14% 0% 364% 213% $158,873,759 KM1 Kalimetalslimited 0.17 13% 62% 55% 3% $14,084,068 MRR Minrex Resources Ltd 0.009 13% 6% 13% 13% $9,763,808 WA1 Wa1Resourcesltd 19.34 12% 18% 44% 42% $1,322,194,108 ARR American Rare Earths 0.365 12% 40% 24% 38% $207,957,871 LNRDB Lanthanein Resources 0.037 12% 23% -45% -45% $3,465,891 LNRDB Lanthanein Resources 0.037 12% 23% -45% -45% $3,465,891 PLL Piedmont Lithium Inc 0.14 12% 33% 12% 27% $67,063,990 M24 Mamba Exploration 0.0145 12% 4% 4% 45% $4,279,901 PMT Patriotbatterymetals 0.49 11% 48% 61% -2% $269,613,509 BCA Black Canyon Limited 0.35 11% 49% 400% 393% $45,210,823 WCN White Cliff Min Ltd 0.0255 11% 11% 34% 70% $58,521,268 MIN Mineral Resources. 36.72 11% 34% 8% -24% $7,027,505,279 FGR First Graphene Ltd 0.042 11% 50% -36% -15% $31,155,815 TLM Talisman Mining 0.16 10% 10% -18% -30% $30,131,256 CHR Charger Metals 0.055 10% 0% -5% -7% $4,258,114 AVL Aust Vanadium Ltd 0.011 10% 38% -15% -31% $94,981,239 IMI Infinitymining 0.011 10% 0% 10% -21% $4,653,174 NVX Novonix Limited 0.495 10% 25% -8% -20% $320,504,477 RON Roninresourcesltd 0.175 9% 30% -10% 52% $7,065,627 NTU Northern Min Ltd 0.036 9% 16% 112% 29% $284,143,298 MQR Marquee Resource Ltd 0.012 9% 33% -8% 33% $6,453,911 DRE Dreadnought Resources Ltd 0.012 9% 20% 9% -25% $60,954,000 WR1 Winsome Resources 0.18 9% -22% -58% -62% $45,134,163 A4N Alpha Hpa Ltd 0.9525 9% 9% 4% 14% $1,091,573,052 AR3 Austrare 0.125 9% 108% 57% 74% $26,547,516 EV1 Evolutionenergy 0.013 8% -13% -19% -52% $4,714,456 ILU Iluka Resources 6.26 8% 28% 32% 12% $2,668,201,349 ALK Alkane Resources Ltd 0.835 8% 27% 34% 92% $1,119,199,684 CLA Celsius Resource Ltd 0.007 8% 0% -22% -42% $21,948,419 GLN Galan Lithium Ltd 0.145 7% 4% 21% 24% $139,772,833 HRE Heavy Rare Earths 0.044 7% -10% 76% 43% $9,153,491 BKT Black Rock Mining 0.03 7% 7% 0% -46% $39,950,597 AM7 Arcadia Minerals 0.03 7% 67% 43% -23% $3,521,503 FG1 Flynngold 0.03 7% -9% 3% 7% $11,739,494 MEI Meteoric Resources 0.15 7% 7% 85% 43% $396,140,132 CHN Chalice Mining Ltd 1.7175 7% 4% 44% 75% $655,642,921 1MC Morella Corporation 0.016 7% 7% -20% -52% $5,710,649 ADV Ardiden Ltd 0.165 6% 3% 3% 32% $10,315,388 VML Vital Metals Limited 0.1 6% 5% 0% -20% $11,554,128 INF Infinity Metals Ltd 0.017 6% 13% -37% -65% $8,150,887 EFE Eastern Resources 0.034 6% 10% 26% -24% $4,287,058 LTR Liontown Resources 0.8975 6% 11% 38% 11% $2,458,554,128 ASL Andean Silver 1.48 6% 24% 32% 118% $263,511,470 SRZ Stellar Resources 0.018 6% 0% 20% 20% $37,435,510 PSC Prospect Res Ltd 0.19 6% 3% 104% 90% $129,608,628 PFE Pantera Lithium 0.019 6% -17% 0% -5% $9,475,674 E25 Element 25 Ltd 0.29 5% 29% 4% 38% $68,583,720 MEK Meeka Metals Limited 0.1475 5% 9% 28% 189% $437,355,776 HAS Hastings Tech Met 0.3 5% 7% -5% 5% $62,378,537 EMH European Metals Hldg 0.2 5% 25% 48% -5% $43,563,388 NH3 Nh3Cleanenergyltd 0.063 5% 24% 232% 294% $39,409,072 STM Sunstone Metals Ltd 0.021 5% 45% 250% 163% $126,555,754 ORN Orion Minerals Ltd 0.0105 5% -5% -25% -30% $72,816,361 NST Northern Star 17.98 5% 11% -2% 26% $25,399,594,090 BHP BHP Group Limited 41.86 5% 6% 2% 3% $211,821,155,967 RNU Renascor Res Ltd 0.067 5% 6% 24% -17% $170,391,342 PEK Peak Rare Earths Ltd 0.335 5% 8% 183% 96% $146,382,577 PEK Peak Rare Earths Ltd 0.335 5% 8% 183% 96% $146,382,577 JMS Jupiter Mines. 0.235 4% 9% 47% 9% $441,234,396 PTR Petratherm Ltd 0.36 4% 11% 44% 1614% $121,315,170 WIN WIN Metals 0.025 4% 39% 39% 25% $13,751,460 PAT Patriot Resourcesltd 0.051 4% -14% 16% 2% $8,416,145 SFR Sandfire Resources 11.69 4% 6% 8% 42% $5,380,322,199 NIC Nickel Industries 0.7575 4% 3% 0% -3% $3,299,111,265 LOT Lotus Resources Ltd 0.16 3% -3% -22% -33% $367,637,836 NWC New World Resources 0.068 3% 3% 240% 258% $243,442,936 KOB Kobaresourceslimited 0.034 3% 10% -49% -67% $6,754,834 A11 Atlantic Lithium 0.17 3% 13% -17% -39% $114,369,307 EG1 Evergreenlithium 0.034 3% 13% -58% -26% $7,999,101 SGQ St George Min Ltd 0.038 3% 6% 0% 19% $111,020,834 RAG Ragnar Metals Ltd 0.019 3% 0% 12% -5% $8,531,748 VHM Vhmlimited 0.19 3% -3% -42% -56% $49,446,141 TOR Torque Met 0.2875 3% 92% 209% 161% $147,441,601 TKM Trek Metals Ltd 0.08 3% -17% 220% 105% $48,097,240 EUR European Lithium Ltd 0.083 2% 28% 60% 98% $119,950,062 ARL Ardea Resources Ltd 0.415 2% -2% 5% -8% $87,321,360 RIO Rio Tinto Limited 115.73 2% 4% -4% 0% $43,744,118,658 DYM Dynamicmetalslimited 0.26 2% 2% -10% 79% $12,807,428 IPX Iperionx Limited 6.1 2% 22% 45% 200% $1,976,804,174 GBR Greatbould Resources 0.059 2% -5% -6% 23% $55,186,412 SYR Syrah Resources 0.295 2% 9% 24% 41% $355,688,065 CDT Castle Minerals 0.059 2% -16% -34% -51% $7,076,584 SYR Syrah Resources 0.295 2% 9% 24% 41% $355,688,065 BC8 Black Cat Syndicate 0.895 2% 15% 23% 167% $622,695,811 PNN Power Minerals Ltd 0.065 2% 12% -29% -28% $11,155,762 AEE Aura Energy 0.1625 2% 8% 30% 30% $142,520,023 DVP Develop Global Ltd 4.295 2% -7% 50% 114% $1,412,080,449 A8G Australasian Metals 0.072 1% 7% 4% -17% $4,052,281 SVM Sovereign Metals 0.74 1% 5% -8% 19% $491,673,414 S32 South32 Limited 3.005 1% -3% -16% 2% $13,781,123,470 AQD Ausquest Limited 0.043 1% -16% 2% 304% $59,877,222 ASM Ausstratmaterials 0.57 1% -2% 24% 24% $129,655,055 PVW PVW Res Ltd 0.019 0% 58% 46% -24% $3,779,191 QXR Qx Resources Limited 0.004 0% -20% 0% -33% $5,241,315 AZL Arizona Lithium Ltd 0.008 0% 33% -20% -50% $37,662,201 RIL Redivium Limited 0.004 0% 0% 0% 100% $13,609,422 COB Cobalt Blue Ltd 0.052 0% -5% -4% -21% $23,131,620 LPD Lepidico Ltd 0.002 0% 0% 0% 0% $17,178,371 MRD Mount Ridley Mines 0.0025 0% 25% 25% -75% $1,946,223 RLC Reedy Lagoon Corp. 0.002 0% 0% -33% -33% $1,553,413 STK Strickland Metals 0.14 0% -10% 94% 33% $316,730,372 MLX Metals X Limited 0.6 0% -9% 20% 60% $527,402,965 MNS Magnis Energy Tech 0.042 0% 0% 0% 0% $50,378,922 JLL Jindalee Lithium Ltd 0.475 0% 14% 150% 76% $36,740,589 SBR Sabre Resources 0.01 0% 11% 11% -23% $3,747,388 VRC Volt Resources Ltd 0.004 0% 14% 33% 33% $18,739,398 SRI Sipa Resources Ltd 0.016 0% -6% 33% 7% $8,327,966 PGM Platina Resources 0.021 0% 0% 0% 0% $13,086,787 CWX Carawine Resources 0.083 0% -13% -21% -9% $19,598,412 TKL Traka Resources 0.002 0% 100% 0% 100% $4,844,278 LIT Livium Ltd 0.0105 0% 17% -19% -48% $17,021,071 ASN Anson Resources Ltd 0.11 0% 69% 80% 16% $159,474,702 TVN Tivan Limited 0.11 0% 29% -4% 120% $218,433,638 LEL Lithenergy 0.37 0% 0% 0% 4% $41,440,581 RMX Red Mount Min Ltd 0.008 0% -11% 0% -47% $4,643,996 MRC Mineral Commodities 0.026 0% 0% 0% 0% $25,596,288 QPM QPM Energy Limited 0.032 0% -3% -44% -6% $98,367,053 LEG Legend Mining 0.007 0% -22% -22% -36% $20,401,340 G88 Golden Mile Res Ltd 0.008 0% -11% -20% -20% $4,353,983 WKT Walkabout Resources 0.095 0% 0% 0% -4% $63,769,838 TON Triton Min Ltd 0.006 0% 20% 0% -40% $9,410,332 CNJ Conico Ltd 0.007 0% 0% 0% -30% $1,905,020 SLZ Sultan Resources Ltd 0.006 0% 0% -25% -25% $1,566,501 AX8 Accelerate Resources 0.008 0% 0% -20% -20% $6,537,510 AS2 Askarimetalslimited 0.011 0% 22% -8% -48% $4,462,378 EMS Eastern Metals 0.01 0% 0% -17% -58% $1,394,262 GSM Golden State Mining 0.008 0% 14% -20% -33% $2,234,965 CTN Catalina Resources 0.004 0% 0% 22% 42% $9,704,076 TEM Tempest Minerals 0.007 0% 40% 17% -30% $7,712,565 OB1 Orbminco Limited 0.001 0% 0% -20% -60% $3,402,568 LMG Latrobe Magnesium 0.016 0% 78% -6% -53% $42,151,986 KOR Korab Resources 0.008 0% 0% 0% 0% $2,936,400 CMX Chemxmaterials 0.026 0% 0% 0% -28% $33,545,803 OMH OM Holdings Limited 0.3 0% -5% -17% -26% $229,877,040 EMN Euromanganese 0.17 0% 0% -21% -23% $9,284,626 ENT Enterprise Metals 0.003 0% 0% 0% 0% $4,113,952 ENV Enova Mining Limited 0.007 0% 0% -22% -13% $11,053,200 RBX Resource B 0.034 0% 6% 13% -15% $3,916,272 AKN Auking Mining Ltd 0.006 0% 33% 20% -50% $4,128,698 RR1 Reach Resources Ltd 0.011 0% 22% -4% 0% $9,618,745 AVW Avira Resources Ltd 0.007 0% 0% -65% -65% $1,610,000 NWM Norwest Minerals 0.012 0% -8% 8% -42% $12,361,283 THR Thor Energy PLC 0.01 0% 11% -9% -38% $7,329,898 YAR Yari Minerals Ltd 0.011 0% 0% 175% 175% $7,584,102 ODE Odessa Minerals Ltd 0.007 0% 8% 17% 133% $12,796,260 CLZ Classic Min Ltd 0.001 0% 0% 0% 0% $3,017,699 M2R Miramar 0.004 0% 0% 33% -33% $3,987,293 TAR Taruga Minerals 0.01 0% 25% 0% 43% $6,423,787 ABX ABX Group Limited 0.043 0% 13% 16% 0% $10,075,260 RR1 Reach Resources Ltd 0.011 0% 22% -4% 0% $9,618,745 AOA Ausmon Resorces 0.002 0% 0% 0% -33% $2,622,427 WC1 Westcobarmetals 0.019 0% 0% 27% -36% $4,167,590 DLI Delta Lithium 0.165 0% -11% -3% -20% $121,929,405 PBL Parabellumresources 0.056 0% 12% 30% 47% $3,488,800 L1M Lightning Minerals 0.039 0% -3% -52% -26% $4,634,275 OM1 Omnia Metals Group 0.012 0% 0% -85% -85% $2,605,100 LLL Leolithiumlimited 0.332997 0% 0% 0% 0% $401,204,047 WSR Westar Resources 0.006 0% 20% -50% -14% $2,392,349 ICL Iceni Gold 0.064 0% -2% -20% 49% $21,971,289 LCY Legacy Iron Ore 0.009 0% 13% -10% -42% $87,858,383 AMD Arrow Minerals 0.02 0% 0% -43% -67% $17,555,332 AYM Australia United Min 0.002 0% 0% -33% -33% $3,685,155 CUL Cullen Resources 0.006 0% 20% 20% -14% $4,160,411 GTE Great Western Exp. 0.012 0% 0% -60% -60% $6,813,095 HWK Hawk Resources. 0.017 0% -23% -35% -36% $4,334,871 SER Strategic Energy 0.006 0% 20% 0% -65% $5,020,150 SFM Santa Fe Minerals 0.245 0% 17% 562% 581% $17,840,603 ATM Aneka Tambang 1.13 -1% 2% 16% 10% $1,473,123 DEV Devex Resources Ltd 0.079 -1% -12% 3% -61% $34,893,563 BSX Blackstone Ltd 0.069 -1% -7% 30% 136% $118,278,699 PUR Pursuit Minerals 0.064 -2% -10% -12% -57% $7,063,044 VUL Vulcan Energy 3.76 -2% 8% -7% -4% $867,387,970 QGL Quantum Graphite 0.485 -2% 0% -3% -13% $167,319,480 WMG Western Mines 0.23 -2% -10% 77% -15% $22,353,319 SUM Summitminerals 0.043 -2% -16% -61% -80% $3,897,347 ESR Estrella Res Ltd 0.039 -3% -13% 8% 680% $78,137,761 FML Focus Minerals Ltd 0.37 -3% 1% 76% 185% $106,026,699 HAV Havilah Resources 0.18 -3% 0% -14% 0% $62,066,133 MHK Metalhawk. 0.175 -3% -57% -48% 103% $21,593,699 ARN Aldoro Resources 0.325 -3% -8% 16% 333% $70,761,376 EVG Evion Group NL 0.03 -3% 58% 25% 20% $13,047,599 GAL Galileo Mining Ltd 0.145 -3% -3% 7% -9% $28,655,614 LRV Larvottoresources 0.725 -3% 2% -13% 400% $338,889,670 SVY Stavely Minerals Ltd 0.014 -3% 0% -26% -39% $9,516,589 HAW Hawthorn Resources 0.051 -4% -7% 11% -15% $17,085,796 FBM Future Battery 0.025 -4% 14% 14% 25% $16,866,526 HMX Hammer Metals Ltd 0.025 -4% -14% -24% -32% $22,193,968 EMC Everest Metals Corp 0.115 -4% -21% -28% -8% $24,654,438 MHC Manhattan Corp Ltd 0.023 -4% 15% 15% 15% $12,819,593 CY5 Cygnus Metals Ltd 0.087 -4% 0% -36% 55% $92,503,809 RVT Richmond Vanadium 0.065 -4% -13% -57% -79% $14,458,297 REE Rarex Limited 0.021 -5% 17% 133% 50% $20,003,280 NVA Nova Minerals Ltd 0.31 -5% 3% -7% 114% $124,465,439 RXL Rox Resources 0.3 -5% 2% 33% 114% $227,794,203 NC1 Nicoresourceslimited 0.1 -5% 9% 19% -17% $12,962,310 CAE Cannindah Resources 0.019 -5% -24% -70% -63% $13,833,519 MLS Metals Australia 0.019 -5% 12% -10% 0% $14,574,390 IG6 Internationalgraphit 0.057 -5% 14% -2% -19% $11,032,825 BUR Burleyminerals 0.038 -5% -7% -21% -65% $6,998,358 FLG Flagship Min Ltd 0.056 -5% -5% 44% -43% $12,525,896 FRS Forrestaniaresources 0.18 -5% 64% 1100% 620% $59,075,883 VMC Venus Metals Cor Ltd 0.099 -6% -14% 8% 48% $19,416,740 LM1 Leeuwin Metals Ltd 0.155 -6% 19% 11% 96% $15,624,990 AXN Alliance Nickel Ltd 0.03 -6% -14% -21% -12% $21,775,188 RIE Riedel Resources Ltd 0.03 -6% 0% -3% -63% $2,564,354 QEM QEM Limited 0.028 -7% -20% -48% -80% $6,619,210 AUZ Australian Mines Ltd 0.007 -7% -7% -30% -13% $13,688,097 KGD Kula Gold Limited 0.007 -7% 0% 17% -26% $6,448,776 ITM Itech Minerals Ltd 0.028 -7% -7% -45% -58% $4,783,391 KAI Kairos Minerals Ltd 0.025 -7% -17% 39% 150% $69,816,384 REC Rechargemetals 0.012 -8% 0% -37% -61% $3,083,880 ADD Adavale Resource Ltd 0.022 -8% 10% -56% -63% $4,021,189 MAN Mandrake Res Ltd 0.021 -9% 11% -9% -28% $13,799,718 ALY Alchemy Resource Ltd 0.005 -9% 0% -38% -17% $5,890,381 BMG BMG Resources Ltd 0.01 -9% 43% -38% 18% $8,059,773 CNB Carnaby Resource Ltd 0.34 -9% -25% -8% -18% $77,652,212 CTM Centaurus Metals Ltd 0.38 -10% 9% 4% 10% $223,515,546 BNR Bulletin Res Ltd 0.047 -10% -24% 18% 0% $13,799,826 IPT Impact Minerals 0.009 -10% 29% -5% -32% $34,963,305 PVT Pivotal Metals Ltd 0.009 -10% 0% 29% -40% $8,165,033 ARV Artemis Resources 0.0045 -10% -18% -55% -50% $11,462,689 MTM Metallium Ltd 0.685 -10% 16% 234% 2262% $380,333,572 SCN Scorpion Minerals 0.017 -11% 0% 13% 0% $8,908,955 IXR Ionic Rare Earths 0.015 -12% -12% 114% 114% $90,581,085 KFM Kingfisher Mining 0.057 -14% 43% 60% 10% $3,802,755 GRE Greentechmetals 0.062 -14% 22% -6% -46% $7,030,498 1AE Auroraenergymetals 0.068 -14% 42% 51% 13% $12,176,334 NMT Neometals Ltd 0.054 -14% -26% -26% -12% $40,836,052 ANX Anax Metals Ltd 0.006 -14% -25% -40% -67% $5,296,845 DTM Dart Mining NL 0.0025 -17% -17% -64% -82% $2,396,111 SRK Strike Resources 0.029 -17% -12% 0% -6% $8,228,750 KNI Kunikolimited 0.078 -18% -10% -45% -50% $7,144,190 HLX Helix Resources 0.001 -20% 20% -60% -60% $5,606,765 MOH Moho Resources 0.004 -20% 0% 0% -11% $2,981,656 TMX Terrain Minerals 0.002 -20% 0% -60% -43% $5,063,629 FIN FIN Resources Ltd 0.004 -20% 33% -33% -33% $2,779,554 SRN Surefire Rescs NL 0.0015 -25% -25% -49% -72% $5,635,289 BUX Buxton Resources Ltd 0.03 -29% -35% -9% -57% $10,308,177 CZN Corazon Ltd 0.002 -33% -33% 0% -50% $3,703,717
Weekly Small Cap Standouts
OD6 Metals (ASX:OD6)
OD6 Metals has produced high-quality mixed rare earth carbonate (MREC) and mixed rare earth hydroxide (MREH) from the Splinter Rock REE project in WA, with its shares running from 3c a pop on Monday to an 18-month high of 9.3c on Thursday.
What makes the results more significant were the low impurities and high payability potential of the material.
The results were from heap leach liquor via metallurgical testing conducted by the Australian Nuclear Science and Technology Organisation (ANSTO).
MREC of ~56% TREO was produced via a simplified and scalable heap leach and impurity removal process flowsheet while MREH of ~59% TREO was also produced utilising the same process but using sodium hydroxide (NaOH) to precipitate the saleable product.
“This is a significant milestone for OD6 and reinforces Splinter Rock’s potential to become a competitive and scalable producer of high-value rare earth products,” MD Brett Hazelden said in an announcement on Wednesday.
“Our innovative processing pathway – using a combination of nanofiltration, ion exchange and impurity control – has enabled us to produce a high-quality, low-impurity MREC and MREH product that meets or exceeds global benchmarks.”
Bayan Mining and Minerals (ASX:BMM)
Bayan said this week that comprehensive exploration is progressing at the Desert Star project in a prospective REE corridor in California’s Mojave Desert.
A total of 65 rock chip samples and 30 heavy minerals concentrate samples were submitted to ALS Laboratory in Reno for REE and multi-element analysis as well as gold fire assays with results expected shortly.
At Desert Star North, exploration is advancing 3km north of the 1.1Moz Colosseum gold mine owned by 2025 ASX bolter Dateline Resources (ASX:DTR). The claims are also along the same regional corridor as MP Materials’ Mountain Pass REE mine.
Twenty one rock chip samples and 46 heavy mineral concentrate samples were also submitted to ALS with results expected in September.
A desktop review of existing geophysical datasets from both projects is underway, leveraging high-resolution airborne magnetic, gravity and radiometric data along with satellite imagery to refine targets.
At the Bayan Springs South project in Nevada a second phase of fieldwork was completed and assays are anticipated within two weeks.
Lindian Resources (ASX:LIN)
The company has secured approval of the Stage 2 Mining Licence Expansion application for the Kangankunde rare earths project, an endorsement from the Malawi Government and regulatory certainty, materially de-risking its expansion development pathway.
The approval from the Mining and Minerals Regulatory Authority (MMRA) Board increases the licensed area from 900 to 2500 hectares.
“The upgrade of our Stage 2 expansion area from an exploration licence to a mining licence allows Lindian to work in parallel on our larger Stage 2 expansion whilst using the learnings from the development of our Stage 1 production facility to ensure we optimise our processing flow sheets and recoveries,” chairman Robert Martin said.
“This will also allow Lindian to capitalise on our ability to be the next rare earth producer to market and to capture a larger market share.
“The company continues to field additional inbound enquiries and is working on multiple pathways for further strategic offtake and funding agreements.”
Kingsland Minerals (ASX:KNG)
Metallurgical testwork at Kingsland Minerals’ Leliyn asset, Australia’s largest graphite deposit, has made a significant breakthrough in identifying the potential to produce a gallium by-product.
Testing – verified by CSIRO analysis – has established muscovite mica as the principal host of gallium mineralisation within the Leliyn graphitic schist, with biotite mica a secondary host of gallium at the project.
Perth’s Independent Metallurgical Operations (IMO) has now started testwork aimed at producing a mica concentrate containing elevated levels of gallium mineralisation.
The mica concentrate will be obtained from material previously used to extract a graphite concentrate and flotation techniques will help float the micas.
Once a mica concentrate is generated, additional work will be planned to assess the viability of extracting gallium or gallium compounds from the concentrate.
If this test work is successful, additional flotation cells to extract mica can be included in future processing designs at the Leliyn graphite project.
Managing director Richard Maddocks said this marked an important development in the company’s strategy to unlock value at Leliyn.
“Now we know what mineral hosts the gallium, we can work towards producing a gallium concentrate,” he said.
“It is anticipated that once a gallium concentrate is produced, additional work will assess the viability of extracting gallium and/or gallium compounds from the concentrate.
“It should be noted that gallium production will not be considered in the Leliyn scoping study due for release later in the September quarter”.
Victory Metals (ASX:VTM)
Victory Metals says an upgrade to the mineral resource estimate at its flagship North Stanmore heavy rare earth elements project in WA has revealed ultra-high, heavy rare earth ratio zones of up to 83%.
With leading ratios of heavy rare earth elements, including dysprosium (Dy) and terbium (Tb), comparing favourably to other Australian clay-hosted project at this scale, Victory is emerging as a standout, low-cost heavy rare earth element producer.
The resource update incorporates results from a targeted 79 drillhole 3221m, air-core drilling campaign, delivering a 29.5% increase to 320.6Mt at 510ppm total rare earth oxide and high HREO/TREO of 39% (inferred and indicated).
The company also identified a high-grade shallow zone of 50 million metric tonnes at 1050ppm TREO/Sc2O3.
The mineralisation remains open, highlighting the opportunity to target the ultra-high heavy rare earth ratio zones through satellite pits.
The upgraded MRE will now be used for the 2025 pre-feasibility study planned for release later in 2025 and will assist in ongoing funding discussions for the project.
“This resource upgrade reinforces the immense scale and strategic importance of North Stanmore,” VTM CEO and executive director Brendan Clark said.
“To deliver a 29.5% increase from a small, low-cost 3221m air core program speaks volumes about this deposit.
“Mineralisation remains open in multiple directions, with consistently thick and high-grade intercepts continuing to be identified.
“While we see strong potential for further resource growth, the company’s priority is progressing development, as there is already sufficient material to support a mine life exceeding 30 years.”
At Stockhead, we tell it like it is. While Kingsland Minerals and Victory Metals are Stockhead advertisers, they did not sponsor this article.
Related Topics

Related Stories


UNLOCK INSIGHTS
Discover the untold stories of emerging ASX stocks.
Daily news and expert analysis, it's free to subscribe.
By proceeding, you confirm you understand that we handle personal information in accordance with our Privacy Policy.


