High Voltage: JPMorgan lifts lithium price forecasts as big batteries drive market to deficit

Sing it louder – JPMorgan is lifting its lithium forecasts. Pic: Getty Images
- JPMorgan says demand for energy stationary storage batteries to drive lithium deficit, lifts prices for 2026/2027
- Demand set to grow 50% this year and 46% in 2026, with ESS to hit 36% of global demand by 2030
- JPM also upgraded valuations for PLS, MIN, IGO and LTR
Our High Voltage column wraps all the news driving ASX stocks with exposure to lithium, cobalt, graphite, nickel, rare earths, and vanadium.
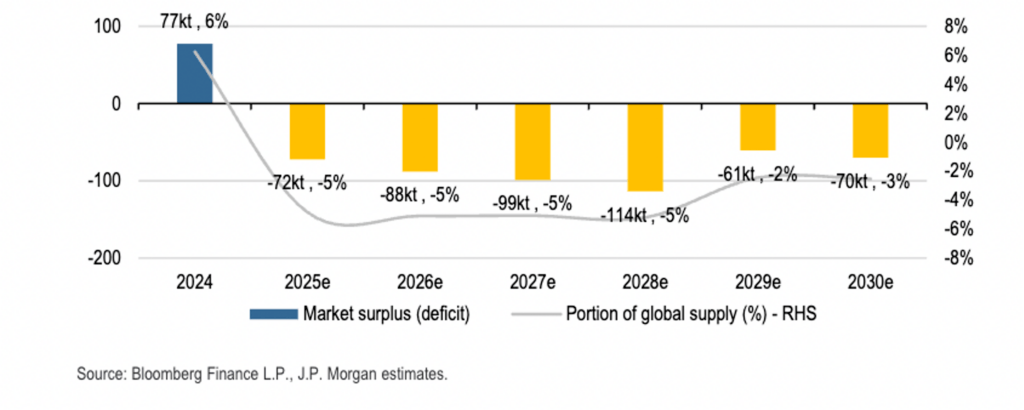
JPMorgan says the demand for energy stationary storage (ESS) batteries is set to pull the lithium market into a deficit and represent 36% of global demand by 2030.
In a research note this week, the investment bank said it estimates ESS production to grow by 50% this year and 43% in 2026.
This alone has pushed JP’s medium-term supply/demand forecasts into deficit – saving the market from persistent surplus.
“After what was looking like a soft few years ahead for lithium prices, Energy Storage battery shipments have shown massive growth YTD,” the research note said.
“We now have ESS representing 30% of lithium market demand in 2026, rising to 36% in 2030.
“Our total market demand for lithium in LCE terms is 2.8Mt in 2030.
“Across electric vehicles, our latest global forecasts see 3-5% growth over 2025-2030.”
Confusion around a major mine in China owned by CATL, which was briefly shut by regulators this year but threatened to restart, has led to price volatility from a low base, ranging between US$800-950/t in recent months.
But JPMorgan analysts led by Lyndon Fagan have now upgraded the bank’s 2026/27 forecasts from US$800/t to US$1100/US$1200/t and their long term price from US$1100/t to US$1300/t – a big deal when several miners have stated they won’t look at restarting idle capacity unless the market consistently trades at US$1200-1500/t.
“After reducing our LT price to $1100/t earlier in the year (from $1250/t), we have now taken the view that this price is too conservative, given recent pressure on capital intensity across the mining sector, and a better demand outlook,” the note said.
“While most high quality hard rock projects will generate an acceptable return at $1100/t, we believe the equity market has, and will continue to, ascribe a higher price into the valuations for the miners.
“Our previous view also included a lack of supply discipline from Western miners on overly optimistic long-term price expectations. However, the recent downturn has shown producers are willing to keep tonnes in the ground until prices improve. This also appears to be the case in China.”
Valuation upgrade for PLS
JPM also delivered some valuation updates. Pilbara Minerals (ASX:PLS) scored an uplift from $1.18 to $3.57 and an overweight rating.
Mineral Resources (ASX:MIN) went from neutral to overweight, jumping from $31ps to $45 on better prices, and pulling forward Wodgina Train 3’s start to FY29.
For IGO, the note highlights an increase from $3.65 to $5.36 on no changes other than price and an upgrade to neutral from underweight.
“We await further details from the company on the Greenbushes optimisation before revising our mine plan assumptions,” Fagan and his team said.
“Finally, at Liontown Resources (ASX:LTR) we reinstate a move from 3Mt to 4Mt processing at LTR, which together with our new prices lifts our NPV from A$0.45ps to $1.13ps due to the company having the highest operating leverage in our coverage.”
LTR was also upgraded to neutral from underweight.
Battery Metals Winners and Losers
Here’s how a basket of ASX stocks with exposure to lithium, cobalt, graphite, nickel, rare earths, magnesium, manganese and vanadium is performing >>>
Code Company Price % Week % Month % Six Month % Year Market Cap MRD Mount Ridley Mines 0.022 340% 633% 906% 151% $20,292,588 EVG Evion Group NL 0.034 36% 10% 100% 13% $15,371,184 PVT Pivotal Metals Ltd 0.027 35% 238% 238% 200% $19,958,969 TMX Terrain Minerals 0.006 33% 50% 140% 71% $16,090,886 AXE Archer Materials 0.43 26% 62% 59% 87% $105,761,510 FLG Flagship Min Ltd 0.195 26% 39% 167% 220% $55,824,073 ABX ABX Group Limited 0.105 25% 54% 169% 169% $29,800,952 SRN Surefire Rescs NL 0.0025 25% 25% 0% -40% $8,051,219 BMG BMG Resources Ltd 0.016 23% 23% 68% 45% $14,774,355 RBX Resource B 0.055 20% 20% 49% 57% $6,911,069 FML Focus Minerals Ltd 2.53 19% 141% 954% 1268% $742,186,891 GAL Galileo Mining Ltd 0.22 19% -2% 100% 42% $42,489,359 NWM Norwest Minerals 0.014 17% 17% 17% -9% $14,421,497 PLS Pilbara Min Ltd 3.275 17% 35% 113% 15% $10,076,852,355 THR Thor Energy PLC 0.015 15% 36% 50% 0% $11,540,977 MIN Mineral Resources. 47.15 15% 15% 129% 27% $8,375,636,362 AEE Aura Energy 0.2175 14% -18% 67% 40% $197,281,270 WSR Westar Resources 0.008 14% 14% 60% 0% $3,189,799 SER Strategic Energy 0.008 14% 60% 33% -20% $8,791,467 REE Rarex Limited 0.043 13% 72% 54% 258% $36,521,359 DEV Devex Resources Ltd 0.13 13% -16% 49% 0% $53,002,881 ARV Artemis Resources 0.009 13% 20% 13% -31% $33,938,299 CUL Cullen Resources 0.009 13% 29% 125% 80% $6,240,617 QEM QEM Limited 0.02 11% -13% -62% -64% $4,728,007 RAS Ragusa Minerals Ltd 0.045 10% 55% 114% 181% $8,018,945 KGD Kula Gold Limited 0.036 9% 24% 414% 376% $42,607,983 MHC Manhattan Corp Ltd 0.026 8% 13% 44% -35% $15,606,461 AVW Avira Resources Ltd 0.014 8% 27% 100% -30% $3,703,000 CY5 Cygnus Metals Ltd 0.14 8% 40% 57% 8% $143,697,371 LLM Loyal Metals Ltd 0.375 7% 39% 468% 200% $52,487,399 SFM Santa Fe Minerals 0.235 7% -6% 535% 683% $26,512,415 AX8 Accelerate Resources 0.008 7% -11% 14% -11% $6,649,510 SFR Sandfire Resources 16.21 6% 17% 58% 56% $7,335,733,243 HAV Havilah Resources 0.25 6% 11% 43% 16% $87,591,852 LTR Liontown Resources 1.1275 6% 17% 98% 27% $3,027,240,861 GA8 Goldarc Resources 0.052 6% 86% 108% 16% $28,943,484 LCY Legacy Iron Ore 0.009 6% 13% 13% -28% $78,096,341 TVN Tivan Limited 0.19 6% 81% 81% 296% $424,926,211 RIE Riedel Resources Ltd 0.039 5% 26% 30% -51% $5,563,589 CRR Critical Resources 0.0105 5% 24% 250% 31% $29,604,604 NIC Nickel Industries 0.75 5% 4% 36% -22% $3,168,883,189 OB1 Orbminco Limited 0.022 5% -8% 10% -47% $3,830,825 CXO Core Lithium 0.115 5% 0% 55% -4% $305,959,334 FG1 Flynngold 0.023 5% -12% 16% -23% $13,390,417 ZNC Zenith Minerals Ltd 0.092 5% -37% 92% 74% $49,997,586 DLI Delta Lithium 0.1725 5% -1% -4% -34% $121,929,405 REC Rechargemetals 0.0235 4% 7% 68% -29% $6,039,264 IMI Infinitymining 0.012 4% 20% 0% -50% $5,076,189 EMC Everest Metals Corp 0.125 4% -4% -14% -4% $32,208,842 CMO Cosmometalslimited 0.025 4% 32% 39% 77% $9,531,428 MHK Metalhawk. 0.125 4% -12% -68% -26% $14,807,108 GL1 Globallith 0.505 4% 60% 206% 130% $133,483,383 PSC Prospect Res Ltd 0.1925 4% -4% 33% 153% $130,172,184 IGO IGO Limited 5.42 4% 6% 43% 0% $4,127,109,581 MRR Minrex Resources Ltd 0.013 4% 44% 63% 44% $14,103,278 PFE Pantera Lithium 0.028 4% 33% 87% 17% $13,739,727 VRX VRX Silica Ltd 0.091 3% -24% 128% 133% $72,735,713 HMX Hammer Metals Ltd 0.031 3% -16% 7% -30% $27,675,520 1AE Auroraenergymetals 0.094 3% -10% 74% 84% $16,115,736 EGR Ecograf Limited 0.575 3% 58% 105% 637% $296,807,039 LOT Lotus Resources Ltd 0.195 3% -13% 5% -25% $516,024,855 GCM Green Critical Min 0.0195 3% -15% 63% 680% $57,273,779 RIO Rio Tinto Limited 133.68 3% 10% 15% 10% $49,501,682,137 EFE Eastern Resources 0.043 2% -4% 65% 8% $5,421,868 WIN WIN Metals 0.045 2% -13% 105% 36% $28,206,423 ADD Adavale Resource Ltd 0.047 2% 34% 18% -22% $12,628,193 AGY Argosy Minerals Ltd 0.05 2% 47% 178% 19% $78,331,968 KNG Kingsland Minerals 0.1275 2% -2% 11% -29% $9,604,482 BHP BHP Group Limited 44.335 2% 6% 16% 3% $222,913,499,251 DYM Dynamicmetalslimited 0.295 2% 5% -18% 34% $14,531,505 NST Northern Star 23.945 2% 2% 20% 34% $34,165,959,251 S32 South32 Limited 3.205 1% 20% 15% -14% $14,443,538,943 MEK Meeka Metals Limited 0.2025 1% -8% 31% 135% $584,828,534 S2R S2 Resources 0.095 1% -5% -10% 27% $41,621,930 JMS Jupiter Mines. 0.2625 1% 3% 75% 46% $510,848,049 SRL Sunrise 4.52 0% -8% 666% 1191% $550,504,218 QXR Qx Resources Limited 0.005 0% 0% 29% 3% $9,213,317 RIL Redivium Limited 0.004 0% 0% 0% 0% $13,609,422 LKE Lake Resources 0.033 0% 6% -8% -50% $74,840,236 MAN Mandrake Res Ltd 0.023 0% 5% 21% -21% $14,426,978 RLC Reedy Lagoon Corp. 0.005 0% 67% 150% 150% $3,883,533 MLX Metals X Limited 0.84 0% 9% 46% 81% $740,136,934 CLA Celsius Resource Ltd 0.012 0% 20% 71% 9% $40,761,350 RYZ Ryzon Materials Ltd 0.042 0% 0% 0% 0% $50,378,922 ARL Ardea Resources Ltd 0.62 0% 19% 49% 46% $131,508,072 GLN Galan Lithium Ltd 0.15 0% 3% 36% -19% $153,389,651 VRC Volt Resources Ltd 0.006 0% 50% 33% 50% $28,109,096 LIB Liberty Metals 0.003 0% 20% 50% 100% $17,948,799 IPT Impact Minerals 0.006 0% 0% 0% -51% $28,464,595 FBM Future Battery 0.044 0% 38% 159% 144% $30,359,746 CHR Charger Metals 0.075 0% 36% 74% 10% $5,651,678 ALY Alchemy Resource Ltd 0.01 0% 11% 67% 43% $11,880,763 LEL Lithenergy 0.37 0% 0% 0% 0% $41,440,581 RMX Red Mount Min Ltd 0.033 0% -8% 313% 267% $25,003,125 LML Lincoln Minerals 0.008 0% 14% 68% 20% $20,623,620 MRC Mineral Commodities 0.026 0% 0% 0% 0% $25,596,288 EMH European Metals Hldg 0.24 0% 17% 2% 37% $53,155,756 MOH Moho Resources 0.008 0% 14% 167% 33% $6,206,196 G88 Golden Mile Res Ltd 0.009 0% -10% -10% -53% $5,632,965 BOA BOA Resources Ltd 0.034 0% 62% 89% 55% $4,193,997 MLS Metals Australia 0.032 0% 28% 52% 45% $22,683,305 CNB Carnaby Resource Ltd 0.435 0% 23% 55% 16% $120,112,141 AM7 Arcadia Minerals 0.048 0% 60% 200% 37% $5,634,405 AS2 Askarimetalslimited 0.014 0% 33% 77% -45% $5,839,987 EMS Eastern Metals 0.01 0% 0% 0% -50% $1,394,262 TEM Tempest Minerals 0.01 0% 11% 150% 67% $12,120,089 KOR Korab Resources 0.008 0% 0% 0% 0% $2,936,400 CMX Chemxmaterials 0.026 0% 0% 0% -33% $33,545,803 FRB Firebird Metals 0.15 0% -6% 83% 43% $24,554,210 AKN Auking Mining Ltd 0.007 0% 17% 17% 133% $5,740,216 EMT Emetals Limited 0.006 0% 0% 50% 50% $5,100,000 ODE Odessa Minerals Ltd 0.013 0% 63% 86% 86% $22,158,923 AZI Altamin Limited 0.026 0% -21% 20% 5% $18,750,369 CLZ Classic Min Ltd 0.001 0% 0% 0% 0% $4,265,855 SUM Summitminerals 0.041 0% 22% 0% -72% $4,316,197 TAR Taruga Minerals 0.012 0% 0% 20% 0% $8,565,049 AOA Ausmon Resorces 0.003 0% 0% 50% 50% $3,933,640 DM1 Desert Metals 0.011 0% 0% -39% -68% $5,501,353 BCA Black Canyon Limited 0.385 0% -13% 542% 483% $58,811,352 FIN FIN Resources Ltd 0.01 0% 100% 67% 43% $6,948,884 AMD Arrow Minerals 0.02 0% 0% -20% 0% $17,555,332 AYM Australia United Min 0.004 0% 33% 100% 100% $7,370,310 HLX Helix Resources 0.001 0% -33% -60% -70% $5,346,291 HWK Hawk Resources. 0.034 0% 70% 79% -15% $11,514,501 ORN Orion Minerals Ltd 0.016 0% -11% 33% -16% $129,142,233 SRK Strike Resources 0.042 0% -13% 8% 17% $11,917,500 PTR Petratherm Ltd 0.2875 -1% -1% 17% 413% $93,585,988 KOB Kobaresourceslimited 0.067 -1% 0% 58% -32% $13,907,011 TKM Trek Metals Ltd 0.052 -2% -5% -25% 93% $31,286,317 SLM Solismineralsltd 0.051 -2% -36% -36% -48% $7,054,009 AXN Alliance Nickel Ltd 0.05 -2% 19% 43% 32% $35,054,462 OMH OM Holdings Limited 0.25 -2% -9% -23% -33% $199,226,768 QGL Quantum Graphite 0.45 -2% -5% -6% -15% $153,519,935 FGR First Graphene Ltd 0.087 -2% 32% 118% 102% $74,441,427 NVA Nova Minerals Ltd 0.835 -2% 67% 149% 227% $332,515,673 QPM QPM Energy Limited 0.041 -2% 3% 5% 11% $129,752,522 AQD Ausquest Limited 0.04 -2% 5% -29% 344% $57,092,235 WR1 Winsome Resources 0.2 -2% 14% 11% -63% $47,573,848 PMT Pmet Resources 0.38 -3% -14% 38% 0% $204,016,032 EMN Euromanganese 0.175 -3% 3% -15% -41% $8,341,071 RON Roninresourcesltd 0.175 -3% -3% -5% 30% $7,065,627 RVT Richmond Vanadium 0.068 -3% 1% -56% -77% $15,334,557 ATM Aneka Tambang 1.01 -3% 0% 6% 12% $1,316,685 ESR Estrella Res Ltd 0.03 -3% -17% -3% 131% $70,412,530 KM1 Kalimetalslimited 0.15 -3% -9% 67% 11% $13,726,118 RAG Ragnar Metals Ltd 0.029 -3% 16% 45% 21% $13,745,593 WC8 Wildcat Resources 0.2125 -3% 1% 6% -33% $268,485,765 SRZ Stellar Resources 0.027 -4% -4% 59% 50% $65,985,891 A4N Alpha Hpa Ltd 0.765 -4% -10% -14% -25% $858,640,177 TLM Talisman Mining 0.12 -4% -17% -17% -50% $21,656,840 LMG Latrobe Magnesium 0.0325 -4% 17% 227% 21% $98,442,536 SMX Strata Minerals 0.021 -5% 17% 24% -16% $4,897,044 OM1 Omnia Metals Group 0.021 -5% 40% 110% -73% $5,832,051 CRI Critica Ltd 0.04 -5% 67% 150% 264% $105,592,700 ITM Itech Minerals Ltd 0.06 -5% 18% 33% -17% $15,049,779 VHM Vhmlimited 0.58 -5% 142% 87% 40% $139,952,568 INF Infinity Metals Ltd 0.019 -5% 19% -27% -46% $8,150,887 WCN White Cliff Min Ltd 0.019 -5% -14% 0% 6% $41,622,718 A11 Atlantic Lithium 0.19 -5% -14% 36% -25% $136,630,544 KAI Kairos Minerals Ltd 0.037 -5% 12% 85% 118% $124,593,439 CTM Centaurus Metals Ltd 0.43 -5% 16% 13% -7% $247,644,240 M24 Mamba Exploration 0.017 -6% 6% 31% 42% $5,017,815 CHN Chalice Mining Ltd 2.01 -6% -19% 77% 8% $778,211,182 KNI Kunikolimited 0.066 -6% -4% -55% -50% $8,648,700 VR8 Vanadium Resources 0.032 -6% -20% 78% -29% $19,990,935 NC1 Nicoresourceslimited 0.16 -6% 19% 125% 60% $19,752,092 ALK Alkane Resources Ltd 0.9875 -6% -15% 17% 72% $1,393,110,866 PL9 Prairie Lithium Ltd 0.0075 -6% 25% 50% -58% $37,662,201 GW1 Greenwing Resources 0.03 -6% 3% 0% -53% $11,333,044 GRE Greentechmetals 0.059 -6% 5% 31% -55% $6,690,313 PGD Peregrine Gold 0.22 -6% -19% 38% 47% $23,636,185 NMT Neometals Ltd 0.058 -6% 9% -9% -38% $44,688,509 IDA Indiana Resources 0.043 -7% -17% 35% 88% $28,967,961 ELV Elevra Lithium Ltd 3.84 -7% -2% 35% -27% $634,486,242 HAW Hawthorn Resources 0.071 -7% 16% 61% 22% $23,451,093 RNU Renascor Res Ltd 0.084 -7% 31% 12% 17% $213,624,966 OCN Oceanalithiumlimited 0.14 -7% 17% 419% 380% $23,309,493 KTA Krakatoa Resources 0.014 -7% 40% 40% 40% $13,553,876 ARN Aldoro Resources 0.46 -7% -7% -12% 411% $101,773,250 EV1 Evolutionenergy 0.013 -7% -24% 34% -63% $7,527,949 PAT Patriot Resourcesltd 0.052 -7% 33% -26% 16% $8,581,168 KFM Kingfisher Mining 0.088 -7% 22% 117% 70% $7,569,798 VMC Venus Metals Cor Ltd 0.125 -7% 4% 19% 92% $24,516,085 M79 Mammothmineralsltd 0.125 -7% -24% 108% -4% $64,288,637 STM Sunstone Metals Ltd 0.0185 -8% -18% 42% 106% $114,248,451 LRV Larvottoresources 1.09 -8% 42% 25% 86% $575,888,909 INR Ioneer Ltd 0.18 -8% 6% 29% -42% $480,205,736 GBR Greatbould Resources 0.07 -8% -7% -10% 30% $74,926,330 KZR Kalamazoo Resources 0.175 -8% 9% 108% 80% $39,866,597 IG6 Internationalgraphit 0.081 -8% 40% 62% 27% $15,726,703 TLG Talga Group Ltd 0.455 -8% 2% 6% 17% $205,322,018 ICL Iceni Gold 0.056 -8% -2% -18% 12% $19,946,280 SBR Sabre Resources 0.011 -8% -8% 38% -15% $4,339,081 MQR Marquee Resource Ltd 0.011 -8% -8% 10% -31% $8,152,172 ASN Anson Resources Ltd 0.087 -8% -4% 55% 18% $122,699,484 SGQ St George Min Ltd 0.105 -9% -9% 338% 320% $372,819,710 TOR Torque Met 0.255 -9% -26% 166% 245% $143,410,395 SLZ Sultan Resources Ltd 0.01 -9% 25% 25% 11% $5,363,205 EVR Ev Resources Ltd 0.01 -9% -23% 150% 264% $25,310,456 PNT Panthermetalsltd 0.01 -9% 0% -41% -73% $3,062,795 OD6 Od6Metalsltd 0.06 -9% -6% 173% 107% $12,731,487 PBL Parabellumresources 0.1 -9% 28% 75% 100% $7,164,500 RXL Rox Resources 0.435 -9% -11% 18% 142% $331,068,650 BUR Burleyminerals 0.048 -9% 33% -4% -45% $8,840,031 NH3 Nh3Cleanenergyltd 0.095 -10% 70% 265% 280% $66,561,015 VUL Vulcan Energy 6.14 -10% 8% 26% 15% $1,413,607,961 ADV Ardiden Ltd 0.325 -10% 103% 124% 117% $20,318,189 AR3 Austrare 0.23 -10% 109% 132% 132% $47,110,717 L1M Lightning Minerals 0.046 -10% 5% -29% -29% $9,460,166 PGM Platina Resources 0.027 -10% -18% 29% 8% $17,413,119 LEG Legend Mining 0.009 -10% -10% 13% -25% $26,230,295 DRE Dreadnought Resources Ltd 0.0315 -10% -25% 110% 97% $179,001,143 MTC Metalstech Ltd 0.27 -10% 17% 170% 80% $56,624,015 GT1 Greentechnology 0.026 -10% -21% -7% -71% $15,443,026 WC1 Westcobarmetals 0.026 -10% 24% 63% 37% $7,329,632 MNB Minbos Resources Ltd 0.043 -10% -19% 8% 2% $41,927,133 DVP Develop Global Ltd 3.63 -11% -13% 18% 39% $1,176,116,354 ILU Iluka Resources 6.75 -11% 6% 61% 13% $2,917,689,515 JLL Jindalee Lithium Ltd 0.535 -11% -3% 30% 130% $49,217,448 1MC Morella Corporation 0.041 -11% 71% 116% 37% $15,105,588 SYR Syrah Resources 0.3475 -11% 34% 41% 28% $452,480,865 SYR Syrah Resources 0.3475 -11% 34% 41% 28% $452,480,865 IPX Iperionx Limited 6.875 -11% -14% 99% 120% $2,309,232,440 E25 Element 25 Ltd 0.325 -11% 25% 38% 14% $88,753,408 FRS Forrestaniaresources 0.2 -11% -34% 413% 1438% $92,323,295 TON Triton Min Ltd 0.008 -11% 14% 60% -20% $12,547,110 GSM Golden State Mining 0.016 -11% 7% 78% 45% $5,811,801 ENV Enova Mining Limited 0.008 -11% 0% 14% 0% $11,053,200 SVM Sovereign Metals 0.64 -11% -9% -4% -10% $426,979,544 SVY Stavely Minerals Ltd 0.016 -11% -27% 23% -47% $10,956,582 VTM Victory Metals Ltd 1.0225 -11% -26% 115% 176% $136,030,148 STK Strickland Metals 0.19 -12% 23% 129% 204% $418,536,562 CDT Castle Minerals 0.06 -12% -21% 3% -33% $10,104,792 EUR European Lithium Ltd 0.22 -12% 137% 331% 495% $364,080,556 AUV Auravelle Metals 0.022 -12% -4% 69% 29% $11,686,668 ASL Andean Silver 1.555 -12% -25% 46% 15% $300,949,640 RGL Riversgold 0.007 -13% 17% 56% 133% $14,585,988 FUN Fortuna Metals Ltd 0.14 -13% 17% 211% 107% $26,228,172 FUN Fortuna Metals Ltd 0.14 -13% 17% 211% 107% $26,228,172 HRE Heavy Rare Earths 0.048 -13% 2% 140% 20% $10,193,660 WA1 Wa1Resourcesltd 17.2 -13% -7% 34% 25% $1,293,402,407 LU7 Lithium Universe Ltd 0.013 -13% 0% 117% -18% $20,306,715 BM8 Battery Age Minerals 0.16 -14% 74% 196% 62% $30,964,110 BUX Buxton Resources Ltd 0.03 -14% -3% -6% -58% $10,995,389 M2R Miramar 0.003 -14% 0% -25% -63% $3,584,770 MEI Meteoric Resources 0.1825 -15% 26% 74% 59% $488,572,829 WMG Western Mines 0.195 -15% -32% 39% -11% $22,749,669 LIT Livium Ltd 0.011 -15% -21% 38% -45% $22,705,178 BNR Bulletin Res Ltd 0.049 -16% -18% -30% 9% $15,267,893 PUR Pursuit Minerals 0.065 -16% -41% 51% -57% $9,929,874 BSX Blackstone Ltd 0.054 -16% -26% -24% 63% $96,313,169 CZN Corazon Ltd 0.16 -16% -36% 60% -36% $8,033,924 AUZ Australian Mines Ltd 0.016 -16% -27% 39% 7% $32,183,419 BC8 Black Cat Syndicate 0.9825 -16% -31% -3% 75% $699,991,214 LYC Lynas Rare Earths 15.285 -17% -9% 78% 98% $15,379,359,392 LSR Lodestar Minerals 0.035 -17% 40% 110% 78% $29,421,889 TMB Tambourahmetals 0.1 -17% 133% 270% 203% $23,842,651 ENT Enterprise Metals 0.005 -17% -29% 150% 25% $7,470,753 YAR Yari Minerals Ltd 0.01 -17% 11% 100% 186% $9,234,102 ZEU Zeus Resources Ltd 0.015 -17% -17% 114% 67% $10,761,550 LPM Lithium Plus 0.115 -18% 21% 83% -26% $15,276,600 RR1 Reach Resources Ltd 0.009 -18% -31% 13% -10% $7,869,882 RR1 Reach Resources Ltd 0.009 -18% -31% 13% -10% $7,869,882 GTE Great Western Exp. 0.018 -18% -10% 6% -49% $10,219,643 ARR American Rare Earths 0.435 -19% 16% 50% 61% $257,898,510 LM1 Leeuwin Metals Ltd 0.215 -19% 25% 16% 195% $21,169,341 SCN Scorpion Minerals 0.03 -19% 58% 76% 100% $15,729,186 BKT Black Rock Mining 0.017 -19% -11% -15% -67% $38,655,684 LIN Lindian Resources 0.31 -19% 15% 182% 220% $525,075,237 NVX Novonix Limited 0.6025 -20% 23% 34% -22% $562,828,106 BYH Bryah Resources Ltd 0.004 -20% 0% 0% 33% $5,942,663 CTN Catalina Resources 0.004 -20% 0% 100% 42% $9,764,076 PNN Power Minerals Ltd 0.1225 -21% 29% 108% 17% $30,182,323 HAS Hastings Tech Met 0.57 -22% 84% 58% 115% $136,464,113 BMM Bayanminingandmin 0.12 -23% -48% 357% 154% $18,231,005 GRL Godolphin Resources 0.017 -23% -11% 89% 0% $11,834,663 AVL Aust Vanadium Ltd 0.01 -23% 5% 0% -38% $94,981,239 MTM Metallium Ltd 0.775 -23% -34% 223% 801% $498,920,233 A8G Australasian Metals 0.11 -24% 26% 57% 16% $6,367,870 GED Golden Deeps 0.056 -24% -14% 195% 87% $12,398,799 PVW PVW Res Ltd 0.021 -25% -45% 50% -5% $5,225,450 IXR Ionic Rare Earths 0.015 -25% -6% 114% 50% $107,730,104 ANX Anax Metals Ltd 0.009 -25% 0% 80% -25% $8,828,076 VML Vital Metals Limited 0.21 -26% -9% 40% 110% $30,763,758 CAE Cannindah Resources 0.05 -26% 85% 5% 42% $50,540,883 CNJ Conico Ltd 0.008 -27% 33% 14% -20% $2,993,603 ETM Energy Transition 0.08 -27% 8% 19% 248% $162,358,360 AAJ Aruma Resources Ltd 0.02 -29% 82% 122% 11% $8,256,505 NTU Northern Min Ltd 0.044 -30% 16% 29% 120% $392,786,323 EG1 Evergreenlithium 0.045 -31% 7% -6% -45% $12,094,956 ASM Ausstratmaterials 0.92 -31% 60% 38% 64% $254,640,093 ARU Arafura Rare Earths 0.28 -33% 40% 40% 87% $881,137,564 DTM Dart Mining NL 0.053 -35% 41% -29% -73% $10,483,878 COB Cobalt Blue Ltd 0.125 -40% 145% 108% 35% $66,530,855 PLL Piedmont Lithium Inc 0 -100% -100% -100% -100% $67,063,990 CWX Carawine Resources 0 -100% -100% -100% -100% $24,793,172 PEK Peak Rare Earths Ltd 0 -100% -100% -100% -100% $193,649,227 WKT Walkabout Resources 0 -100% -100% -100% -100% $63,769,838 XTC XTC Lithium Limited 0 -100% -100% -100% -100% $87,641 PEK Peak Rare Earths Ltd 0 -100% -100% -100% -100% $193,649,227 LLL Leolithiumlimited 0 -100% -100% -100% -100% $401,204,047 Code Company Price % Week % Month % Six Month % Year Market Cap MRD Mount Ridley Mines 0.022 340% 633% 906% 151% $20,292,588
Weekly Small Cap Standouts
Mount Ridley Mines (ASX:MRD)
It’s an ideal time for MRD to unveil a significant maiden resource of the critical mineral gallium at its namesake project in southern WA.
The maiden inferred resource of 838.7Mt grading 29.3ppm at a 25ppm cut-off for 24,584t of gallium extending from just 4m to 61m vertically represents a valuable, secondary mineral at the Mt Ridley project, which was originally known for its rare earths mineralisation.
Gallium is hosted in the same clay and saprolitic horizons as the REEs and the potential was firmed up during MRD’s assessment of the broader critical minerals potential of the project, including scandium.
MRD is now investigating potential innovative metallurgical solutions targeting a mixed REE carbonate product with gallium and other critical elements as secondary recoveries.
Discussions are underway with Australian and international research groups and processing specialists to design innovative extraction and purification pathways suitable for clay-hosted critical mineral systems.
Gallium is a soft metal that isn’t typically mined as a primary ore but as a byproduct of bauxite and zinc processing. It is a critical component in semiconductors, optical-electronic devices, solar panels and several military applications.
The gallium market is forecast to grow at a compound annual growth rate of around 25% from about US$1.7bn in 2024 to US$6.5bn by 2030 according to USDA Analytics.
Ragusa Minerals (ASX:RAS)
The company is adding a North American project to its portfolio, snapping up the Purple Pansy manganese-gold project in Arizona.
The United States currently has no active manganese mining operations and is 100% import-reliant for its manganese requirements and the Government’s Wenden Manganese Stockpile, is approximately 20km west of the project – underscoring the district’s historic and strategic significance.
Additionally, South32’s (ASX:S32) Hermosa Project in southern Arizona – where manganese is a key mineral – has received substantial U.S. government funding to advance its development, highlighting the national priority being placed on rebuilding domestic manganese supply chains.
RAS will be seeking the same kind of government support Hermosa has enjoyed in southern Arizona.
“This is a significant opportunity to leverage recent U.S. government prominence on domestic strategic critical minerals and is an exciting growth prospect to create long term value for our shareholders,” RAG chair Jerko Zuvela said.
The company plans to undertake exploration, feasibility and development activities at the Project, noting its strategic nature for powering the U.S.’s energy future.
RareX (ASX:REE)
RareX has entered a non-binding MOU with US Strategic Metals in a move set to streamline critical minerals processing and supply chain development between Australia and the US.
USSM is focused on becoming the first major near-term domestic producer of critical minerals in the United States with its fully permitted site in Missouri for multi-metallic processing and tailings management.
REE brings to the partnership Australia’s largest undeveloped rare earth deposit, the Cummins Range project in Western Australia, at which metallurgical testing is being completed, including in North America, and a Mining Licence is expected in early 2026.
Cummins Range is a multi-critical-mineral deposit containing rare earths, gallium, scandium and phosphate with access to the Port of Wyndham.
RareX is also in consortium with Iluka Resources (ASX:ILU) for the Mrima Hill rare earth and niobium project in Kenya, which has the potential to be a multi-generational supply of rare earths.
The partnership aligns with the Trump Administration’s Executive Order 14241, ‘Immediate Measures to Increase American Mineral Production’ which has the goal of achieving critical mineral and energy dominance by onshoring critical mineral production in the United States.
The parties will establish a working group to progress feasibility and technical assessments at the USSM site in Missouri and evaluate downstream integration opportunities.
“This partnership represents a natural alignment between Australia’s upstream mineral capability and the United States’ growing downstream industrial base,” RareX MD and CEO James Durrant said.
“RareX’s focus is on developing reliable, multi-mineral feed sources such as Cummins Range, and potentially Mrima Hill, to serve transparent, allied supply chains.
“By working with U.S. Strategic Metals, we are taking a practical step toward integrating Australian-led resource development with US processing capacity —helping to build the secure, Western aligned supply chains that our industries and governments are calling for.”
Terrain Minerals (ASX:TMX)
Preliminary results from airborne electromagnetic surveying carried out by Terrain Minerals has identified an extensive regolith-hosted rare earths target zone at the Lort River project in WA’s Esperance region.
The 320km2 project is within the Albany Fraser Belt, which hosts AngloGold Ashanti’s 5Moz Tropicana gold mine and IGO’s Nova-Bollinger nickel-copper mine.
The survey mapped the extent, thickness and depth of the conductive regolith horizon with the interpreted basin found to have a length and width exceeding 1.2km and 5.5km respectively.
Notably, this basin correlates with known REE-bearing clay horizons previously identified in drilling, which returned results of up to 8m grading 4037ppm total rare earth oxides from a down-hole depth of 23m including 1m at 9842ppm TREO.
Adding interest, valuable magnet REEs make up a significant percentage of the total REE basket with the top 1m zone holding 2362ppm neodymium, 647ppm praseodymium and 291ppm dysprosium.
“The completion of the regolith mapping via airborne electromagnetics marks a key milestone in advancing the REE potential of our Lort River Project,” executive director Justin Virgin said.
“Early data interpretation has confirmed a broad conductive clay basin that correlates with potential REE enrichment.”
“These results, combined with our previous geochemical work, reinforce the Lort River project as an emerging critical minerals discovery opportunity within the Esperance region.”
“The apparent spatial correlation between AEM conductivity zones and prior assay data gives us confidence in targeting future drilling more effectively. Terrain’s focus now turns to drill testing the interpreted target basin over the summer period.”
At Stockhead, we tell it like it is. While Mount Ridley Mines, RareX and Terrain Minerals are Stockhead advertisers, they did not sponsor this article.
Related Topics

Related Stories


UNLOCK INSIGHTS
Discover the untold stories of emerging ASX stocks.
Daily news and expert analysis, it's free to subscribe.
By proceeding, you confirm you understand that we handle personal information in accordance with our Privacy Policy.


