High Voltage: In 2012, 130,000 EVs were sold. Today, 130,000 EVs are sold each week
Pic: Getty
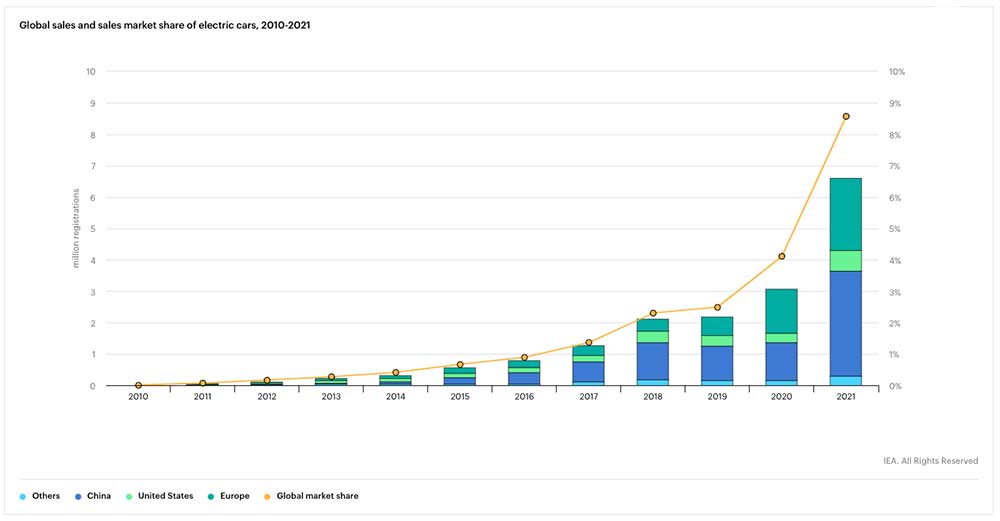
- In 2021, EV sales more than doubled to 6.6 million, ~9% of the global car market
- In 2022, global sales are projected to surpass 10.5 million: BNEF
- More EVs were sold in China in 2021 than were sold in the entire world in 2020
Our High Voltage column wraps all the news driving ASX stocks with exposure to lithium, cobalt, graphite, nickel, rare earths, manganese, magnesium, and vanadium.
In the whole of 2012, about 130,000 electric cars were sold globally. Today, that many are sold in the space of a single week, according to commentary from the IEA.
Growth has been particularly impressive over the last three years, it says.
“In 2019, 2.2 million electric cars were sold, representing just 2.5% of global car sales,” it says.
“In 2020, the overall car market contracted but electric car sales bucked the trend, rising to 3 million and representing 4.1% of total car sales.
“In 2021, electric car sales more than doubled to 6.6 million, representing close to 9% of the global car market and more than tripling their market share from two years earlier.”
All the net growth in global car sales in 2021 came from electric cars.
In 2022, global sales of electric passenger vehicles are projected to surpass 10.5 million — another 4 million above 2021 levels — BloombergNEF said in a recent report.
China: still the EV powerhouse
World #2 economy China is still leading global growth in EV sales, which nearly tripled to 3.4 million in 2021.
In other words, more electric cars were sold in China in 2021 than were sold in the entire world in 2020.
“Electric cars’ share of the overall market on a monthly basis leaped from 7.2% in January to around 20% in December,” IEA says.
“The Chinese government’s official target is for electric cars to reach a market share of 20% for the full year in 2025, and their performance in 2021 suggests they are well on track to do so.”
Despite cutting subsidies on January 1, sales at two of China’s largest EV makers continued to race ahead in 2022.
What about high raw materials costs?
If battery metal prices continue to rise, prices for batteries – the most expensive part of an EV — will continue to be impacted, IEA says.
“In 2021, the price of steel rose by as much as 100%, aluminium around 70%, and copper more than 33%, affecting both conventional and electric cars,” it says.
“For electric cars, additional challenges were posed by increased prices for materials needed to manufacture batteries: the price of lithium carbonate increased by 150% year on year, graphite by 15%, and nickel by 25%, to name just a few.”
While some of the supply constraints of 2021 will ease as the market rebalances, others may linger, the IEA says.
“The world faces potential shortages of lithium and cobalt as early as 2025 unless sufficient investments are made to expand production,” it says.
“Further growth of EVs requires not only an expansion of the extraction of key minerals – but also of the entire EV value chain.
“This spans battery metal processing and refining, cathode and anode manufacturing, separator manufacturing, cell production, battery assembly and, finally, the assembly of electric vehicles.
“Each of these industries, some of which are nascent, need to expand rapidly to avoid bottlenecks that would slow down the transition to full electric mobility.”
Battery Metals Winners and Losers
Here’s how a basket of ASX stocks with exposure to lithium, cobalt, graphite, nickel, rare earths, magnesium, manganese, and vanadium are performing>>>
Battery metals stocks missing from our list? Shoot a friendly mail to [email protected]
| CODE | COMPANY | 1 WEEK RETURN | 1 MONTH RETURN | 6 MONTH RETURN | 1 YEAR RETURN | PRICE | MARKET CAP |
|---|---|---|---|---|---|---|---|
| SHH | Shree Minerals | 118% | 167% | 85% | 41% | 0.024 | $25,517,685.41 |
| RNU | Renascor Resources | 60% | 91% | 264% | 805% | 0.335 | $568,161,295.50 |
| MLS | Metals Australia | 50% | 50% | 50% | 50% | 0.003 | $13,096,393.40 |
| CNB | Carnaby Resources | 41% | 43% | 517% | 645% | 1.975 | $285,635,153.47 |
| LRV | Larvotto Resources | 36% | 33% | 0% | 0% | 0.265 | $8,782,500.00 |
| WCN | White Cliff Minerals | 32% | 32% | 154% | 57% | 0.033 | $15,423,106.37 |
| AS2 | Askari Metals | 27% | 98% | 123% | 0% | 0.445 | $17,158,511.25 |
| CAE | Cannindah Resources | 27% | 61% | 408% | 1030% | 0.305 | $167,812,848.32 |
| ADV | Ardiden | 27% | 58% | 73% | -21% | 0.019 | $36,861,701.05 |
| MLX | Metals X | 24% | 20% | 143% | 265% | 0.62 | $508,068,997.52 |
| MRR | Minrex Resources | 23% | 15% | 322% | 204% | 0.076 | $59,533,537.35 |
| LSR | Lodestar Minerals | 22% | 16% | 22% | 0% | 0.011 | $13,909,373.48 |
| SRI | Sipa Resources | 21% | 6% | -15% | -20% | 0.051 | $10,456,264.95 |
| GSR | Greenstone Resources | 21% | 43% | 111% | 67% | 0.04 | $30,668,990.18 |
| JRL | Jindalee Resources | 20% | 25% | 1% | 62% | 3.15 | $173,132,691.20 |
| PVW | PVW Resources | 19% | 22% | 279% | 330% | 0.645 | $47,104,875.00 |
| HAS | Hastings Tech Metals | 18% | 7% | 41% | 29% | 0.29 | $504,156,884.35 |
| LEL | Lithium Energy | 18% | 21% | 81% | 0% | 1.175 | $48,375,000.00 |
| VMC | Venus Metals | 16% | 26% | 23% | -9% | 0.215 | $32,481,916.85 |
| NC1 | Nico Resources | 16% | 0% | 0% | 0% | 0.55 | $43,625,001.00 |
| KGD | Kula Gold | 15% | 4% | -4% | 21% | 0.047 | $10,328,430.34 |
| BNR | Bulletin Resources | 14% | 50% | 94% | 58% | 0.12 | $29,143,545.59 |
| AOU | Auroch Minerals | 14% | 9% | -32% | -52% | 0.125 | $43,326,215.88 |
| BUX | Buxton Resources | 13% | 23% | -19% | 20% | 0.085 | $10,340,212.83 |
| LRS | Latin Resources | 13% | 6% | -15% | -36% | 0.034 | $42,992,287.89 |
| AVZ | AVZ Minerals | 13% | -8% | 260% | 328% | 0.7925 | $2,623,567,940.80 |
| QXR | Qx Resources | 13% | 33% | 238% | 144% | 0.044 | $29,847,942.12 |
| CHR | Charger Metals | 13% | 69% | 88% | 0% | 0.81 | $25,784,983.18 |
| RBX | Resource Base | 13% | 20% | 36% | 562% | 0.225 | $9,187,944.55 |
| TEM | Tempest Minerals | 13% | 8% | 52% | -1% | 0.027 | $9,549,621.55 |
| FRB | Firebird Metals | 12% | -6% | -23% | 0% | 0.385 | $17,418,293.76 |
| NVA | Nova Minerals | 11% | -22% | -19% | -43% | 0.89 | $153,171,942.25 |
| AZL | Arizona Lithium | 11% | 48% | 356% | 269% | 0.155 | $309,622,800.53 |
| EFE | Eastern Resources | 11% | 2% | 288% | 564% | 0.062 | $57,084,143.69 |
| AZL | Arizona Lithium | 11% | 48% | 356% | 269% | 0.155 | $309,622,800.53 |
| SRL | Sunrise | 11% | 4% | -10% | -28% | 1.92 | $176,963,732.24 |
| GMC | Gulf Manganese Corp | 10% | 10% | 10% | 10% | 0.0055 | $29,718,965.83 |
| AAJ | Aruma Resources | 10% | 8% | 53% | 0% | 0.09 | $10,832,689.26 |
| CWX | Carawine Resources | 10% | -3% | -23% | -21% | 0.17 | $22,742,667.26 |
| MQR | Marquee Resource | 10% | -2% | 146% | 123% | 0.1425 | $27,880,463.26 |
| S32 | South32 Limited | 10% | 8% | 42% | 59% | 4.22 | $19,297,212,624.95 |
| REE | Rarex Limited | 10% | 16% | 15% | -8% | 0.115 | $50,804,235.45 |
| LMG | Latrobe Magnesium | 10% | 15% | 576% | 342% | 0.115 | $164,618,264.16 |
| ARN | Aldoro Resources | 9% | 8% | -15% | 56% | 0.405 | $34,433,856.77 |
| GED | Golden Deeps | 9% | 9% | 0% | -8% | 0.012 | $9,310,217.28 |
| CTM | Centaurus Metals | 9% | 13% | 28% | 42% | 1.215 | $513,880,347.42 |
| BRB | Breaker Resources | 9% | -13% | 53% | 20% | 0.245 | $76,572,618.32 |
| ALY | Alchemy Resources | 8% | 0% | -11% | -26% | 0.013 | $12,380,483.57 |
| AZS | Azure Minerals | 8% | 19% | 69% | -16% | 0.415 | $125,847,967.01 |
| VR8 | Vanadium Resources | 8% | 9% | 66% | 113% | 0.083 | $36,902,765.17 |
| NMT | Neometals | 8% | -3% | 107% | 338% | 1.415 | $770,468,836.38 |
| GBR | Greatbould Resources | 7% | 11% | 55% | 265% | 0.15 | $51,799,192.31 |
| TKL | Traka Resources | 7% | 15% | 7% | -29% | 0.015 | $9,331,618.41 |
| CMO | Cosmometalslimited | 7% | 0% | 0% | 0% | 0.225 | $5,739,750.00 |
| BKT | Black Rock Mining | 7% | -2% | 48% | 59% | 0.23 | $199,788,478.80 |
| AUZ | Australian Mines | 7% | 7% | -4% | -21% | 0.1925 | $81,767,962.43 |
| FRS | Forrestaniaresources | 7% | 11% | 0% | 0% | 0.39 | $10,659,000.00 |
| KOR | Korab Resources | 6% | -4% | 150% | 285% | 0.05 | $17,985,450.00 |
| CZN | Corazon | 6% | -11% | -17% | -43% | 0.034 | $10,380,797.28 |
| SYA | Sayona Mining | 6% | -6% | 22% | 221% | 0.1275 | $886,907,635.25 |
| TMB | Tambourahmetals | 6% | 0% | 0% | 0% | 0.255 | $10,298,149.50 |
| E25 | Element 25 | 6% | -18% | -29% | -21% | 1.32 | $196,232,824.17 |
| BHP | BHP Group Limited | 6% | 12% | -6% | 12% | 49.07 | $239,903,495,974.10 |
| ILU | Iluka Resources | 6% | 5% | 15% | 68% | 10.93 | $4,600,209,457.54 |
| FGR | First Graphene | 6% | -7% | -10% | -32% | 0.19 | $99,057,777.48 |
| MMC | Mitremining | 6% | -3% | 0% | 0% | 0.19 | $5,146,169.00 |
| S2R | S2 Resources | 6% | -5% | 19% | 3% | 0.19 | $65,929,348.18 |
| VRC | Volt Resources | 5% | -31% | -20% | 25% | 0.02 | $50,849,265.95 |
| EMN | Euromanganese | 5% | -8% | -29% | -26% | 0.505 | $131,154,525.87 |
| BSX | Blackstone | 5% | 10% | 56% | 21% | 0.615 | $280,998,478.13 |
| ARU | Arafura Resource | 5% | -2% | 58% | -7% | 0.205 | $310,083,466.40 |
| HYM | Hyperion Metals | 5% | 1% | -5% | 93% | 0.945 | $129,724,296.63 |
| MCR | Mincor Resources NL | 5% | -7% | 35% | 59% | 1.705 | $823,390,512.00 |
| ARL | Ardea Resources | 5% | 48% | 39% | 65% | 0.675 | $95,792,851.11 |
| BOA | Boadicea Resources | 5% | -6% | 2% | -13% | 0.225 | $16,705,477.43 |
| MIN | Mineral Resources. | 5% | -2% | -2% | 66% | 57.98 | $11,140,273,946.89 |
| CXO | Core Lithium | 5% | 26% | 119% | 151% | 0.79 | $1,321,576,814.22 |
| AXE | Archer Materials | 5% | 2% | -26% | 35% | 1.13 | $280,988,779.95 |
| OZL | OZ Minerals | 5% | -13% | 13% | 35% | 25.28 | $8,348,047,424.46 |
| BMM | Balkanminingandmin | 4% | -20% | -39% | 0% | 0.37 | $12,772,500.00 |
| MNS | Magnis Energy Tech | 4% | -3% | 23% | 55% | 0.51 | $497,365,762.43 |
| PLL | Piedmont Lithium Inc | 4% | -8% | -15% | 2% | 0.67 | $378,077,941.00 |
| AGY | Argosy Minerals | 4% | 1% | 140% | 117% | 0.3475 | $450,834,721.05 |
| NKL | Nickelx | 4% | 21% | -24% | 0% | 0.145 | $8,025,750.00 |
| IGO | IGO Limited | 3% | 3% | 25% | 91% | 12.16 | $9,094,786,434.13 |
| STK | Strickland Metals | 3% | -13% | 48% | 113% | 0.062 | $80,625,688.48 |
| FG1 | Flynngold | 3% | 0% | 0% | 0% | 0.16 | $10,249,768.00 |
| SGQ | St George Min | 3% | -3% | 0% | -32% | 0.068 | $39,475,792.78 |
| LYC | Lynas Rare Earths | 3% | -17% | 22% | 88% | 9.215 | $8,266,089,834.64 |
| QPM | Queensland Pacific | 3% | -5% | -10% | 169% | 0.175 | $270,044,797.93 |
| OMH | OM Holdings Limited | 3% | -2% | 20% | 25% | 0.91 | $672,147,236.67 |
| PLS | Pilbara Min | 3% | -6% | 57% | 234% | 3.29 | $9,972,268,331.95 |
| AVL | Aust Vanadium | 3% | 21% | 71% | 64% | 0.041 | $131,765,196.12 |
| NIC | Nickel Mines Limited | 2% | 3% | 34% | 17% | 1.4625 | $3,684,517,559.72 |
| JMS | Jupiter Mines. | 2% | 5% | -26% | -23% | 0.225 | $450,567,937.59 |
| LPI | Lithium Pwr Int | 2% | 26% | 114% | 140% | 0.695 | $235,419,647.40 |
| EUR | European Lithium | 2% | -13% | 73% | 75% | 0.1175 | $136,359,785.88 |
| LIT | Lithium Australia NL | 2% | 2% | -13% | -22% | 0.1175 | $123,908,471.52 |
| LTR | Liontown Resources | 2% | -6% | 75% | 309% | 1.45 | $3,145,843,159.13 |
| LOT | Lotus Resources | 2% | -21% | 47% | 79% | 0.25 | $234,239,746.80 |
| MAN | Mandrake Res | 2% | -2% | -39% | -40% | 0.05 | $23,089,827.36 |
| PAN | Panoramic Resources | 2% | -11% | 47% | 56% | 0.25 | $512,728,501.00 |
| POS | Poseidon Nick | 2% | -5% | -9% | 33% | 0.1 | $306,395,952.60 |
| FFX | Firefinch | 2% | -23% | 52% | 235% | 0.6525 | $748,116,487.00 |
| ASN | Anson Resources | 2% | -2% | 49% | 51% | 0.1375 | $137,888,902.80 |
| BYH | Bryah Resources | 2% | 16% | 8% | -10% | 0.057 | $12,667,601.80 |
| GME | GME Resources | 2% | 20% | 26% | -14% | 0.067 | $36,827,427.24 |
| NWC | New World Resources | 1% | -12% | -8% | 39% | 0.068 | $110,031,044.72 |
| AKE | Allkem Limited | 1% | -16% | 8% | 89% | 9.15 | $5,795,107,576.74 |
| RXL | Rox Resources | 1% | 25% | 1% | -21% | 0.425 | $65,960,493.01 |
| VML | Vital Metals Limited | 1% | -8% | -15% | 13% | 0.0495 | $208,274,154.20 |
| IXR | Ionic Rare Earths | 1% | 13% | 109% | 63% | 0.0585 | $201,243,071.33 |
| TLG | Talga Group | 1% | -11% | 9% | 1% | 1.47 | $457,056,778.50 |
| CHN | Chalice Mining | 1% | -6% | 17% | 99% | 7.76 | $2,818,886,383.56 |
| VIA | Viagold Rare Earth | 0% | 0% | 2339% | 4662% | 2 | $166,624,808.00 |
| A8G | Australasian Metals | 0% | -8% | 269% | 0% | 0.535 | $21,491,214.29 |
| LPD | Lepidico | 0% | -8% | 61% | 32% | 0.037 | $230,772,967.99 |
| DEV | Devex Resources | 0% | -7% | 70% | 89% | 0.425 | $135,099,106.67 |
| QEM | QEM Limited | 0% | -10% | 6% | 84% | 0.18 | $20,416,199.94 |
| ESR | Estrella Res | 0% | 43% | -15% | -58% | 0.033 | $37,665,399.68 |
| SBR | Sabre Resources | 0% | 0% | 25% | -29% | 0.005 | $10,174,068.25 |
| PGM | Platina Resources | 0% | -19% | -43% | -6% | 0.05 | $21,719,117.10 |
| BEM | Blackearth Minerals | 0% | -17% | -4% | 40% | 0.125 | $32,441,546.64 |
| SYR | Syrah Resources | 0% | -9% | 8% | 48% | 1.65 | $822,912,292.95 |
| EGR | Ecograf Limited | 0% | -13% | -35% | -12% | 0.615 | $274,703,409.99 |
| GAL | Galileo Mining | 0% | -10% | -44% | -49% | 0.19 | $31,997,748.95 |
| RMX | Red Mount Min | 0% | 10% | 22% | -31% | 0.011 | $16,423,638.58 |
| AQD | Ausquest Limited | 0% | -10% | -10% | -10% | 0.018 | $14,834,686.01 |
| LML | Lincoln Minerals | 0% | 0% | 0% | 0% | 0.008 | $4,599,869.49 |
| TON | Triton Min | 0% | 0% | 0% | -43% | 0.033 | $39,769,093.66 |
| EVR | Ev Resources | 0% | 7% | 110% | 86% | 0.065 | $58,100,746.47 |
| EMS | Eastern Metals | 0% | 20% | 0% | 0% | 0.24 | $8,188,000.00 |
| RAG | Ragnar Metals | 0% | 5% | -22% | -32% | 0.039 | $14,907,395.56 |
| GRE | Greentechmetals | 0% | 2% | 0% | 0% | 0.3 | $8,272,499.70 |
| PEK | Peak Rare Earths | -1% | -12% | -19% | -32% | 0.745 | $147,422,208.00 |
| ATM | Aneka Tambang | -1% | -1% | 9% | 9% | 1.09 | $1,420,977.41 |
| PSC | Prospect Resources | -1% | -4% | 130% | 372% | 0.85 | $372,815,475.45 |
| LEG | Legend Mining | -1% | 13% | -25% | -39% | 0.07 | $184,594,093.31 |
| GLN | Galan Lithium | -2% | -15% | 15% | 194% | 1.5 | $442,320,430.01 |
| AR3 | Austrare | -2% | -5% | 17% | 0% | 0.875 | $65,954,769.98 |
| COB | Cobalt Blue | -2% | 19% | 104% | 78% | 0.57 | $174,592,088.13 |
| VUL | Vulcan Energy | -2% | -9% | -32% | 0% | 9.02 | $1,185,784,457.98 |
| PRL | Province Resources | -2% | -9% | -9% | 563% | 0.1325 | $146,855,775.43 |
| NTU | Northern Minerals | -2% | -6% | 25% | 2% | 0.05 | $242,825,814.95 |
| GSM | Golden State Mining | -2% | 9% | -36% | -36% | 0.093 | $7,394,830.67 |
| GW1 | Greenwing Resources | -2% | -2% | 81% | 42% | 0.425 | $46,584,244.59 |
| GL1 | Global Lithium | -2% | 17% | 403% | 0% | 1.485 | $204,180,861.00 |
| JRV | Jervois Global | -2% | 5% | 34% | 37% | 0.625 | $948,941,163.75 |
| RLC | Reedy Lagoon | -3% | -11% | 78% | 78% | 0.032 | $17,531,431.36 |
| IMI | Infinity Mining | -3% | -18% | 0% | 0% | 0.16 | $9,200,000.00 |
| LKE | Lake Resources | -3% | -10% | 35% | 197% | 0.89 | $1,075,624,098.56 |
| CLA | Celsius Resources | -3% | 12% | 4% | -46% | 0.029 | $29,511,386.27 |
| TNG | TNG Limited | -3% | -13% | -1% | -29% | 0.0715 | $99,966,111.98 |
| G88 | Golden Mile Resources | -4% | 17% | 0% | 20% | 0.055 | $9,342,989.71 |
| WKT | Walkabout Resources | -4% | 4% | 13% | 73% | 0.26 | $119,852,904.68 |
| PUR | Pursuit Minerals | -4% | -12% | -62% | -28% | 0.023 | $21,747,631.46 |
| PNN | PepinNini Minerals | -4% | -7% | 21% | -9% | 0.455 | $27,548,241.30 |
| AM7 | Arcadia Minerals | -4% | -4% | 32% | 0% | 0.225 | $7,873,312.50 |
| KZR | Kalamazoo Resources | -4% | -10% | -14% | -39% | 0.325 | $47,188,171.55 |
| INF | Infinity Lithium | -5% | -7% | 58% | -28% | 0.1575 | $64,183,865.68 |
| PAM | Pan Asia Metals | -5% | 18% | 253% | 216% | 0.6 | $43,458,599.96 |
| CRR | Critical Resources | -5% | 89% | 285% | 257% | 0.1 | $132,795,411.40 |
| AX8 | Accelerate Resources | -5% | 11% | -9% | -20% | 0.039 | $9,377,979.26 |
| MOH | Moho Resources | -5% | -7% | -19% | -32% | 0.054 | $6,540,320.90 |
| DTM | Dart Mining | -5% | -8% | -25% | -52% | 0.079 | $9,585,801.61 |
| WR1 | Winsome Resources | -6% | 15% | 0% | 0% | 0.42 | $58,490,097.39 |
| SLZ | Sultan Resources | -6% | -6% | -11% | -20% | 0.16 | $13,325,502.24 |
| ESS | Essential Metals | -6% | 129% | 176% | 224% | 0.47 | $114,253,365.96 |
| AML | Aeon Metals | -6% | 24% | -21% | -60% | 0.046 | $40,693,017.74 |
| MRC | Mineral Commodities | -7% | 17% | -10% | -65% | 0.135 | $74,898,688.76 |
| TMT | Technology Metals | -7% | 10% | -4% | -3% | 0.33 | $67,208,258.70 |
| IPT | Impact Minerals | -7% | -7% | -4% | -35% | 0.013 | $26,309,333.95 |
| INR | Ioneer | -8% | -20% | 30% | 51% | 0.61 | $1,291,845,491.37 |
| CMX | Chemx Materials | -9% | 0% | 0% | 0% | 0.215 | $10,194,965.22 |
| EMH | European Metals Hldg | -9% | 1% | -13% | 16% | 1.39 | $196,527,751.00 |
| RFR | Rafaella Resources | -10% | -3% | -29% | -29% | 0.07 | $13,542,711.68 |
| ARR | American Rare Earths | -11% | 109% | 248% | 269% | 0.365 | $147,403,434.38 |
| MRD | Mount Ridley Mines | -11% | 14% | 100% | 167% | 0.008 | $48,717,290.19 |
| WML | Woomera Mining | -11% | 15% | -18% | -32% | 0.0195 | $13,636,661.32 |
| TSC | Twenty Seven Co. | -13% | -13% | -13% | -42% | 0.0035 | $9,312,848.67 |
| 1MC | Morella Corporation | -13% | 59% | -57% | -57% | 0.027 | $139,757,777.62 |
| HXG | Hexagon Energy | -15% | -25% | -20% | -51% | 0.056 | $24,530,760.49 |
| ADD | Adavale Resources | -17% | -20% | -42% | -35% | 0.04 | $14,789,535.73 |
| HNR | Hannans | -29% | -1% | 485% | 412% | 0.0405 | $104,250,859.04 |
| CNJ | Conico | -58% | -59% | -78% | -59% | 0.015 | $15,003,223.11 |
Weekly ASX Standouts
SHREE MINERALS (ASX:SHH) +118%
In October, SHH identified lithium potential at the ‘Dundas’ project which is interpreted to be along strike from Liontown’s (ASX:LTR) 14.8Mt ‘Anna’ resource, about 25km away.
The WA project was historically targeted for gold, which meant drilling was not assayed for lithium.
Technical studies have now confirmed the presence of both gold and numerous coarse-grained pegmatite (lithium host rock) intersections from past exploration work.
Drilling is planned, initially around and along strike of historical drillholes with recorded pegmatite intervals, following completion of statutory surveys.
RENASCOR RESOURCES (ASX:RNU) +60%
2021 punter favourite RNU has been conditionally approved for a $185m government loan to build its Siviour graphite project in South Australia.
The loan — to be provided under the Commonwealth of Australia’s $2 billion Critical Minerals Facility – should cover a huge of chunk of stage 1 start-up capital requirements of ~$200m.
A Final Investment Decision (FID) on the project is planned for later this year, RNU says.
Siviour could be among the world’s lowest cost producers of an important graphite product for EVs called purified spherical graphite (PSG).
Market data suggests an average operating cost of ~US$2,000/t for the existing PSG market, which is 100% based in China.
RNU’s gross operating cost of US$1,989/t PSG “is favourable by comparison”, it says.
Pricing agency Fastmarkets says PSG prices were up 40% over the 12 months to November 2021 to between US$3,100 and US$3,300 per tonne. Nice margin.

Related Stories


UNLOCK INSIGHTS
Discover the untold stories of emerging ASX stocks.
Daily news and expert analysis, it's free to subscribe.
By proceeding, you confirm you understand that we handle personal information in accordance with our Privacy Policy.


