High Voltage: Cobalt supply deficits are about to get very serious

Pic: Jill Lehmann Photography, Moment/ Via Getty Images.
- Cobalt deficit starts to widen from 2024, with no end in sight
- Labor’s election victory good for “battery material stocks, hydrogen, or new technology”: Far East Capital
- Booming EV sales will still fall well short of 2050 targets, IEA says
Our High Voltage column wraps all the news driving ASX stocks with exposure to lithium, cobalt, graphite, nickel, rare earths, manganese, magnesium, and vanadium.
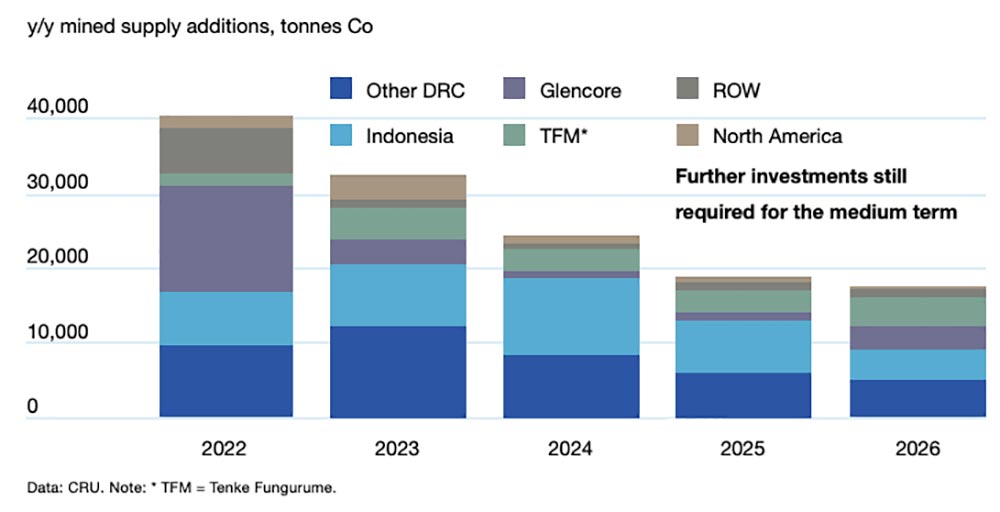
Cobalt deficit starts to widen from 2024
Following a deficit of around 14,000t in 2021, the global cobalt market is expected to be more balanced in 2022 and 2023 as supply additions keep pace with demand growth, according to the Cobalt Institute’s latest report.
But that’s as balanced as things are going to get for a while. Even then it’s a crapshoot, with supply chain bottlenecks, war and Covid-19 lockdowns in China potentially keeping prices elevated longer than expected.
“Freight routes were expected to begin to normalise in the second half of 2022, but this is now at risk of being pushed back to later in the year or even into 2023,” the Institute says.
“Until this happens, hydroxide payables will remain elevated and put pressure on refiners, and particularly metal production in China.”
From 2024, the market is forecast to shift back into a deficit.
This deficit will keep getting bigger into the medium term as supply growth fails to keep pace with demand, the Institute says.
“From 2024-26, supply growth will average 8% per year, compared to more than 12% for demand,” it says.
“Prices will remain elevated to incentivise further investment and prevent wide deficits developing.
“Supply side investment remains critical to ensure sufficient supply into the longer term as cobalt demand continues to rise even higher.”
Labor wins. Which ASX stocks benefit?
“There will be winners on the bourse with Labor taking control,” Far East capital analyst Warwick Grigor said in a weekend note.
“Foremost of these will be any company that is contributing to alternative energy, be it battery material stocks, hydrogen, or new technology.
“Money is going to be thrown at these sectors as they will be the beneficiaries of Labor’s promises to fight climate change.”
Labor plans to cut emissions by 43% of 2005 levels by 2030 compared with the former coalition government’s target of 26-28% over the same period.
EV sales to fall well short of 2050 targets: IEA
Global electric vehicle sales doubled in 2021 to 6.6 million – an impressive 10% of the total — but growth needs to go up a few gears to hit 60% of the total by 2050.
That’s the official target required to reach net zero CO2 emissions by the middle of the century.
Sales have remained strong this year thanks to sustained policy support, the IEA said, despite constrained raw materials supply and semiconductor shortages impacting production numbers.
Argus says the total number of vehicles that have been lost in North America alone since January 2021 — when global semiconductor shortages began to cut into auto production — is now 2.41 million.
The cost of minerals crucial for EV production, such as nickel, lithium and cobalt, has also increased significantly in the past year as supply lags demand.
In other words, sales are strong in 2022 but could be better.
But to hit the official 2050 target we need a shedload of mining/ downstream battery materials projects to come online sooner rather than later. That seems far-fetched.
“The IEA’s Announced Pledges Scenario — based on existing policy commitments — projects the EV share will fall short of what is required globally to reach net zero CO2 emissions by 2050,” Argus says.
“EVs will reach 30pc of total vehicle sales worldwide, but should reach 60pc to meet climate targets, the IEA estimates.”
Battery Metals Winners and Losers
Here’s how a basket of ASX stocks with exposure to lithium, cobalt, graphite, nickel, rare earths, magnesium, manganese, and vanadium is performing>>>
Battery metals stocks missing from our list? Shoot a mail to [email protected]. Be nice, he’s fragile.
| CODE | COMPANY | 1 WEEK RETURN % | 1 MONTH RETURN % | 6 MONTH RETURN % | 1 YEAR RETURN % | PRICE | MARKET CAP |
|---|---|---|---|---|---|---|---|
| RAS | Ragusa Minerals | 67% | 45% | 39% | 56% | 0.125 | $12,565,783.00 |
| NC1 | Nicoresourceslimited | 53% | -21% | 0% | 0% | 1.37 | $115,170,002.64 |
| ALY | Alchemy Resource | 35% | 0% | 125% | 62% | 0.027 | $26,686,073.60 |
| ESR | Estrella Res | 30% | 13% | -21% | -48% | 0.026 | $28,816,356.96 |
| EMS | Eastern Metals | 27% | -10% | -16% | 0% | 0.2025 | $7,120,000.00 |
| CHN | Chalice Mining | 23% | -6% | -28% | -10% | 6.67 | $2,368,006,571.58 |
| RAG | Ragnar Metals | 22% | -10% | 2% | -22% | 0.045 | $16,304,950.23 |
| SCN | Scorpion Minerals | 21% | 40% | 57% | 75% | 0.105 | $34,842,275.16 |
| S2R | S2 Resources | 20% | 16% | -18% | 9% | 0.18 | $62,365,599.63 |
| LRS | Latin Resources | 19% | -34% | 205% | 89% | 0.125 | $241,102,230.75 |
| LEL | Lithenergy | 19% | 39% | 33% | 194% | 1.38 | $57,340,500.00 |
| AKE | Allkem Limited | 19% | 6% | 39% | 121% | 13.55 | $8,276,801,956.28 |
| PAM | Pan Asia Metals | 18% | -6% | 0% | 312% | 0.515 | $33,882,976.24 |
| EMT | Emetals Limited | 17% | 0% | -18% | -50% | 0.014 | $11,900,000.00 |
| ODE | Odessa Minerals | 17% | -5% | 320% | 425% | 0.021 | $9,668,719.94 |
| RLC | Reedy Lagoon Corp. | 16% | -17% | -33% | 71% | 0.029 | $15,902,359.67 |
| A8G | Australasian Metals | 15% | -18% | -25% | 144% | 0.415 | $16,056,492.66 |
| MRC | Mineral Commodities | 15% | -8% | -4% | -45% | 0.115 | $61,523,922.91 |
| ESS | Essential Metals | 14% | -16% | 167% | 532% | 0.575 | $132,738,877.44 |
| ASN | Anson Resources | 14% | -4% | -11% | 119% | 0.125 | $123,349,480.20 |
| GED | Golden Deeps | 13% | -11% | 42% | 55% | 0.017 | $19,637,708.88 |
| PLS | Pilbara Min | 13% | 6% | 16% | 171% | 2.925 | $8,364,904,082.33 |
| AOA | Ausmon Resorces | 13% | -10% | 13% | 50% | 0.009 | $7,715,604.09 |
| INR | Ioneer | 12% | -18% | -20% | 60% | 0.545 | $1,160,671,178.10 |
| SRL | Sunrise | 12% | -7% | 63% | 51% | 3.09 | $269,273,058.21 |
| POS | Poseidon Nick | 12% | -19% | -30% | 12% | 0.073 | $229,796,964.45 |
| IGO | IGO Limited | 12% | -12% | 16% | 64% | 11.91 | $8,822,170,021.45 |
| NKL | Nickelx | 12% | 37% | 61% | 32% | 0.185 | $11,488,500.00 |
| QPM | Queensland Pacific | 12% | -7% | -21% | 48% | 0.1625 | $257,996,166.62 |
| AZS | Azure Minerals | 12% | -21% | -22% | 4% | 0.28 | $87,006,001.88 |
| ARU | Arafura Resource | 12% | 1% | 74% | 127% | 0.375 | $573,654,412.84 |
| NWM | Norwest Minerals | 12% | -15% | -40% | -48% | 0.047 | $8,307,939.80 |
| MCR | Mincor Resources NL | 12% | 1% | 97% | 155% | 2.46 | $1,167,324,703.77 |
| GAL | Galileo Mining | 12% | 290% | 315% | 224% | 0.955 | $176,829,665.25 |
| AXE | Archer Materials | 12% | -14% | -48% | 11% | 0.765 | $200,772,437.67 |
| DTM | Dart Mining NL | 12% | -12% | -30% | -55% | 0.067 | $9,087,837.89 |
| PLL | Piedmont Lithium Inc | 11% | -15% | -3% | 6% | 0.83 | $437,883,764.00 |
| CXO | Core Lithium | 11% | -5% | 128% | 450% | 1.32 | $2,304,029,654.92 |
| MIN | Mineral Resources. | 11% | 1% | 39% | 42% | 61.18 | $11,283,963,563.88 |
| FGR | First Graphene | 11% | -6% | -25% | -40% | 0.15 | $84,005,066.40 |
| GT1 | Greentechnology | 11% | -20% | 108% | 0% | 0.875 | $119,884,160.00 |
| SLZ | Sultan Resources | 11% | 0% | 0% | -45% | 0.155 | $12,909,080.30 |
| MQR | Marquee Resource | 11% | -28% | -16% | 59% | 0.105 | $31,174,848.50 |
| PGD | Peregrine Gold | 10% | -4% | 31% | 44% | 0.49 | $18,760,467.81 |
| CNJ | Conico | 10% | 92% | -42% | -20% | 0.023 | $29,906,424.73 |
| AM7 | Arcadia Minerals | 10% | -26% | 7% | 0% | 0.23 | $7,698,350.00 |
| NIC | Nickel Mines Limited | 9% | 7% | -3% | 33% | 1.27 | $3,536,999,178.62 |
| JRV | Jervois Global | 9% | 0% | 70% | 91% | 0.9025 | $1,360,177,110.10 |
| AGY | Argosy Minerals | 9% | -15% | 39% | 366% | 0.41 | $548,676,512.91 |
| GSR | Greenstone Resources | 9% | 34% | 62% | 124% | 0.047 | $43,073,323.38 |
| CML | Chase Mining Limited | 9% | -25% | -20% | -37% | 0.012 | $5,617,593.13 |
| ILU | Iluka Resources | 9% | -3% | 27% | 43% | 10.82 | $4,454,482,693.50 |
| FFX | Firefinch | 9% | -14% | 38% | 105% | 0.9425 | $1,139,899,708.27 |
| LYC | Lynas Rare Earths | 9% | 2% | 12% | 84% | 9.63 | $8,572,909,763.00 |
| SYR | Syrah Resources | 9% | 6% | 57% | 80% | 1.84 | $1,218,183,370.04 |
| TMT | Technology Metals | 8% | -20% | 18% | 16% | 0.395 | $81,337,576.71 |
| CRR | Critical Resources | 8% | -25% | 55% | 172% | 0.079 | $120,496,648.14 |
| LNR | Lanthanein Resources | 8% | -16% | 4% | 86% | 0.027 | $22,621,290.39 |
| OZL | OZ Minerals | 8% | -6% | -12% | -10% | 23.15 | $7,558,542,980.62 |
| CTM | Centaurus Metals | 8% | -20% | 4% | 57% | 1.165 | $486,901,151.22 |
| WR1 | Winsome Resources | 8% | -17% | 0% | 0% | 0.415 | $57,423,447.45 |
| 1MC | Morella Corporation | 8% | -26% | -56% | -56% | 0.028 | $139,757,777.62 |
| MLS | Metals Australia | 8% | -39% | 63% | 145% | 0.098 | $41,325,232.37 |
| EVR | Ev Resources | 8% | -29% | -21% | 68% | 0.042 | $40,743,299.12 |
| EVR | Ev Resources | 8% | -29% | -21% | 68% | 0.042 | $40,743,299.12 |
| LTR | Liontown Resources | 8% | -15% | -24% | 247% | 1.34 | $2,838,931,631.41 |
| FG1 | Flynngold | 7% | -6% | -17% | 0% | 0.145 | $9,288,852.25 |
| NVA | Nova Minerals | 7% | -14% | -56% | -53% | 0.655 | $119,834,519.53 |
| RGL | Riversgold | 7% | -39% | 137% | 10% | 0.044 | $26,857,966.42 |
| ARL | Ardea Resources | 7% | -39% | 105% | 145% | 1.125 | $190,954,993.50 |
| CWX | Carawine Resources | 7% | -25% | -29% | -41% | 0.15 | $20,675,152.05 |
| KFM | Kingfisher Mining | 7% | -11% | 38% | 22% | 0.2625 | $8,732,475.26 |
| WIN | Widgienickellimited | 7% | -22% | 81% | 0% | 0.39 | $98,829,000.00 |
| BRB | Breaker Res NL | 7% | -16% | -41% | 31% | 0.235 | $79,831,027.61 |
| FTL | Firetail Resources | 7% | -19% | 0% | 0% | 0.325 | $19,770,400.00 |
| GBR | Greatbould Resources | 6% | -21% | -29% | -1% | 0.099 | $41,765,345.13 |
| S32 | South32 Limited | 6% | -3% | 31% | 63% | 4.68 | $21,688,850,579.62 |
| BOA | Boadicea Resources | 6% | -19% | -19% | -46% | 0.17 | $13,597,481.63 |
| QXR | Qx Resources Limited | 6% | -28% | 108% | 247% | 0.052 | $41,249,391.41 |
| BNR | Bulletin Res | 6% | -23% | 112% | 167% | 0.18 | $50,765,942.50 |
| BHP | BHP Group Limited | 6% | -1% | 26% | 0% | 47.86 | $242,130,918,177.70 |
| LPD | Lepidico | 6% | -27% | -38% | 119% | 0.0285 | $179,476,807.69 |
| ASO | Aston Minerals | 6% | -5% | 14% | -23% | 0.1425 | $164,184,812.70 |
| PGM | Platina Resources | 5% | -26% | -41% | -35% | 0.039 | $14,768,999.63 |
| QEM | QEM Limited | 5% | -18% | -7% | 5% | 0.2 | $25,542,334.02 |
| VRC | Volt Resources | 5% | -26% | -29% | -50% | 0.02 | $64,132,275.54 |
| AQD | Ausquest Limited | 5% | -9% | 18% | -5% | 0.02 | $16,502,984.46 |
| BMM | Balkanminingandmin | 5% | -15% | -39% | 0% | 0.3 | $9,825,000.00 |
| BSX | Blackstone | 5% | -18% | -46% | -19% | 0.305 | $138,723,031.68 |
| NTU | Northern Min | 5% | -17% | -38% | 23% | 0.043 | $204,103,044.56 |
| IPT | Impact Minerals | 5% | -24% | -19% | -29% | 0.011 | $21,904,615.86 |
| KOR | Korab Resources | 5% | -13% | -48% | 120% | 0.033 | $11,011,500.00 |
| GLN | Galan Lithium | 5% | -25% | -5% | 115% | 1.45 | $435,291,087.66 |
| GSM | Golden State Mining | 5% | -19% | -28% | -50% | 0.068 | $7,059,396.34 |
| BEM | Blackearth Minerals | 5% | -21% | -21% | -15% | 0.1025 | $27,710,487.76 |
| ARR | American Rare Earths | 4% | -14% | 100% | 355% | 0.35 | $138,444,227.60 |
| RNU | Renascor Res | 4% | -24% | 96% | 222% | 0.235 | $516,424,730.40 |
| HAS | Hastings Tech Met | 4% | -11% | -4% | 48% | 0.245 | $517,381,041.05 |
| GME | GME Resources | 4% | -17% | 92% | 116% | 0.125 | $68,308,937.63 |
| OMH | OM Holdings Limited | 4% | -2% | -10% | 1% | 0.875 | $642,602,303.19 |
| E25 | Element 25 | 4% | -31% | -41% | -70% | 0.65 | $106,133,706.46 |
| THR | Thor Mining PLC | 4% | -19% | -19% | -35% | 0.013 | $13,753,238.41 |
| MRR | Minrex Resources | 4% | -24% | 157% | 125% | 0.054 | $53,461,921.98 |
| KAI | Kairos Minerals | 4% | -10% | -7% | -18% | 0.027 | $52,976,524.26 |
| CZN | Corazon | 4% | -15% | -16% | -19% | 0.028 | $17,699,586.15 |
| HXG | Hexagon Energy | 4% | -36% | -68% | -68% | 0.028 | $14,361,645.23 |
| COB | Cobalt Blue | 4% | -1% | 123% | 169% | 0.86 | $272,686,003.55 |
| EGR | Ecograf Limited | 4% | -23% | -32% | -25% | 0.43 | $189,140,052.78 |
| AZL | Arizona Lithium | 4% | -22% | 32% | 383% | 0.145 | $346,071,477.86 |
| TON | Triton Min | 4% | -15% | -28% | -29% | 0.029 | $36,504,741.13 |
| AZL | Arizona Lithium | 4% | -22% | 32% | 383% | 0.145 | $346,071,477.86 |
| BUX | Buxton Resources | 3% | -9% | 1% | -5% | 0.09 | $13,416,276.65 |
| VUL | Vulcan Energy | 3% | -16% | -28% | 12% | 7.43 | $988,654,625.90 |
| LRV | Larvottoresources | 3% | -39% | 0% | 0% | 0.31 | $12,362,250.00 |
| PVW | PVW Res | 3% | -14% | -23% | 143% | 0.34 | $29,301,890.63 |
| TLG | Talga Group | 3% | -16% | -23% | -12% | 1.335 | $408,665,855.46 |
| CHR | Charger Metals | 3% | -23% | 34% | 0% | 0.575 | $18,245,379.60 |
| STK | Strickland Metals | 3% | 15% | 7% | 221% | 0.077 | $103,747,999.50 |
| BKT | Black Rock Mining | 3% | -32% | 3% | 28% | 0.205 | $200,324,366.56 |
| WML | Woomera Mining | 3% | -34% | 8% | -6% | 0.0205 | $15,110,327.45 |
| TMB | Tambourahmetals | 2% | -22% | -16% | 0% | 0.21 | $8,856,408.57 |
| CMX | Chemxmaterials | 2% | -13% | 0% | 0% | 0.225 | $10,426,668.98 |
| KZR | Kalamazoo Resources | 2% | -25% | -5% | -25% | 0.3525 | $52,995,946.51 |
| AS2 | Askarimetalslimited | 2% | -28% | 144% | 0% | 0.5 | $21,621,391.48 |
| VML | Vital Metals Limited | 2% | -22% | -13% | 0% | 0.052 | $204,353,671.12 |
| PAN | Panoramic Resources | 2% | -19% | 17% | 74% | 0.27 | $533,237,641.04 |
| LKE | Lake Resources | 2% | -31% | 69% | 444% | 1.47 | $2,002,766,089.94 |
| GW1 | Greenwing Resources | 2% | -32% | -26% | 7% | 0.32 | $39,439,151.68 |
| GL1 | Globallith | 2% | -21% | 140% | 576% | 1.655 | $268,993,543.92 |
| ZNC | Zenith Minerals | 1% | -16% | 61% | 28% | 0.37 | $123,805,495.80 |
| EUR | European Lithium | 1% | -27% | -45% | 38% | 0.077 | $109,250,177.24 |
| AAJ | Aruma Resources | 1% | -32% | -1% | 18% | 0.078 | $12,086,035.73 |
| DEV | Devex Resources | 1% | -32% | -40% | 41% | 0.395 | $116,248,068.53 |
| MNS | Magnis Energy Tech | 1% | -14% | -33% | 38% | 0.4 | $391,426,558.25 |
| REE | Rarex Limited | 1% | -20% | -24% | -8% | 0.08 | $44,453,640.96 |
| MNS | Magnis Energy Tech | 1% | -14% | -33% | 38% | 0.4 | $391,426,558.25 |
| CAI | Calidus Resources | 1% | -19% | 32% | 96% | 0.825 | $337,929,486.72 |
| LOT | Lotus Resources | 1% | -26% | -15% | 37% | 0.2675 | $274,075,343.08 |
| VIA | Viagold Rare Earth | 0% | 0% | 0% | 2339% | 2 | $166,624,808.00 |
| INF | Infinity Lithium | 0% | -23% | -29% | 101% | 0.135 | $53,951,698.58 |
| PSC | Prospect Res | 0% | -1% | 39% | 491% | 0.945 | $414,837,158.35 |
| HNR | Hannans | 0% | -29% | -40% | 247% | 0.024 | $65,156,786.90 |
| MRD | Mount Ridley Mines | 0% | -16% | 0% | 33% | 0.008 | $46,797,560.75 |
| AVZ | AVZ Minerals | 0% | -28% | 11% | 420% | 0.78 | $2,752,409,203.44 |
| CLA | Celsius Resource | 0% | -20% | -29% | -53% | 0.02 | $24,429,315.36 |
| SRI | Sipa Resources | 0% | -20% | -26% | -29% | 0.039 | $7,995,967.32 |
| RXL | Rox Resources | 0% | -21% | -14% | -34% | 0.325 | $55,750,512.51 |
| ATM | Aneka Tambang | 0% | 5% | 21% | 25% | 1.25 | $1,629,561.25 |
| TNG | TNG Limited | 0% | -18% | -8% | -16% | 0.07 | $97,189,275.54 |
| MMC | Mitremining | 0% | -22% | -31% | 0% | 0.145 | $3,927,339.50 |
| LML | Lincoln Minerals | 0% | 0% | 0% | 0% | 0.008 | $4,599,869.49 |
| PEK | Peak Rare Earths | 0% | -30% | -25% | -46% | 0.5 | $99,527,297.76 |
| AR3 | Austrare | 0% | -36% | -50% | 0% | 0.455 | $34,143,666.75 |
| RFR | Rafaella Resources | 0% | -11% | -43% | -60% | 0.04 | $9,211,022.36 |
| EFE | Eastern Resources | 0% | -26% | -50% | 164% | 0.037 | $37,788,591.98 |
| LSR | Lodestar Minerals | 0% | -33% | 0% | -9% | 0.01 | $17,384,373.48 |
| WCN | White Cliff Min | 0% | -31% | 54% | 33% | 0.02 | $13,725,670.60 |
| LMG | Latrobe Magnesium | 0% | -13% | -26% | 268% | 0.07 | $115,465,791.67 |
| CMO | Cosmometalslimited | 0% | -24% | 0% | 0% | 0.14 | $3,571,400.00 |
| FRB | Firebird Metals | 0% | -3% | -28% | -42% | 0.33 | $17,320,976.64 |
| JMS | Jupiter Mines. | 0% | -14% | 5% | -27% | 0.215 | $411,388,116.93 |
| ENT | Enterprise Metals | 0% | -36% | 8% | -39% | 0.014 | $9,025,055.97 |
| ENV | Enova Mining Limited | 0% | -10% | -22% | -18% | 0.018 | $6,095,859.19 |
| AVW | Avira Resources | 0% | -23% | -17% | -29% | 0.005 | $10,593,950.00 |
| SRZ | Stellar Resources | 0% | -21% | -12% | 0% | 0.023 | $19,303,960.40 |
| AZI | Altamin Limited | -1% | 13% | 23% | 8% | 0.096 | $37,604,808.19 |
| LIT | Lithium Australia | -1% | -18% | -31% | -25% | 0.086 | $93,164,870.16 |
| LEG | Legend Mining | -1% | -21% | 34% | -35% | 0.071 | $192,859,500.47 |
| EMN | Euromanganese | -2% | -26% | -42% | -31% | 0.32 | $80,995,237.16 |
| LPM | Lithium Plus | -2% | 152% | 0% | 0% | 0.63 | $27,663,284.00 |
| IG6 | Internationalgraphit | -2% | -33% | 0% | 0% | 0.3 | $24,446,432.40 |
| LPI | Lithium Pwr Int | -2% | -34% | 14% | 173% | 0.56 | $199,012,563.36 |
| MLX | Metals X Limited | -2% | -32% | 29% | 110% | 0.505 | $435,487,712.16 |
| EMH | European Metals Hldg | -2% | -22% | -34% | -23% | 0.97 | $137,961,425.70 |
| PNT | Panthermetals | -2% | -10% | 0% | 0% | 0.22 | $6,580,000.00 |
| ARN | Aldoro Resources | -2% | -28% | -54% | -34% | 0.215 | $21,826,989.58 |
| SGQ | St George Min | -3% | -17% | -36% | -53% | 0.039 | $27,150,694.51 |
| PUR | Pursuit Minerals | -3% | -35% | -46% | -74% | 0.0195 | $19,856,533.07 |
| KOB | Kobaresourceslimited | -3% | 0% | 0% | 0% | 0.195 | $11,700,000.00 |
| IMI | Infinitymining | -3% | -27% | 0% | 0% | 0.16 | $9,200,000.00 |
| WC8 | Wildcat Resources | -3% | -9% | -52% | 10% | 0.032 | $20,003,454.54 |
| AOU | Auroch Minerals | -3% | -37% | -39% | -57% | 0.088 | $31,433,256.51 |
| NMT | Neometals | -3% | -26% | 17% | 186% | 1.315 | $710,147,432.82 |
| PRL | Province Resources | -3% | -11% | -48% | -50% | 0.085 | $99,601,743.75 |
| G88 | Golden Mile Res | -4% | -21% | 10% | -12% | 0.053 | $11,205,293.77 |
| AKN | Auking Mining | -4% | -24% | -33% | -72% | 0.11 | $9,730,834.16 |
| WKT | Walkabout Resources | -4% | -12% | 16% | 16% | 0.215 | $99,500,524.64 |
| VR8 | Vanadium Resources | -5% | -33% | 41% | 104% | 0.1 | $47,311,237.40 |
| SHH | Shree Minerals | -5% | -37% | -14% | -41% | 0.0095 | $12,222,368.92 |
| AML | Aeon Metals . | -5% | -38% | -22% | -52% | 0.036 | $35,824,837.74 |
| VMC | Venus Metals Cor | -5% | -13% | -10% | 3% | 0.175 | $25,683,376.11 |
| IXR | Ionic Rare Earths | -5% | -27% | 11% | 100% | 0.052 | $205,248,060.76 |
| GRE | Greentechmetals | -6% | -34% | 0% | 0% | 0.165 | $5,317,599.83 |
| MAN | Mandrake Res | -6% | -23% | -13% | -72% | 0.048 | $24,668,570.15 |
| IPX | Iperionx Limited | -6% | -33% | -6% | -15% | 0.85 | $123,453,872.08 |
| KTA | Krakatoa Resources | -6% | -41% | 38% | 15% | 0.077 | $25,853,243.78 |
| RMX | Red Mount Min | -6% | -21% | -32% | -17% | 0.0075 | $13,138,910.86 |
| STM | Sunstone Metals | -7% | -23% | -45% | 175% | 0.055 | $136,445,660.15 |
| AUZ | Australian Mines | -7% | -40% | -41% | -28% | 0.13 | $53,794,712.13 |
| JRL | Jindalee Resources | -7% | -27% | 52% | 32% | 3.43 | $196,809,853.38 |
| ADV | Ardiden | -8% | -17% | 0% | 20% | 0.012 | $29,351,688.92 |
| CZL | Cons Zinc | -8% | -20% | -20% | -38% | 0.024 | $8,432,587.51 |
| BYH | Bryah Resources | -8% | -23% | -20% | -37% | 0.044 | $9,953,115.70 |
| KGD | Kula Gold Limited | -8% | -30% | -33% | -18% | 0.033 | $7,100,795.86 |
| RR1 | Reach Resources | -8% | -31% | -31% | 50% | 0.0055 | $11,460,303.83 |
| PNN | PepinNini Minerals | -8% | -42% | -22% | 90% | 0.485 | $31,949,987.68 |
| CAE | Cannindah Resources | -9% | -20% | 43% | 314% | 0.265 | $141,441,649.61 |
| MTM | Mtmongerresources | -9% | -34% | -3% | 0% | 0.145 | $5,439,004.95 |
| AX8 | Accelerate Resources | -10% | -29% | -15% | -22% | 0.035 | $9,484,520.36 |
| FRS | Forrestaniaresources | -11% | -46% | -46% | 0% | 0.2 | $5,338,772.76 |
| TKL | Traka Resources | -11% | -20% | -38% | -50% | 0.008 | $5,510,196.49 |
| ADD | Adavale Resource | -12% | -30% | -36% | -69% | 0.03 | $10,995,410.06 |
| AVL | Aust Vanadium | -12% | -37% | 83% | 138% | 0.0475 | $167,516,113.54 |
| WMG | Western Mines | -13% | -28% | 11% | 0% | 0.205 | $7,692,825.00 |
| MOH | Moho Resources | -13% | -47% | -44% | -59% | 0.034 | $4,424,375.60 |
| NWC | New World Resources | -13% | -29% | -43% | -56% | 0.04 | $67,069,918.52 |
| CNB | Carnaby Resource | -15% | -26% | 260% | 95% | 0.935 | $139,946,871.68 |
| SYA | Sayona Mining | -18% | -42% | 35% | 579% | 0.21 | $1,687,945,673.08 |
| SBR | Sabre Resources | -20% | -33% | -33% | -20% | 0.004 | $13,945,824.27 |
| TEM | Tempest Minerals | -23% | -52% | 85% | 123% | 0.048 | $26,738,897.98 |
| TSC | Twenty Seven Co. | -25% | -25% | -33% | -40% | 0.003 | $10,643,255.62 |
| RBX | Resource B | -29% | -36% | -15% | 400% | 0.17 | $7,122,079.83 |
Related Topics
Related Stories


UNLOCK INSIGHTS
Discover the untold stories of emerging ASX stocks.
Daily news and expert analysis, it's free to subscribe.
By proceeding, you confirm you understand that we handle personal information in accordance with our Privacy Policy.


