Gold Digger: When will the gold price recover?

Pic: Flashpop, Stone/ Via Getty Images
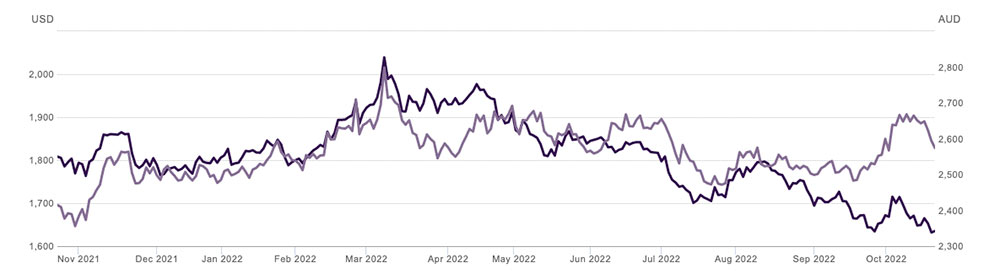
- USD gold price continues to fall, currently $US1,621/oz
- Mixed bag of results for gold producers in Q1: Perseus, Northern Star outperformers so far
- Weekly small cap standouts: Strickland metals, Medallion Metals. GBM Resources
Our Gold Digger column wraps all the news driving ASX stocks with exposure to precious metals.
‘When will gold prices come good?’
Inflation – bad for gold
Deflation – bad for gold
War – bad for gold
Stocks going up – bad for gold
Stocks going down – bad for gold
Got it!— Tangible Investing (@Tangible_Invest) October 20, 2022
A real mystery. Some of the gold price’s historic relationships are coming unstuck. A hedge against economic uncertainty and inflation?
Not this time.
This is despite near record physical demand.
Classic sign of a broken market – if you want to buy physical #gold you may have to pay up to an extra $50/oz premium for it (due to curr shortage) – but the spot gold price is falling bec of unlimited xMoz non-existent paper futures creation that doesn’t require delivery. https://t.co/aRnyzC3OAt
— Keith Goode (@Eagleresa) October 19, 2022
Even the experts are puzzled.
“Gold has been the unexpected loser of the current macroeconomic environment, with its safe-haven status in direct competition with the U.S. dollar,” said Aude Marjolin, associate commodity analyst at S&P Global Commodity Insight.
The clearest current links are with geopolitical volatility – gold briefly hit $US2,000oz in March after Russia invaded Ukraine – and the USD, which has enjoyed unprecedented strength of late.
US currency remains a stumbling block as the Fed pursues an aggressive monetary policy to battle inflation.
Historically, strong dollar = weak gold price, and vice versa.
So, what could boost the gold price? A loosening of monetary policy.
“I tend to think that Fed hawkishness is largely now ‘in the price’,” Philip Klapwijk, managing director of Hong Kong-based consultant Precious Metals Insights told livemint in an email. “That said, the scope for a near-term major rebound in gold prices is very limited while rates climb and the US dollar remains strong.”
Winners & Losers
Here’s how ASX-listed precious metals stocks are performing:
Scroll or swipe to reveal table. Click headings to sort. Best viewed on a laptop.
Stocks missing from this list? Email [email protected]
| CODE | COMPANY | 1 WEEK RETURN % | 1 MONTH RETURN % | 6 MONTH RETURN % | 1 YEAR RETURN % | PRICE | MARKET CAP |
|---|---|---|---|---|---|---|---|
| STK | Strickland Metals | 31% | 2% | -28% | -46% | 0.046 | $63,593,559 |
| NAE | New Age Exploration | 29% | 0% | -36% | -18% | 0.009 | $11,487,191 |
| AZS | Azure Minerals | 24% | 40% | -20% | -23% | 0.28 | $85,452,323 |
| MM8 | Medallion Metals | 23% | 9% | -32% | -10% | 0.19 | $26,591,461 |
| TBA | Tombola Gold | 22% | -3% | -33% | -20% | 0.033 | $36,033,120 |
| GBZ | GBM Resources | 18% | -2% | -62% | -67% | 0.046 | $22,948,269 |
| SAU | Southern Gold | 14% | -9% | -38% | -51% | 0.032 | $6,826,520 |
| BEZ | Besra Gold | 13% | 34% | -15% | -68% | 0.051 | $12,291,134 |
| PNX | PNX Metals Limited | 13% | -10% | -10% | -38% | 0.0045 | $19,998,260 |
| MCT | Metalicity Limited | 13% | -10% | -33% | -48% | 0.0045 | $15,564,177 |
| AUT | Auteco Minerals | 13% | 10% | -39% | -45% | 0.045 | $93,052,634 |
| STN | Saturn Metals | 13% | 0% | -33% | -36% | 0.27 | $35,072,778 |
| FML | Focus Minerals | 12% | 4% | -43% | -50% | 0.14 | $40,118,210 |
| FAU | First Au | 11% | -29% | -67% | -55% | 0.005 | $4,657,055 |
| AL8 | Alderan Resource | 11% | 0% | -60% | -77% | 0.01 | $5,782,661 |
| ARN | Aldoro Resources | 11% | 4% | -15% | -40% | 0.25 | $24,896,829 |
| AME | Alto Metals Limited | 10% | 7% | -14% | -29% | 0.075 | $41,159,388 |
| PRX | Prodigy Gold NL | 10% | 10% | -41% | -64% | 0.011 | $18,223,511 |
| RMX | Red Mount Min | 10% | -8% | -39% | -39% | 0.0055 | $9,033,001 |
| NVA | Nova Minerals | 10% | -13% | -16% | -56% | 0.68 | $126,726,280 |
| TAR | Taruga Minerals | 10% | 13% | 36% | -28% | 0.034 | $19,754,911 |
| DRE | Dreadnought Resources | 9% | -15% | 133% | 163% | 0.1025 | $319,466,023 |
| POL | Polymetals Resources | 9% | 15% | 90% | 31% | 0.19 | $7,824,711 |
| GSN | Great Southern | 8% | 18% | -22% | -40% | 0.045 | $25,043,816 |
| SRN | Surefire Rescs NL | 8% | -13% | -43% | -10% | 0.013 | $20,557,725 |
| ASR | Asra Minerals | 8% | -7% | 0% | -7% | 0.026 | $38,070,800 |
| RML | Resolution Minerals | 8% | 24% | -19% | -35% | 0.013 | $12,437,700 |
| VAN | Vango Mining | 8% | 0% | -26% | -34% | 0.039 | $49,137,568 |
| SNG | Siren Gold | 8% | -5% | -50% | -48% | 0.2 | $23,385,095 |
| AVM | Advance Metals | 8% | 17% | -18% | -18% | 0.014 | $6,690,284 |
| CLA | Celsius Resource | 8% | -7% | -44% | -52% | 0.014 | $21,039,607 |
| DTM | Dart Mining NL | 8% | -7% | 2% | -31% | 0.084 | $13,041,853 |
| VRC | Volt Resources | 7% | 4% | 7% | -9% | 0.029 | $96,299,250 |
| XAM | Xanadu Mines | 7% | -9% | -22% | -3% | 0.029 | $40,955,546 |
| TIE | Tietto Minerals | 7% | 39% | 31% | 48% | 0.69 | $744,873,968 |
| MEK | Meeka Metals Limited | 7% | -11% | 27% | 32% | 0.062 | $66,681,863 |
| GTR | Gti Energy | 7% | -20% | -27% | -52% | 0.016 | $22,582,254 |
| OZM | Ozaurum Resources | 7% | -24% | -20% | -47% | 0.08 | $5,577,280 |
| ERM | Emmerson Resources | 7% | 0% | -33% | 16% | 0.081 | $44,121,493 |
| PGD | Peregrine Gold | 6% | -1% | 14% | 42% | 0.595 | $23,039,326 |
| CEL | Challenger Exp | 6% | -6% | -48% | -38% | 0.17 | $177,634,913 |
| GMD | Genesis Minerals | 6% | 9% | -33% | -16% | 1.115 | $449,231,170 |
| PKO | Peako Limited | 6% | -25% | 6% | -18% | 0.018 | $6,825,275 |
| PRU | Perseus Mining | 5% | 17% | -14% | 1% | 1.69 | $2,218,434,078 |
| BTR | Brightstar Resources | 5% | 25% | -33% | -57% | 0.02 | $13,529,952 |
| X64 | Ten Sixty Four | 5% | 2% | -32% | -20% | 0.61 | $139,319,914 |
| TAM | Tanami Gold NL | 5% | -7% | -34% | -45% | 0.041 | $48,178,979 |
| BMR | Ballymore Resources | 5% | 5% | 11% | -16% | 0.21 | $15,430,397 |
| ADN | Andromeda Metals | 5% | -10% | -59% | -79% | 0.043 | $133,730,363 |
| KCN | Kingsgate Consolid. | 4% | 0% | -7% | -12% | 1.55 | $338,620,293 |
| CDT | Castle Minerals | 4% | -17% | -55% | 47% | 0.025 | $24,987,325 |
| G88 | Golden Mile Res | 4% | -21% | -56% | -47% | 0.027 | $5,523,923 |
| ADT | Adriatic Metals | 4% | -1% | -15% | -21% | 2.2 | $468,557,626 |
| VMC | Venus Metals Cor | 4% | -15% | -30% | -26% | 0.14 | $22,411,016 |
| NSM | Northstaw | 4% | -10% | -52% | -58% | 0.14 | $16,817,780 |
| AAJ | Aruma Resources | 4% | 13% | -61% | -17% | 0.0715 | $11,222,747 |
| BGD | Bartongoldholdings | 3% | 0% | -42% | -12% | 0.15 | $12,464,087 |
| AM7 | Arcadia Minerals | 3% | 11% | 15% | 39% | 0.305 | $14,009,368 |
| KTA | Krakatoa Resources | 3% | -10% | -49% | 3% | 0.061 | $21,027,305 |
| QML | Qmines Limited | 3% | 15% | -47% | -60% | 0.155 | $12,392,510 |
| ASO | Aston Minerals | 3% | -4% | -50% | -43% | 0.0795 | $88,525,709 |
| KCC | Kincora Copper | 3% | -7% | -39% | -60% | 0.064 | $4,733,874 |
| MZZ | Matador Mining | 3% | -10% | -62% | -76% | 0.099 | $27,940,271 |
| SMI | Santana Minerals | 3% | -8% | -1% | 148% | 0.67 | $98,916,983 |
| KAU | Kaiser Reef | 3% | 0% | -17% | -22% | 0.175 | $22,760,003 |
| CAI | Calidus Resources | 3% | -34% | -64% | -38% | 0.365 | $159,790,322 |
| KIN | KIN Min NL | 3% | 3% | -19% | -38% | 0.075 | $78,639,114 |
| KZR | Kalamazoo Resources | 3% | -20% | -58% | -51% | 0.195 | $26,787,487 |
| TSO | Tesoro Gold | 3% | 11% | -50% | -62% | 0.04 | $34,879,231 |
| SVG | Savannah Goldfields | 3% | -15% | -7% | 7% | 0.205 | $34,870,180 |
| SFM | Santa Fe Minerals | 2% | 2% | -28% | 9% | 0.087 | $6,335,235 |
| FEG | Far East Gold | 2% | -1% | 115% | 0% | 0.665 | $81,154,745 |
| MXR | Maximus Resources | 2% | -10% | -42% | -47% | 0.045 | $14,350,760 |
| MEU | Marmota Limited | 2% | 0% | -4% | 7% | 0.047 | $49,763,627 |
| IVR | Investigator Res | 2% | -2% | -28% | -28% | 0.048 | $62,618,742 |
| KAI | Kairos Minerals | 2% | -25% | -2% | -8% | 0.0285 | $54,994,618 |
| SVY | Stavely Minerals | 2% | -13% | -61% | -68% | 0.1525 | $49,250,585 |
| CPM | Coopermetalslimited | 1% | -8% | -19% | 0% | 0.34 | $12,643,467 |
| IGO | IGO Limited | 1% | 4% | 10% | 60% | 15.58 | $11,790,659,848 |
| HAW | Hawthorn Resources | 1% | -6% | -47% | 70% | 0.09 | $30,016,405 |
| NML | Navarre Minerals | 1% | 0% | -47% | -54% | 0.048 | $67,580,320 |
| M2R | Miramar | 1% | -5% | -43% | -44% | 0.1 | $6,418,666 |
| ARL | Ardea Resources | 1% | 1% | -53% | 85% | 0.905 | $159,553,506 |
| NPM | Newpeak Metals | 0% | 0% | 0% | -50% | 0.001 | $8,853,750 |
| FFX | Firefinch | 0% | 0% | -48% | -11% | 0.2 | $236,248,644 |
| AQX | Alice Queen | 0% | 0% | -57% | -70% | 0.003 | $4,400,500 |
| GIB | Gibb River Diamonds | 0% | -4% | -15% | -30% | 0.055 | $11,633,019 |
| BNR | Bulletin Res | 0% | -14% | -49% | 71% | 0.12 | $35,110,932 |
| SKY | SKY Metals | 0% | -9% | -52% | -50% | 0.05 | $18,839,174 |
| IPT | Impact Minerals | 0% | -7% | -55% | -52% | 0.007 | $17,369,594 |
| RND | Rand Mining | 0% | -4% | -9% | -9% | 1.43 | $81,332,624 |
| WCN | White Cliff Min | 0% | -19% | -37% | 46% | 0.019 | $14,204,464 |
| CTO | Citigold Corp | 0% | 0% | -25% | -40% | 0.006 | $17,001,955 |
| TRY | Troy Resources | 0% | 0% | 0% | 0% | 0.0295 | $62,920,961 |
| CGN | Crater Gold Min | 0% | 0% | 0% | 0% | 0.017 | $21,063,474 |
| G50 | Gold50Limited | 0% | -14% | -52% | -51% | 0.12 | $6,833,160 |
| ADV | Ardiden | 0% | -13% | -53% | -36% | 0.007 | $18,678,347 |
| VKA | Viking Mines | 0% | -13% | -42% | -67% | 0.007 | $7,176,809 |
| LCL | Los Cerros Limited | 0% | -26% | -79% | -84% | 0.023 | $14,964,924 |
| TTM | Titan Minerals | 0% | 17% | -24% | -39% | 0.076 | $107,256,762 |
| MAU | Magnetic Resources | 0% | -5% | -38% | -42% | 0.9 | $210,190,097 |
| BC8 | Black Cat Syndicate | 0% | -9% | -42% | -42% | 0.32 | $68,478,136 |
| EMR | Emerald Res NL | 0% | -5% | -9% | 12% | 1.115 | $661,753,596 |
| BYH | Bryah Resources | 0% | -11% | -55% | -54% | 0.025 | $6,981,337 |
| DCN | Dacian Gold | 0% | 55% | -52% | -44% | 0.135 | $176,436,136 |
| FG1 | Flynngold | 0% | 5% | -30% | -31% | 0.11 | $7,046,716 |
| WWI | West Wits Mining | 0% | 6% | -49% | -57% | 0.018 | $36,180,678 |
| GMN | Gold Mountain | 0% | 0% | -25% | -70% | 0.006 | $8,898,895 |
| HMG | Hamelingoldlimited | 0% | 10% | 3% | 0% | 0.16 | $17,600,000 |
| PF1 | Pathfinder Resources | 0% | 0% | 0% | 64% | 0.5 | $26,560,505 |
| RDN | Raiden Resources | 0% | 0% | -38% | -68% | 0.008 | $13,059,537 |
| AUC | Ausgold Limited | 0% | 2% | -47% | -9% | 0.042 | $85,237,931 |
| WMC | Wiluna Mining Corp | 0% | 0% | -74% | -77% | 0.205 | $74,238,031 |
| RDS | Redstone Resources | 0% | 0% | -27% | -38% | 0.008 | $5,894,659 |
| HXG | Hexagon Energy | 0% | -12% | -67% | -84% | 0.015 | $7,693,739 |
| AVW | Avira Resources | 0% | -13% | -50% | -42% | 0.0035 | $7,468,265 |
| LCY | Legacy Iron Ore | 0% | -5% | -37% | 36% | 0.019 | $121,729,698 |
| PDI | Predictive Disc | 0% | 3% | -16% | -3% | 0.18 | $307,430,954 |
| MAT | Matsa Resources | 0% | -5% | -46% | -38% | 0.038 | $15,650,476 |
| ZAG | Zuleika Gold | 0% | -5% | -44% | -20% | 0.018 | $9,387,911 |
| MBK | Metal Bank | 0% | 0% | -43% | -58% | 0.004 | $10,460,991 |
| S2R | S2 Resources | 0% | -7% | -16% | 61% | 0.135 | $48,110,605 |
| TLM | Talisman Mining | 0% | 0% | -22% | -7% | 0.14 | $26,283,530 |
| OAU | Ora Gold Limited | 0% | -6% | -50% | -44% | 0.008 | $7,873,850 |
| GNM | Great Northern | 0% | -20% | -33% | -56% | 0.004 | $6,836,204 |
| DEX | Duke Exploration | 0% | 8% | -66% | -74% | 0.053 | $4,781,191 |
| MOM | Moab Minerals | 0% | -56% | -56% | -68% | 0.012 | $8,183,562 |
| KNB | Koonenberrygold | 0% | -16% | -24% | -54% | 0.076 | $5,757,490 |
| ENR | Encounter Resources | 0% | -17% | -25% | -41% | 0.12 | $42,066,019 |
| AYM | Australia United Min | 0% | -33% | -50% | -64% | 0.004 | $7,370,310 |
| ANL | Amani Gold | 0% | -33% | -50% | -67% | 0.001 | $23,693,441 |
| PNT | Panthermetals | 0% | -10% | -31% | 0% | 0.18 | $5,490,000 |
| MI6 | Minerals260Limited | 0% | 9% | -38% | -36% | 0.31 | $68,200,000 |
| TUL | Tulla Resources | 0% | -8% | -33% | -15% | 0.44 | $70,495,424 |
| CLZ | Classic Min | 0% | -2% | -88% | -88% | 0.017 | $7,640,830 |
| OBM | Ora Banda Mining | -1% | 36% | 54% | -10% | 0.08 | $110,044,187 |
| MEG | Megado Minerals | -1% | -2% | -56% | -17% | 0.079 | $8,723,904 |
| NAG | Nagambie Resources | -1% | -1% | 58% | 5% | 0.079 | $41,765,044 |
| AWJ | Auric Mining | -1% | -10% | -7% | -44% | 0.076 | $5,812,751 |
| MDI | Middle Island Res | -2% | -5% | -57% | -43% | 0.063 | $7,712,348 |
| HAV | Havilah Resources | -2% | -13% | 55% | 40% | 0.295 | $93,408,567 |
| LEX | Lefroy Exploration | -2% | -11% | -13% | -31% | 0.29 | $42,303,654 |
| A8G | Australasian Metals | -2% | -8% | -46% | -64% | 0.275 | $11,321,886 |
| ALY | Alchemy Resource | -2% | 26% | 26% | 104% | 0.0265 | $30,499,983 |
| KRM | Kingsrose Mining | -2% | -2% | -35% | 0% | 0.052 | $39,131,379 |
| NST | Northern Star | -2% | 3% | -29% | -16% | 7.96 | $9,158,447,627 |
| AAU | Antilles Gold | -2% | -6% | -31% | -39% | 0.046 | $19,126,076 |
| SPQ | Superior Resources | -2% | -20% | 13% | 221% | 0.045 | $76,554,919 |
| CBY | Canterbury Resources | -2% | 26% | -29% | -58% | 0.044 | $5,897,035 |
| PGO | Pacgold | -2% | -14% | -43% | 57% | 0.44 | $24,183,199 |
| RVR | Red River Resources | -2% | -8% | -68% | -66% | 0.08 | $39,403,301 |
| DEG | De Grey Mining | -2% | -5% | -29% | -19% | 0.98 | $1,517,683,976 |
| TBR | Tribune Res | -3% | -7% | -31% | -38% | 3.27 | $171,570,612 |
| CDR | Codrus Minerals | -3% | -7% | -26% | -55% | 0.07 | $2,800,000 |
| TRM | Truscott Mining Corp | -3% | -13% | -36% | 3% | 0.035 | $5,525,469 |
| GWR | GWR Group | -3% | -24% | -62% | -62% | 0.063 | $20,236,649 |
| NCM | Newcrest Mining | -3% | -1% | -41% | -32% | 16.93 | $15,023,245,298 |
| ZNC | Zenith Minerals | -3% | 0% | -29% | 15% | 0.3 | $103,428,684 |
| AGG | AngloGold Ashanti | -3% | 6% | -34% | -18% | 4.08 | $361,291,448 |
| WRM | White Rock Min | -4% | -4% | -61% | -77% | 0.081 | $15,624,629 |
| IDA | Indiana Resources | -4% | -18% | -20% | -4% | 0.053 | $25,641,655 |
| AXE | Archer Materials | -4% | -5% | -13% | -50% | 0.77 | $191,319,749 |
| E2M | E2 Metals | -4% | -22% | -47% | -50% | 0.125 | $24,891,540 |
| BCN | Beacon Minerals | -4% | 0% | -29% | -27% | 0.024 | $90,162,436 |
| A1G | African Gold . | -4% | -12% | -62% | -66% | 0.072 | $7,642,261 |
| LM8 | Lunnonmetalslimited | -4% | -21% | -41% | 73% | 0.71 | $78,012,050 |
| DTR | Dateline Resources | -4% | -19% | -41% | -24% | 0.071 | $39,907,703 |
| BRB | Breaker Res NL | -4% | 0% | -16% | -19% | 0.235 | $74,943,414 |
| AGC | AGC | -4% | -7% | -31% | -46% | 0.068 | $4,605,455 |
| OKR | Okapi Resources | -4% | -20% | -43% | -62% | 0.225 | $31,265,935 |
| MGV | Musgrave Minerals | -4% | -10% | -40% | -42% | 0.22 | $116,223,184 |
| CMM | Capricorn Metals | -5% | 9% | -31% | 23% | 3.13 | $1,166,646,577 |
| GOR | Gold Road Res | -5% | -4% | -25% | -7% | 1.24 | $1,318,017,065 |
| MTC | Metalstech | -5% | 4% | 31% | -5% | 0.4 | $68,446,859 |
| GMR | Golden Rim Resources | -5% | -11% | -49% | -56% | 0.04 | $12,556,536 |
| ANX | Anax Metals | -5% | -17% | -53% | -44% | 0.059 | $23,932,061 |
| BGL | Bellevue Gold | -5% | -11% | -31% | -21% | 0.68 | $722,793,874 |
| SLZ | Sultan Resources | -5% | -5% | -41% | -50% | 0.095 | $7,912,017 |
| REZ | Resourc & En Grp | -5% | -10% | -60% | -58% | 0.019 | $9,496,310 |
| EM2 | Eagle Mountain | -5% | -26% | -59% | -76% | 0.185 | $49,629,037 |
| NXM | Nexus Minerals | -5% | -10% | -47% | -60% | 0.18 | $57,321,596 |
| TMZ | Thomson Res | -5% | -22% | -58% | -80% | 0.018 | $14,514,604 |
| GBR | Greatbould Resources | -5% | -10% | -25% | -56% | 0.09 | $37,635,623 |
| CYL | Catalyst Metals | -5% | -4% | -37% | -43% | 1.2 | $123,070,185 |
| HMX | Hammer Metals | -5% | 10% | -50% | -16% | 0.053 | $42,643,081 |
| EVN | Evolution Mining | -6% | -13% | -60% | -51% | 1.8375 | $3,394,591,150 |
| SVL | Silver Mines Limited | -6% | 0% | -29% | -17% | 0.17 | $219,611,464 |
| PNR | Pantoro Limited | -6% | -3% | -47% | -19% | 0.17 | $267,964,518 |
| THR | Thor Mining PLC | -6% | -23% | -43% | -53% | 0.0085 | $9,365,287 |
| KWR | Kingwest Resources | -6% | -28% | -81% | -75% | 0.033 | $9,296,985 |
| KSN | Kingston Resources | -6% | -9% | -57% | -61% | 0.08 | $31,831,540 |
| SLR | Silver Lake Resource | -6% | -2% | -47% | -29% | 1.12 | $1,041,313,653 |
| GML | Gateway Mining | -6% | -11% | -36% | -56% | 0.08 | $18,080,877 |
| HRN | Horizon Gold | -6% | -13% | -26% | -25% | 0.31 | $38,806,309 |
| SSR | SSR Mining Inc. | -6% | 0% | -35% | -3% | 20.87 | $379,320,535 |
| CHZ | Chesser Resources | -6% | -8% | -37% | -44% | 0.073 | $42,932,987 |
| GED | Golden Deeps | -7% | 8% | -33% | 17% | 0.014 | $16,173,174 |
| AWV | Anova Metals | -7% | 0% | 0% | -39% | 0.014 | $22,373,319 |
| MHC | Manhattan Corp | -7% | -13% | -50% | -46% | 0.007 | $10,683,951 |
| GRL | Godolphin Resources | -7% | -1% | -42% | -44% | 0.084 | $9,943,034 |
| ALK | Alkane Resources | -7% | -16% | -48% | -32% | 0.625 | $377,045,473 |
| NWM | Norwest Minerals | -7% | -37% | -52% | -67% | 0.027 | $6,219,007 |
| HCH | Hot Chili | -7% | -16% | -42% | -63% | 0.93 | $111,681,268 |
| WAF | West African Res | -7% | -13% | -28% | -29% | 0.985 | $1,005,736,240 |
| MKR | Manuka Resources. | -7% | -22% | -57% | -66% | 0.125 | $35,752,548 |
| GUL | Gullewa Limited | -7% | 3% | -23% | -23% | 0.062 | $11,835,992 |
| NMR | Native Mineral Res | -8% | -27% | -40% | -47% | 0.12 | $6,036,807 |
| MVL | Marvel Gold Limited | -8% | -23% | -47% | -62% | 0.024 | $16,907,865 |
| MEI | Meteoric Resources | -8% | -20% | -29% | -56% | 0.012 | $18,315,568 |
| M24 | Mamba Exploration | -8% | -20% | -11% | -40% | 0.12 | $5,061,000 |
| TCG | Turaco Gold Limited | -8% | -10% | -57% | -67% | 0.045 | $19,247,250 |
| RGL | Riversgold | -8% | 10% | -42% | 107% | 0.045 | $35,709,848 |
| SI6 | SI6 Metals Limited | -8% | -27% | -45% | -54% | 0.0055 | $8,185,040 |
| SBR | Sabre Resources | -8% | -8% | -21% | 38% | 0.0055 | $16,031,708 |
| SMS | Starmineralslimited | -8% | -6% | -57% | 0% | 0.087 | $2,573,460 |
| RMS | Ramelius Resources | -9% | -13% | -61% | -62% | 0.59 | $527,739,255 |
| BNZ | Benzmining | -9% | -16% | -35% | -37% | 0.455 | $31,749,783 |
| CY5 | Cygnus Gold Limited | -9% | 67% | 165% | 233% | 0.45 | $68,441,171 |
| RED | Red 5 Limited | -9% | -35% | -66% | -43% | 0.15 | $421,055,771 |
| RRL | Regis Resources | -9% | -3% | -36% | -35% | 1.445 | $1,087,237,332 |
| RDT | Red Dirt Metals | -9% | -15% | -8% | -24% | 0.54 | $179,277,744 |
| CWX | Carawine Resources | -9% | -14% | -59% | -59% | 0.086 | $11,853,754 |
| LRL | Labyrinth Resources | -10% | -24% | -55% | -44% | 0.019 | $16,593,968 |
| SFR | Sandfire Resources | -10% | -19% | -42% | -43% | 3.28 | $1,345,395,674 |
| BAT | Battery Minerals | -10% | -10% | -55% | -68% | 0.0045 | $13,163,591 |
| AQI | Alicanto Min | -10% | -27% | -65% | -72% | 0.035 | $14,371,477 |
| WGX | Westgold Resources. | -11% | -8% | -58% | -60% | 0.765 | $362,321,388 |
| MLS | Metals Australia | -11% | -18% | -76% | 3% | 0.041 | $24,888,484 |
| MRZ | Mont Royal Resources | -12% | -25% | -50% | -47% | 0.19 | $12,736,831 |
| GAL | Galileo Mining | -12% | -9% | 389% | 331% | 1.1 | $223,071,334 |
| DCX | Discovex Res | -13% | -30% | -59% | -33% | 0.0035 | $11,558,988 |
| XTC | Xantippe Res | -13% | -22% | -50% | 75% | 0.007 | $57,016,609 |
| ICG | Inca Minerals | -13% | 3% | -67% | -73% | 0.035 | $16,872,199 |
| LYN | Lycaonresources | -13% | -35% | -48% | 0% | 0.235 | $7,500,906 |
| CXU | Cauldron Energy | -13% | -17% | -38% | -68% | 0.01 | $5,354,113 |
| GSM | Golden State Mining | -13% | -26% | -54% | -65% | 0.0365 | $4,271,018 |
| RSG | Resolute Mining | -14% | -17% | -49% | -57% | 0.19 | $204,280,583 |
| BMO | Bastion Minerals | -14% | -25% | -58% | -75% | 0.068 | $6,454,329 |
| TMX | Terrain Minerals | -14% | -14% | -45% | -33% | 0.006 | $4,564,566 |
| CAZ | Cazaly Resources | -14% | -21% | -23% | -38% | 0.03 | $11,124,654 |
| EMU | EMU NL | -14% | -25% | -71% | -79% | 0.006 | $4,123,609 |
| CST | Castile Resources | -15% | -25% | -45% | -60% | 0.094 | $22,738,828 |
| ARV | Artemis Resources | -15% | -17% | -50% | -67% | 0.035 | $54,265,316 |
| MOH | Moho Resources | -15% | -36% | -57% | -63% | 0.023 | $4,776,231 |
| ICL | Iceni Gold | -15% | -18% | -33% | -73% | 0.077 | $9,871,125 |
| HRZ | Horizon | -15% | -24% | -56% | -56% | 0.055 | $34,177,831 |
| PUR | Pursuit Minerals | -15% | -21% | -68% | -69% | 0.011 | $10,979,971 |
| KAL | Kalgoorliegoldmining | -16% | -28% | -28% | 0% | 0.105 | $7,605,633 |
| MTH | Mithril Resources | -17% | 0% | -55% | -67% | 0.005 | $14,701,165 |
| GSR | Greenstone Resources | -17% | -64% | -31% | -7% | 0.025 | $26,393,849 |
| GCY | Gascoyne Res | -17% | -27% | -28% | -44% | 0.22 | $95,857,932 |
| AAR | Astral Resources NL | -17% | -25% | -36% | -20% | 0.063 | $37,559,292 |
| PRS | Prospech Limited | -18% | -18% | -43% | -62% | 0.028 | $1,825,068 |
| MKG | Mako Gold | -18% | -29% | -52% | -59% | 0.041 | $15,671,906 |
| BBX | BBX Minerals | -18% | -29% | -60% | -74% | 0.05 | $24,336,074 |
| RXL | Rox Resources | -19% | -33% | -53% | -48% | 0.195 | $32,098,780 |
| RXL | Rox Resources | -19% | -33% | -53% | -48% | 0.195 | $32,098,780 |
| AMI | Aurelia Metals | -20% | -51% | -77% | -71% | 0.1125 | $136,118,094 |
| MRR | Minrex Resources | -20% | -15% | -41% | 132% | 0.044 | $46,578,286 |
| TSC | Twenty Seven Co. | -20% | 0% | -29% | -43% | 0.002 | $10,643,256 |
| PNM | Pacific Nickel Mines | -20% | -25% | -38% | -49% | 0.071 | $20,369,961 |
| TG1 | Techgen Metals | -24% | -42% | -21% | -46% | 0.11 | $6,022,385 |
| PUA | Peak Minerals | -25% | -33% | -63% | -58% | 0.006 | $6,248,225 |
| DDDDB | 3D Resources Limited | -30% | -30% | -80% | -83% | 0.007 | $3,545,498 |
| SIH | Sihayo Gold Limited | -33% | 0% | -50% | -78% | 0.002 | $12,204,256 |
| YRL | Yandal Resources | -37% | -35% | -60% | -75% | 0.1 | $11,609,155 |
| NES | Nelson Resources. | -38% | -56% | -69% | -81% | 0.008 | $3,531,566 |
| SBM | St Barbara Limited | -39% | -43% | -69% | -70% | 0.46 | $375,379,157 |
A mixed week for the producers, who are reporting on the September quarter.
St Barbara (ASX:SBM) stock collapsed after a disastrous quarter, with 63,700oz produced at a radically higher than expected all in sustaining cost of $2490/oz.
It pulled in an average selling price for that gold of just $2486/oz.
St Barbs has also deferred $180 million of expansionary capex for 12 months, including the development of the Aphrodite mine, the construction of a refractory milling circuit at its Gwalia processing plant and a proposed expansion from 1.4mtpa to 2.1Mtpa.
Evolution Mining (ASX:EVN) says the company is track to hit production and cost guidance in FY23 followed a “solid start” in the September quarter.
The boffins at RBC disagreed, saying that Q1 production of 161,000oz and an all-in sustaining cost of $1,513/oz came in 10% below and 10% above their expectations, respectively.
Consistent, can-do-no-wrong African goldie Perseus Mining (ASX:PRU) fared much better.
Q1 highlights for PRU included record gold production of 137,460oz, 12% more than in the June 2022 quarter. Perseus is on track to achieve 240,000-265,000oz guidance for the December 2022 half year, it says.
Remarkably, costs actually reduced.
PRU’s average AISC dropped 12% to US$879 per ounce during the quarter — well below market guidance of $1,000 – $1,100 per ounce for the December 2022 half year.
Northern Star (ASX:NST) also tread close to analyst expectations by selling 369,000oz of gold at all in sustaining costs of $1788/oz and all in costs of $2361/oz, with the higher all in cost number including a big uptick in growth capital and exploration spending.
NST generated $255m in mine operating cash flow and $78m in net mine cash flow, its best number on that metric in three quarters.
SBM, EVN,PRU,NST share price charts
WEEKLY GOLD STANDOUTS
This explorer has enjoyed a 30% bump to its share price over the past week thanks to some strong news flow.
On Thursday, it was strong gold drilling results at the new Wanamaker discovery, part of the Millrose project in WA.
New oxide gold results include 5m @ 14.5g/t from 67m and 5m @ 6.6g/t Au from 83m, in two separate holes.
The first of these is ~200m away from the hit of 7m at 22.2g/t announced earlier this week.
On Friday, STK announced plans to spin out its Iroquois zinc-lead (80% Strickland; 20% Gibb River Diamonds (ASX:GIB)) and Bryah Basin copper-gold projects into a new ASX company.
STK’s focus is Milrose, but Iroquois and Bryah are still projects of significance, CEO Andrew Bray says.
“ The Iroquois Zn-Pb project lies directly along strike from Rumble Resources’ (ASX:RTR) world-class Earaheedy project, and has shown tremendous potential for additional Zn-Pb discoveries,” he says.
The work completed to date has shown that Iroquois warrants development in a standalone ASX-listed base metals company, Bray says.
“Should the spin out proceed as proposed, Iroquois will be front-and-centre of the new company. This allows for much more dedicated and focused exploration programs,” he says.
This hard-working explorer is looking to building on an existing 1.4Moz resource at the Kundip Mining Centre – part of the Ravensthorpe project (RGP) in WA — with a 13,000m drilling program.
Latest results from the previously mined Flag prospect — like 4.9m @ 8.1 g/t Au, 0.27 % Cu, 5.09 g/t Ag from 285m – confirm that high-grade mineralisation continues beneath historical workings.
All results are at the margins of, or outside, the Inferred 2020 Mineral Resource Estimate (MRE) and will be incorporated in upcoming November MRE update, MM8 says.
And there’s more to come, managing director Paul Bennett says.
“All the holes intersected the structure giving the team great confidence in the continuity of the deposit and the ability to further extend the structure with further drilling,” he says.
“The exceptional grades in many of the holes demonstrate the potential of Flag to yield high margin material.
“We now have all the data in hand to inform the next Kundip mineral resource update, and we look forward to releasing that result in the coming weeks as we continue to build critical mass at RGP.”
MM8’s ultimate goal is to have enough gold in the ground to run a 100,000oz per annum operation for at least 8 years.
Junior explorer GBM Resources has inked a $25m farm in agreement with gold giant Newcrest (ASX:NCM) over GBZ’s 330,000oz Mount Coolon project in the Drummond Basin of QLD.
NCM can acquire up to 75% of Mount Coolon by spending up to $25m and completing a series of exploration milestones – including 23,000m of drilling – over six years.
The deal frees up GBZ to focus its efforts (and money) on the nearby Twin Hills and Yandan gold projects, which have a combined resource of ~1.38Moz.
GBZ purchased Mount Coolon in February 2015 from DGO (recently acquired by Gold Road Resources) for $850,000 cash and 50m shares.
It has done some drilling since then but believes “a well-credentialed partner in Newcrest” is required to give the project a red-hot go.
“The results of the 2021 and 2020 drill programs have demonstrated a substantial multi-stage hydrothermal system is present at GEES [Glen Eva and Eastern Siliceous zone],” GBZ says.
“GBM believes that the Glen Eva epithermal veining, the pyrite halo, and CBM veining may be part of a large mineral system that zones outward from a base metal bearing core to a low sulfidation precious metal system to the northwest at Glen Eva and potentially also to the southeast at Eastern Siliceous.
“This is a preliminary interpretation and requires additional drill testing over 1.5 km of intervening untested strike projection of the vein corridor back to Glen Eva and over 2 km of intervening untested strike towards Eastern Siliceous.”
Related Topics

Related Stories


UNLOCK INSIGHTS
Discover the untold stories of emerging ASX stocks.
Daily news and expert analysis, it's free to subscribe.
By proceeding, you confirm you understand that we handle personal information in accordance with our Privacy Policy.


