Gold Digger: This fundie says gold miner valuations are at a 25-year low
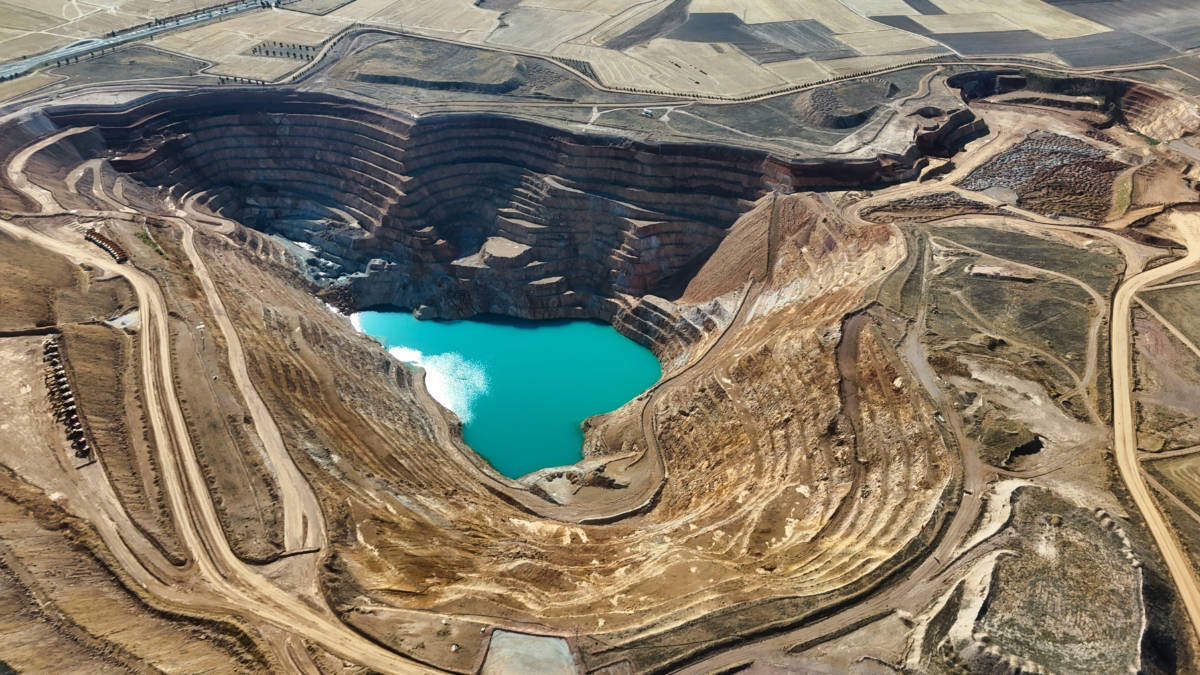
Triple Eight Capital analyst says gold miner valuations are at their lowest despite high gold prices. Pic: Getty Images
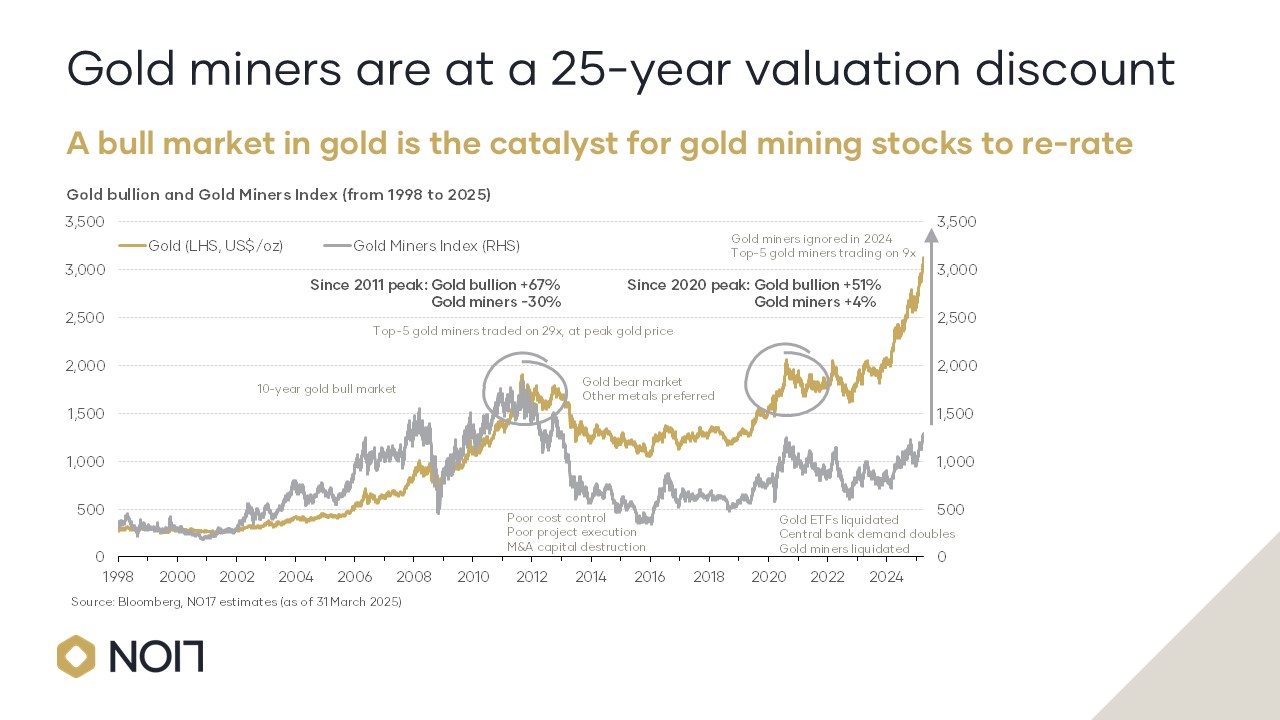
- Gold prices are at all-time highs, but miners’ valuations are sitting at “25-year lows”
- T8 Capital’s Roscoe Widdup says gold bull market has more room to grow
- Free cash flow multiple for world’s top five miners at a third of 2012 levels
Gold prices are sitting at all-time highs and could go even higher, as the order of global trade breaks down and central banks around the world increasingly aim to buttress their exposure to the US economy.
JPMorgan analysts in early May said in a note that even a 0.5% shift of foreign US assets to gold could yield 18%pa returns that could take gold to US$6000/oz by 2029 as fears over the US debt pile and trade unpredictability threaten an unwind of the substantial position foreign reserve banks have built up over five decades.
Their latest forecasts have gold hitting US$4100/oz by 2026. Wowzers.
At US$3373/oz on Thursday gold prices are already close to record highs in nominal terms, having hit US$3500/oz at the peak of US-China trade tensions in April.
Yet fundie Roscoe Widdup, whose firm Triple Eight Capital runs the NO17 Gold fund, says gold miners are now at a 25-year valuation low.
That suggests there’s plenty more value to be found in the long unloved precious metals sector.
Analysis from T8 shows the world’s top five gold miners were running at a free cash flow multiple of as much as 29x at their post-GFC peak in 2012, before a 2013 crash that caught out miners which had invested heavily in growth, lowered cut-off grades and let costs run out of control.
Nowadays, they’re running at just 9x as of March 31 on T8’s analysis. That’s despite an environment in which prices have risen strongly and margins have expanded to an even stronger degree.
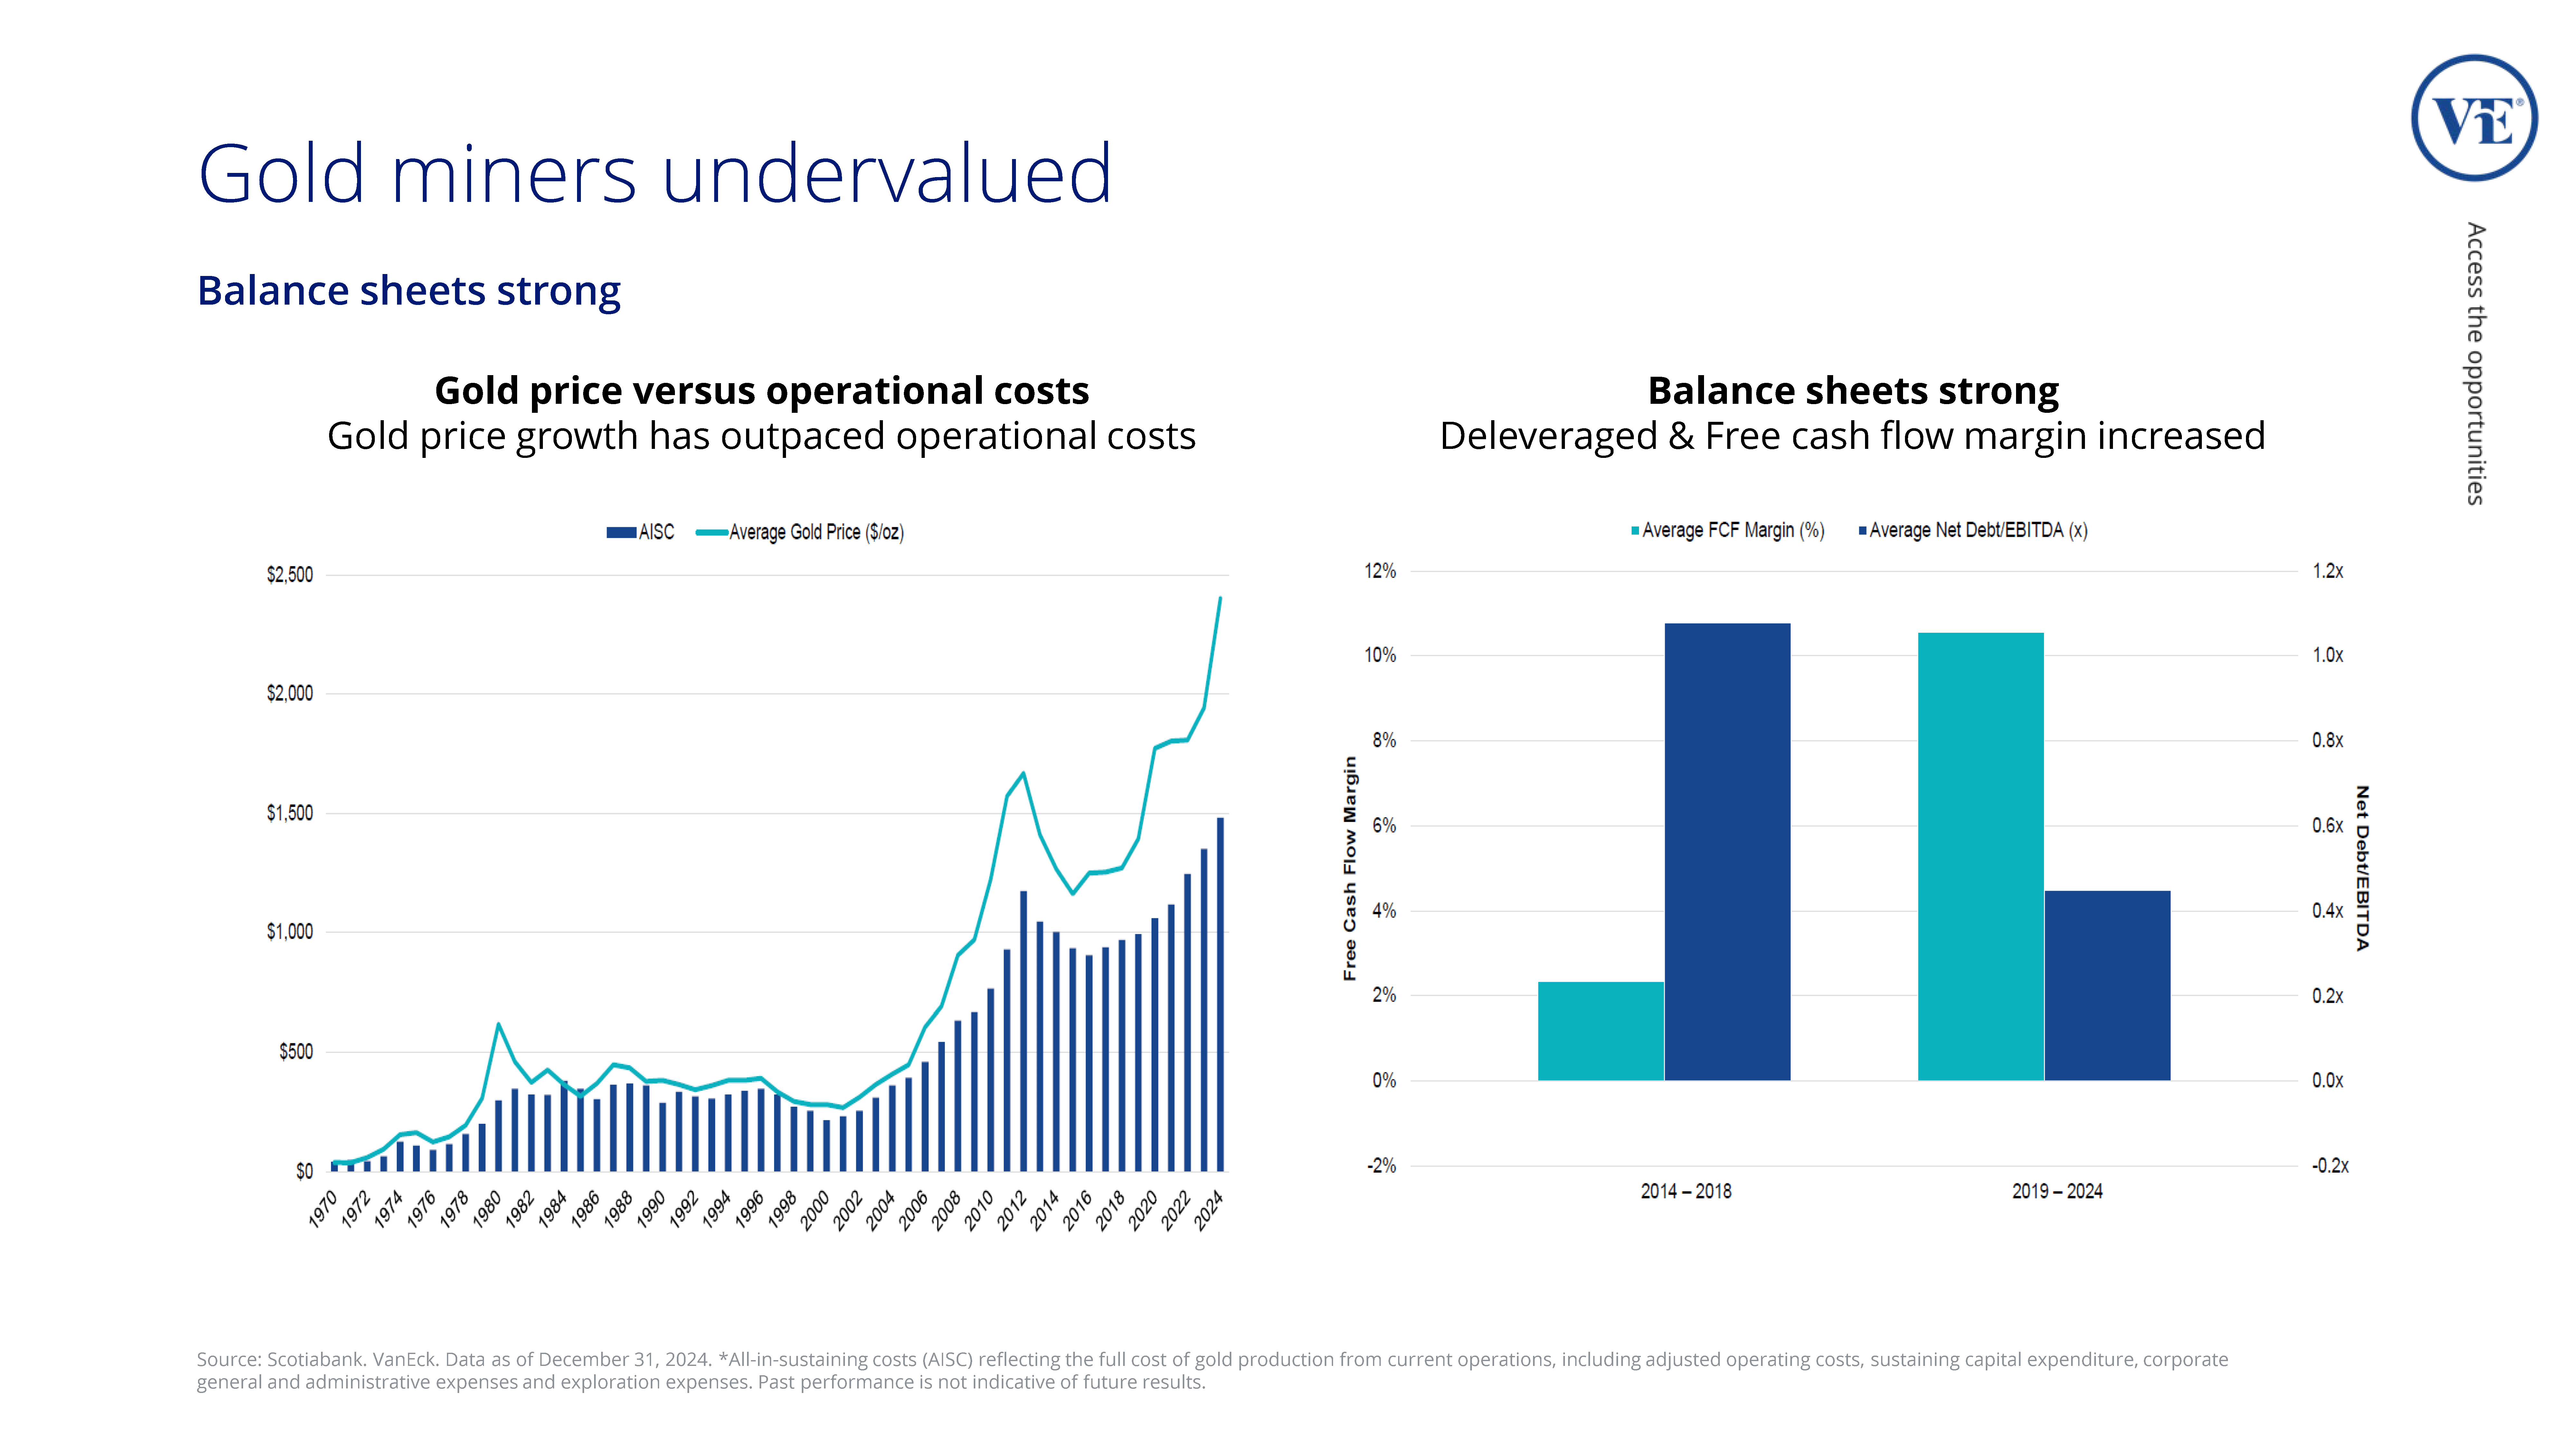
“If you look at this period here, this bear market period for gold miners. We had you low free cash margins and high debt on leverage ratio,” Widdup told Stockhead.
“It’s flipped. It’s the inverse now.
“The cash margins that the gold mining companies are generating are considerable and they are unlevered.
“So where we are today is … from this peak, gold bullion price is up 70% and gold miners have weakened.”
Oh how things change
The ugly duckling of the resources market for so long, gold miners are starting to show their value as margins expand.
Theoretically, each dollar move up in the gold price should expand margins twice over.
Now that cost escalation from two periods – the post GFC boom and the post-Covid inflation crisis – is over, gold producers are starting to see the benefits.
“Over these multiple time horizons we are not yet seeing that disconnect close. Last year, gold bullion was up over 20%, gold miners did half. And that’s widening those jaws,” Widdup said.
“So far this year US$ traded gold bullion is up 28% year to date as of US close (on Wednesday) and the index of gold miners is up 57%.
“So this year that leverage – that two beta – is working. It didn’t work last year, didn’t work the year before. And so what’s encouraging to us in terms of how this cycle plays out and how we believe it is playing out, is the laws of physics are returning.”
The potential catch up here is significant, Widdup thinks. He said the top gold miners are now generating free cash margins that are 10% stronger than copper producers.
“The top five gold miners should be trading on – at mid-cycle – low 20s one year forward price to free cash flow multiple and at top of cycle that multiple can be higher, at bottom of cycle, which is where we believe we are, that cohort is trading on if you jump to the punch line is trading on on less than ten times,” he said.
“That is a huge disconnect.”
Bull market goes higher
Widdup says the fundamentals support a continuation of the gold bull market, with miners struggling to add supply in a market starting to grow at rates above historical norms thanks to a rush of central bank and investor demand.
“Gold demand over a long term has grown at between 0.75 and 1% per annum. We see a period of elevated growth,” he said.
“Supply has been more or less able to match that, albeit at a higher and higher marginal cost, hence the higher gold price.
“But at this present time, we see a period for genuinely elevated demand driven by central banks and investors and we see a real difficulty in the supply side being able to respond.”
There are real concerns now about the reliability of US Treasuries, exposure to which foreign central banks could look to cut further.
JPMorgan estimates around US$8.8tn of these bonds are held outside the US, with Widdup saying US$4tn is held by central banks.
“From a liquidity perspective gold bullion is … to our reckoning the only asset class that is actually sufficiently liquid and sufficiently defensive to be able to fill that gap of US treasuries,” Widdup said.
“And if you then translate that into central bank demand for gold in the traded gold market, that’s equivalent to adding a fifth of annual demand every year. An extraordinary amount.”
At the same time, conversations with the world’s top 20 miners across the past 18 months has shown the amount of “scar tissue” these is across the large established gold miners from the failures of the post-GFC boom.
“The investor perception is that high gold prices means redraw the pit shell, lower cut-off grades, poor cost control. They’re going to jump into M&A, they’re going to launch big projects,” Widdup said.
“The perception of markets is that there won’t be margin expansion, it will all be withered away.”
But the general economic environment now is more constructive for gold, with the crude oil and energy prices down, unemployment increasing and weakness in other sectors of the mining industry helping to ease labour inflation.
“Of course, you can’t just buy the whole index because there are low quality companies in there with end-of-life assets,” Widdup cautions.
“This is why a concentrated, actively managed portfolio of really good gold miners will generate outsized returns both through delivering that genuine leverage to the gold price, but then also taking advantage of that rerate of … that long run valuation multiple, returning to what Cap-M theory says you should value gold miners at mid-cycle.”
Winners and losers
Here’s how ASX-listed precious metals stocks are performing:
| CODE | COMPANY | PRICE | WEEK % | MONTH % | 6 MONTH % | YEAR % | MARKET CAP |
|---|---|---|---|---|---|---|---|
| BYH | Bryah Resources Ltd | 0.016 | 300% | 220% | 300% | 100% | $11,309,396 |
| BMO | Bastion Minerals | 0.003 | 100% | 0% | -40% | -57% | $1,355,441 |
| CY5 | Cygnus Metals Ltd | 0.11 | 51% | 47% | 0% | 86% | $89,368,825 |
| ICL | Iceni Gold | 0.093 | 50% | 72% | 50% | 9% | $28,882,829 |
| MOM | Moab Minerals Ltd | 0.002 | 50% | 0% | -25% | -63% | $2,600,499 |
| IVR | Investigator Res Ltd | 0.031 | 41% | 35% | -18% | -44% | $44,502,628 |
| DTR | Dateline Resources | 0.125 | 36% | 468% | 3471% | 862% | $395,113,011 |
| GMN | Gold Mountain Ltd | 0.002 | 33% | 33% | 0% | -33% | $8,429,639 |
| PNT | Panthermetalsltd | 0.016 | 33% | -11% | -6% | -49% | $4,212,664 |
| GPR | Geopacific Resources | 0.024 | 33% | 9% | 12% | 12% | $63,649,307 |
| GED | Golden Deeps | 0.025 | 32% | 39% | -14% | -38% | $4,251,017 |
| LEX | Lefroy Exploration | 0.105 | 30% | 38% | 48% | 18% | $26,084,114 |
| MTH | Mithril Silver Gold | 0.48 | 30% | 37% | 30% | 123% | $62,678,314 |
| RML | Resolution Minerals | 0.018 | 29% | 125% | 38% | 13% | $9,464,163 |
| SPD | Southernpalladium | 0.51 | 29% | 108% | -22% | 16% | $43,201,250 |
| SNG | Siren Gold | 0.062 | 27% | 19% | -6% | -23% | $12,919,266 |
| USL | Unico Silver Limited | 0.285 | 27% | 27% | 36% | 104% | $111,675,658 |
| AUN | Aurumin | 0.092 | 26% | 44% | 56% | 142% | $46,954,714 |
| PRX | Prodigy Gold NL | 0.003 | 25% | 25% | 25% | 12% | $7,937,639 |
| SVL | Silver Mines Limited | 0.125 | 25% | 28% | 9% | -29% | $195,775,293 |
| MDI | Middle Island Res | 0.025 | 25% | 32% | 67% | 79% | $7,037,615 |
| BM8 | Battery Age Minerals | 0.058 | 23% | 2% | -52% | -66% | $6,947,834 |
| GRL | Godolphin Resources | 0.011 | 22% | 22% | -35% | -59% | $4,713,170 |
| TGM | Theta Gold Mines Ltd | 0.14 | 22% | 0% | -15% | 0% | $123,120,008 |
| ARI | Arika Resources | 0.041 | 21% | 37% | 37% | 105% | $31,223,824 |
| NVA | Nova Minerals Ltd | 0.375 | 21% | 15% | 50% | 92% | $127,583,980 |
| ARD | Argent Minerals | 0.026 | 21% | 21% | 16% | 34% | $33,249,731 |
| AVM | Advance Metals Ltd | 0.048 | 20% | -2% | 45% | 118% | $12,721,672 |
| HRN | Horizon Gold Ltd | 0.6 | 20% | 33% | 41% | 122% | $85,455,555 |
| WTM | Waratah Minerals Ltd | 0.385 | 20% | 64% | 141% | 285% | $82,896,854 |
| NES | Nelson Resources. | 0.003 | 20% | 0% | 0% | -14% | $6,515,783 |
| ICG | Inca Minerals Ltd | 0.006 | 20% | 20% | 0% | -14% | $9,458,340 |
| MEK | Meeka Metals Limited | 0.16 | 19% | 19% | 88% | 357% | $389,934,301 |
| DRE | Dreadnought Resources Ltd | 0.013 | 18% | 0% | -7% | -19% | $71,113,000 |
| NWM | Norwest Minerals | 0.013 | 18% | -19% | -24% | -48% | $9,683,586 |
| AZY | Antipa Minerals Ltd | 0.72 | 18% | 48% | 188% | 454% | $387,414,603 |
| FAU | First Au Ltd | 0.004 | 17% | 40% | 75% | 17% | $6,215,980 |
| M2R | Miramar | 0.004 | 17% | 17% | -13% | -66% | $3,488,881 |
| LCL | LCL Resources Ltd | 0.007 | 17% | 17% | -22% | -42% | $8,363,689 |
| TSO | Tesoro Gold Ltd | 0.028 | 17% | 8% | 22% | -26% | $52,427,724 |
| NXM | Nexus Minerals Ltd | 0.085 | 16% | 13% | 52% | 77% | $51,923,327 |
| AS1 | Asara Resources Ltd | 0.059 | 16% | 42% | 127% | 436% | $63,868,315 |
| SLA | Solara Minerals | 0.145 | 16% | 21% | -26% | -41% | $8,407,799 |
| PUA | Peak Minerals Ltd | 0.023 | 15% | 130% | 239% | 616% | $61,761,068 |
| PGD | Peregrine Gold | 0.15 | 15% | 0% | 15% | -43% | $11,878,684 |
| HMG | Hamelingoldlimited | 0.084 | 15% | -7% | 27% | -7% | $17,521,875 |
| ADN | Andromeda Metals Ltd | 0.013 | 14% | -38% | 79% | -40% | $53,386,803 |
| MEI | Meteoric Resources | 0.125 | 14% | 30% | 37% | -32% | $292,107,848 |
| LAT | Latitude 66 Limited | 0.043 | 13% | -16% | -34% | 2050% | $5,162,425 |
| RMX | Red Mount Min Ltd | 0.009 | 13% | 13% | -10% | -10% | $4,184,620 |
| FML | Focus Minerals Ltd | 0.4 | 13% | 70% | 135% | 158% | $113,190,665 |
| ANX | Anax Metals Ltd | 0.009 | 13% | -10% | -10% | -75% | $7,945,268 |
| SBR | Sabre Resources | 0.009 | 13% | 29% | -18% | -47% | $3,155,695 |
| LM8 | Lunnonmetalslimited | 0.23 | 12% | 5% | -2% | -8% | $50,744,480 |
| KAL | Kalgoorliegoldmining | 0.047 | 12% | 9% | 96% | 34% | $17,928,722 |
| BNZ | Benzmining | 0.45 | 11% | 17% | 13% | 181% | $73,177,166 |
| CHN | Chalice Mining Ltd | 1.27 | 11% | 16% | -8% | -19% | $511,570,226 |
| SMI | Santana Minerals Ltd | 0.598 | 11% | 15% | 20% | 75% | $426,404,018 |
| FG1 | Flynngold | 0.03 | 11% | 20% | 11% | 15% | $12,522,127 |
| HRZ | Horizon | 0.05 | 11% | -9% | 28% | 0% | $120,836,034 |
| STN | Saturn Metals | 0.345 | 11% | 23% | 47% | 50% | $158,582,777 |
| SX2 | Southgold Consol | 6.79 | 11% | 31% | 0% | 0% | $999,101,249 |
| BCM | Brazilian Critical | 0.011 | 10% | 22% | 10% | -50% | $11,692,544 |
| WA8 | Warriedarresourltd | 0.115 | 10% | 0% | 89% | 140% | $110,041,431 |
| BC8 | Black Cat Syndicate | 0.878 | 10% | -4% | 18% | 193% | $643,745,355 |
| AAJ | Aruma Resources Ltd | 0.011 | 10% | 22% | -21% | -39% | $2,775,727 |
| MKR | Manuka Resources. | 0.043 | 10% | 39% | 23% | 8% | $34,052,242 |
| MM8 | Medallion Metals. | 0.285 | 10% | 27% | 228% | 482% | $147,507,250 |
| GSN | Great Southern | 0.023 | 10% | 5% | 44% | 21% | $22,926,499 |
| NAG | Nagambie Resources | 0.017 | 10% | -15% | -29% | 89% | $13,656,140 |
| TM1 | Terra Metals Limited | 0.04 | 10% | 58% | 36% | -10% | $16,605,402 |
| KSN | Kingston Resources | 0.125 | 9% | 37% | 39% | 52% | $102,880,662 |
| YRL | Yandal Resources | 0.12 | 9% | -14% | -59% | -11% | $37,108,198 |
| AAR | Astral Resources NL | 0.19 | 9% | 27% | 41% | 150% | $276,495,041 |
| EM2 | Eagle Mountain | 0.006 | 9% | 20% | -54% | -87% | $4,540,149 |
| KCC | Kincora Copper | 0.038 | 9% | -3% | 9% | -32% | $8,712,726 |
| BGD | Bartongoldholdings | 0.79 | 9% | 60% | 204% | 177% | $178,568,319 |
| AGC | AGC Ltd | 0.175 | 9% | 17% | -8% | -49% | $42,338,542 |
| ZAG | Zuleika Gold Ltd | 0.012 | 9% | 0% | -25% | -40% | $8,902,559 |
| SBM | St Barbara Limited | 0.348 | 9% | 14% | 2% | 54% | $378,996,219 |
| A8G | Australasian Metals | 0.073 | 9% | 1% | -13% | -9% | $4,225,950 |
| HAV | Havilah Resources | 0.19 | 9% | 15% | -17% | 0% | $62,762,415 |
| MTC | Metalstech Ltd | 0.14 | 8% | 33% | 22% | -35% | $29,221,028 |
| AMI | Aurelia Metals Ltd | 0.325 | 8% | 12% | 86% | 91% | $583,937,561 |
| BNR | Bulletin Res Ltd | 0.068 | 8% | 0% | 66% | 51% | $19,378,479 |
| MVL | Marvel Gold Limited | 0.014 | 8% | 0% | 40% | 56% | $19,504,320 |
| SFM | Santa Fe Minerals | 0.04 | 8% | 8% | 38% | 0% | $2,839,933 |
| SVY | Stavely Minerals Ltd | 0.013 | 8% | -4% | -35% | -69% | $6,528,505 |
| CEL | Challenger Gold Ltd | 0.098 | 8% | 21% | 100% | 46% | $169,050,919 |
| GG8 | Gorilla Gold Mines | 0.535 | 8% | 13% | 123% | 1802% | $342,222,148 |
| CAZ | Cazaly Resources | 0.016 | 7% | 0% | -20% | -30% | $7,380,848 |
| CYL | Catalyst Metals | 6.71 | 7% | 20% | 142% | 592% | $1,722,126,219 |
| WWI | West Wits Mining Ltd | 0.029 | 7% | 53% | 107% | 123% | $78,849,797 |
| CLA | Celsius Resource Ltd | 0.008 | 7% | 7% | -32% | -25% | $20,380,675 |
| NSM | Northstaw | 0.032 | 7% | -24% | 78% | 40% | $8,757,648 |
| OBM | Ora Banda Mining Ltd | 1.135 | 7% | 13% | 62% | 255% | $2,411,181,608 |
| AQI | Alicanto Min Ltd | 0.029 | 7% | -3% | -28% | 86% | $25,444,289 |
| FXG | Felix Gold Limited | 0.16 | 7% | 3% | 68% | 186% | $67,855,722 |
| CDR | Codrus Minerals Ltd | 0.038 | 6% | 19% | 138% | -27% | $8,682,844 |
| KCN | Kingsgate Consolid. | 2.16 | 5% | 20% | 48% | 23% | $559,321,172 |
| ADT | Adriatic Metals | 5.3 | 5% | 34% | 27% | 40% | $1,604,651,162 |
| WGX | Westgold Resources. | 3.115 | 5% | 15% | 5% | 37% | $2,961,364,427 |
| GAL | Galileo Mining Ltd | 0.115 | 5% | -4% | 5% | -57% | $20,750,617 |
| TMB | Tambourahmetals | 0.022 | 5% | -15% | -19% | -70% | $2,941,801 |
| TRE | Toubani Res Ltd | 0.295 | 5% | 11% | 74% | 74% | $74,618,436 |
| AKA | Aureka Limited | 0.12 | 4% | -8% | 14% | -99% | $11,780,013 |
| HCH | Hot Chili Ltd | 0.57 | 4% | 21% | -26% | -41% | $89,441,728 |
| VRL | Verity Resources | 0.029 | 4% | 81% | 35% | -40% | $8,298,839 |
| CBY | Canterbury Resources | 0.027 | 4% | 35% | 35% | -40% | $5,600,904 |
| POL | Polymetals Resources | 0.855 | 4% | 1% | -3% | 167% | $217,930,717 |
| KAI | Kairos Minerals Ltd | 0.027 | 4% | 42% | 108% | 145% | $69,719,173 |
| HMX | Hammer Metals Ltd | 0.034 | 3% | 3% | 0% | 0% | $31,071,555 |
| G50 | G50Corp Ltd | 0.185 | 3% | 85% | -3% | 19% | $32,119,532 |
| MAU | Magnetic Resources | 1.72 | 3% | 16% | 27% | 60% | $464,232,143 |
| EMR | Emerald Res NL | 4.705 | 3% | 13% | 26% | 28% | $3,135,881,084 |
| PNR | Pantoro Gold Limited | 3.53 | 3% | 27% | 108% | 131% | $1,417,030,752 |
| GUE | Global Uranium | 0.067 | 3% | -6% | 8% | -28% | $29,559,054 |
| PDI | Predictive Disc Ltd | 0.393 | 3% | 6% | 51% | 107% | $1,035,072,491 |
| CWX | Carawine Resources | 0.098 | 2% | 1% | -11% | -7% | $23,140,294 |
| TBR | Tribune Res Ltd | 4.9 | 2% | -4% | 10% | 40% | $266,013,150 |
| TCG | Turaco Gold Limited | 0.51 | 2% | 16% | 59% | 149% | $456,510,638 |
| VAU | Vault Minerals Ltd | 0.443 | 2% | 1% | 25% | 2% | $3,061,113,022 |
| NST | Northern Star | 20.71 | 2% | 8% | 25% | 44% | $30,028,091,551 |
| PRU | Perseus Mining Ltd | 3.905 | 2% | 16% | 39% | 67% | $5,379,734,403 |
| IGO | IGO Limited | 4.185 | 2% | 5% | -16% | -39% | $3,286,542,308 |
| RND | Rand Mining Ltd | 1.9 | 1% | -2% | 24% | 28% | $110,623,744 |
| TTM | Titan Minerals | 0.385 | 1% | -3% | -13% | 13% | $102,978,754 |
| AUC | Ausgold Limited | 0.65 | 1% | 16% | 60% | 86% | $243,064,732 |
| SFR | Sandfire Resources | 11.7 | 1% | 16% | 14% | 32% | $5,375,731,481 |
| IDA | Indiana Resources | 0.08 | 1% | 3% | 33% | 90% | $51,418,597 |
| MAT | Matsa Resources | 0.069 | 1% | 10% | 60% | 146% | $48,379,304 |
| GOR | Gold Road Res Ltd | 3.35 | 1% | 3% | 62% | 107% | $3,650,300,842 |
| UVA | Uvrelimited | 0.093 | 1% | -1% | -1% | -7% | $5,598,600 |
| UVA | Uvrelimited | 0.093 | 1% | -1% | -1% | -7% | $5,598,600 |
| MRR | Minrex Resources Ltd | 0.01 | 0% | 25% | 25% | 0% | $9,763,808 |
| NPM | Newpeak Metals | 0.012 | 0% | 0% | 20% | -56% | $3,864,861 |
| ASO | Aston Minerals Ltd | 0.022 | 0% | 29% | 175% | 57% | $28,491,414 |
| G88 | Golden Mile Res Ltd | 0.014 | 0% | 27% | 56% | 17% | $9,796,461 |
| NMR | Native Mineral Res | 0.195 | 0% | 0% | 550% | 491% | $183,667,906 |
| ARL | Ardea Resources Ltd | 0.4 | 0% | -6% | 21% | -33% | $83,113,101 |
| GTR | Gti Energy Ltd | 0.004 | 0% | 60% | 33% | -27% | $11,995,799 |
| IPT | Impact Minerals | 0.006 | 0% | -8% | -47% | -69% | $19,776,650 |
| MOH | Moho Resources | 0.004 | 0% | 0% | -11% | 0% | $2,981,656 |
| MRZ | Mont Royal Resources | 0.041 | 0% | 0% | 3% | -23% | $3,486,222 |
| AAU | Antilles Gold Ltd | 0.004 | 0% | 0% | 0% | -33% | $8,605,471 |
| BMR | Ballymore Resources | 0.155 | 0% | 15% | -6% | -11% | $28,276,894 |
| ERM | Emmerson Resources | 0.13 | 0% | -7% | 117% | 202% | $82,630,454 |
| AM7 | Arcadia Minerals | 0.017 | 0% | -6% | -23% | -69% | $1,995,518 |
| MLS | Metals Australia | 0.018 | 0% | -8% | -28% | -18% | $13,116,951 |
| ASR | Asra Minerals Ltd | 0.002 | 0% | 0% | -33% | -67% | $5,533,072 |
| CTO | Citigold Corp Ltd | 0.004 | 0% | 0% | 0% | -20% | $12,000,000 |
| MHC | Manhattan Corp Ltd | 0.023 | 0% | 44% | -8% | -31% | $5,167,776 |
| SVG | Savannah Goldfields | 0.021 | 0% | -9% | 14% | -14% | $25,114,695 |
| EMC | Everest Metals Corp | 0.155 | 0% | 15% | 11% | 29% | $33,619,688 |
| GUL | Gullewa Limited | 0.074 | 0% | -15% | 25% | 4% | $16,133,641 |
| VKA | Viking Mines Ltd | 0.006 | 0% | -25% | -40% | -25% | $8,063,692 |
| BCN | Beacon Minerals | 0.028 | 0% | 4% | 27% | 0% | $122,565,468 |
| MEG | Megado Minerals Ltd | 0.014 | 0% | 27% | 0% | 34% | $5,875,566 |
| VRC | Volt Resources Ltd | 0.004 | 0% | -20% | 33% | -11% | $23,423,890 |
| ARV | Artemis Resources | 0.007 | 0% | -7% | -35% | -54% | $17,699,705 |
| RDN | Raiden Resources Ltd | 0.006 | 0% | 20% | -45% | -84% | $20,705,349 |
| EMU | EMU NL | 0.018 | 0% | -14% | -36% | -39% | $3,802,472 |
| CMM | Capricorn Metals | 9.375 | 0% | 1% | 34% | 102% | $4,155,509,700 |
| RGL | Riversgold | 0.004 | 0% | 0% | 33% | -43% | $6,734,850 |
| ALK | Alkane Resources Ltd | 0.748 | 0% | -5% | 44% | 38% | $472,322,676 |
| RDS | Redstone Resources | 0.005 | 0% | 0% | 67% | 43% | $5,171,337 |
| CXU | Cauldron Energy Ltd | 0.007 | 0% | 3% | -54% | -78% | $10,229,832 |
| DLI | Delta Lithium | 0.18 | 0% | 13% | 3% | -27% | $125,394,814 |
| ALY | Alchemy Resource Ltd | 0.005 | 0% | 0% | -17% | -29% | $7,068,458 |
| AVW | Avira Resources Ltd | 0.007 | 0% | 0% | -65% | -65% | $1,754,286 |
| GML | Gateway Mining | 0.031 | 0% | 3% | 19% | 0% | $12,673,429 |
| STK | Strickland Metals | 0.14 | 0% | 47% | 63% | 27% | $339,353,970 |
| XAM | Xanadu Mines Ltd | 0.079 | 0% | 52% | 44% | 32% | $181,005,684 |
| KTA | Krakatoa Resources | 0.01 | 0% | 11% | -9% | -38% | $6,821,474 |
| MBK | Metal Bank Ltd | 0.013 | 0% | 18% | -24% | -47% | $6,466,967 |
| TAR | Taruga Minerals | 0.009 | 0% | -10% | -10% | 13% | $6,423,787 |
| SPQ | Superior Resources | 0.004 | 0% | -11% | -43% | -50% | $10,669,422 |
| PUR | Pursuit Minerals | 0.045 | 0% | -2% | -68% | -78% | $4,288,560 |
| RMS | Ramelius Resources | 2.825 | 0% | 8% | 23% | 46% | $3,326,170,451 |
| NMG | New Murchison Gold | 0.016 | 0% | 0% | 45% | 220% | $167,464,452 |
| TRM | Truscott Mining Corp | 0.065 | 0% | 8% | -17% | 4% | $12,444,156 |
| PNM | Pacific Nickel Mines | 0.024 | 0% | 0% | 0% | -17% | $10,103,835 |
| AYM | Australia United Min | 0.003 | 0% | 50% | 50% | 0% | $5,527,732 |
| SPR | Spartan Resources | 2.2 | 0% | 6% | 40% | 199% | $2,883,522,562 |
| GMD | Genesis Minerals | 4.51 | 0% | 15% | 71% | 146% | $5,334,770,088 |
| FEG | Far East Gold | 0.155 | 0% | 3% | 0% | 29% | $56,889,255 |
| CLZ | Classic Min Ltd | 0.001 | 0% | 0% | 0% | -67% | $1,544,026 |
| TMS | Tennant Minerals Ltd | 0.006 | 0% | 0% | -33% | -74% | $6,691,233 |
| LM1 | Leeuwin Metals Ltd | 0.135 | 0% | -13% | 108% | 125% | $16,129,021 |
| RRL | Regis Resources | 4.9 | -1% | 11% | 81% | 174% | $3,890,710,330 |
| ZNC | Zenith Minerals Ltd | 0.041 | -2% | -9% | -2% | -33% | $16,297,657 |
| KZR | Kalamazoo Resources | 0.084 | -2% | 1% | 0% | -7% | $18,648,449 |
| EVN | Evolution Mining Ltd | 8.71 | -2% | 7% | 69% | 125% | $18,161,573,140 |
| ENR | Encounter Resources | 0.235 | -2% | 27% | -33% | -34% | $122,204,118 |
| MI6 | Minerals260Limited | 0.138 | -2% | 10% | 15% | -17% | $299,763,333 |
| RXL | Rox Resources | 0.29 | -2% | -3% | 57% | 87% | $219,759,038 |
| PTN | Patronus Resources | 0.057 | -2% | -8% | 2% | -2% | $85,144,686 |
| ILT | Iltani Resources Lim | 0.22 | -2% | -17% | 47% | -27% | $11,340,190 |
| GWR | GWR Group Ltd | 0.092 | -3% | -1% | 5% | -2% | $29,124,599 |
| ADV | Ardiden Ltd | 0.15 | -3% | 0% | 15% | 0% | $9,065,038 |
| QML | Qmines Limited | 0.037 | -3% | -5% | -40% | -40% | $15,112,292 |
| KAU | Kaiser Reef | 0.185 | -3% | 9% | 19% | 23% | $109,806,038 |
| CDT | Castle Minerals | 0.092 | -3% | 70% | 53% | -39% | $10,672,880 |
| ARN | Aldoro Resources | 0.305 | -3% | 5% | 91% | 349% | $56,947,899 |
| BEZ | Besragoldinc | 0.036 | -3% | -20% | -42% | -63% | $14,957,891 |
| BTR | Brightstar Resources | 0.56 | -3% | 9% | -23% | 60% | $271,732,046 |
| FFM | Firefly Metals Ltd | 1.03 | -4% | 36% | -4% | 49% | $591,678,637 |
| BGL | Bellevue Gold Ltd | 0.915 | -4% | -1% | -31% | -52% | $1,380,364,910 |
| RSG | Resolute Mining | 0.585 | -4% | 16% | 36% | 9% | $1,288,075,258 |
| NH3 | Nh3Cleanenergyltd | 0.023 | -4% | -12% | 10% | 28% | $14,115,120 |
| OZM | Ozaurum Resources | 0.079 | -4% | -16% | 147% | 76% | $18,328,150 |
| PGO | Pacgold | 0.067 | -4% | -16% | -17% | -52% | $8,675,986 |
| AAM | Aumegametals | 0.035 | -5% | -5% | -20% | -44% | $21,143,956 |
| GIB | Gibb River Diamonds | 0.033 | -6% | -11% | -13% | -31% | $7,078,812 |
| SKY | SKY Metals Ltd | 0.046 | -6% | -2% | -16% | 18% | $33,403,049 |
| REZ | Resourc & En Grp Ltd | 0.017 | -6% | -19% | -37% | 42% | $11,417,865 |
| HWK | Hawk Resources. | 0.016 | -6% | -16% | -38% | -64% | $4,876,730 |
| GBR | Greatbould Resources | 0.063 | -6% | -8% | 31% | 5% | $48,689,456 |
| GNM | Great Northern | 0.016 | -6% | 23% | 7% | 33% | $2,783,323 |
| KRM | Kingsrose Mining Ltd | 0.029 | -6% | -12% | -17% | -41% | $22,605,796 |
| TLM | Talisman Mining | 0.135 | -7% | -23% | -40% | -50% | $26,364,849 |
| M24 | Mamba Exploration | 0.013 | -7% | 8% | 18% | -32% | $3,837,153 |
| SMS | Starmineralslimited | 0.022 | -8% | -19% | -42% | -19% | $4,273,553 |
| WCN | White Cliff Min Ltd | 0.024 | -8% | 4% | 50% | 26% | $57,681,268 |
| CPM | Coopermetalslimited | 0.035 | -8% | -5% | -26% | -60% | $2,742,448 |
| A1G | African Gold Ltd. | 0.153 | -8% | 27% | 172% | 487% | $76,803,172 |
| ORN | Orion Minerals Ltd | 0.011 | -8% | -8% | -27% | -39% | $75,354,926 |
| TOR | Torque Met | 0.12 | -8% | 29% | 145% | -40% | $33,707,991 |
| VMC | Venus Metals Cor Ltd | 0.123 | -9% | 23% | 88% | 61% | $22,554,799 |
| PRS | Prospech Limited | 0.02 | -9% | -9% | -29% | -43% | $6,576,518 |
| WAF | West African Res Ltd | 2.445 | -9% | 7% | 50% | 67% | $2,986,512,321 |
| MEU | Marmota Limited | 0.041 | -9% | -5% | 11% | -7% | $49,488,843 |
| HAW | Hawthorn Resources | 0.048 | -9% | 9% | 14% | -31% | $16,080,749 |
| THR | Thor Energy PLC | 0.01 | -9% | 0% | -29% | -41% | $7,107,898 |
| AWJ | Auric Mining | 0.175 | -10% | -22% | -48% | 0% | $32,546,693 |
| LCY | Legacy Iron Ore | 0.008 | -11% | 0% | -20% | -41% | $78,096,341 |
| TG1 | Techgen Metals Ltd | 0.024 | -11% | 0% | -29% | -25% | $3,807,977 |
| TNC | True North Copper | 0.275 | -11% | 53% | -91% | -95% | $35,864,120 |
| PXX | Polarx Limited | 0.008 | -11% | 0% | 0% | -33% | $19,004,008 |
| S2R | S2 Resources | 0.085 | -12% | -11% | 31% | -32% | $38,492,929 |
| NAE | New Age Exploration | 0.004 | -13% | -13% | -22% | -13% | $7,978,197 |
| GBZ | GBM Rsources Ltd | 0.007 | -13% | -13% | -13% | -36% | $8,197,490 |
| DTM | Dart Mining NL | 0.004 | -13% | -30% | -68% | -83% | $4,193,195 |
| GSM | Golden State Mining | 0.007 | -13% | -13% | -22% | -36% | $1,955,594 |
| CST | Castile Resources | 0.051 | -14% | -31% | -32% | -37% | $16,204,675 |
| TAM | Tanami Gold NL | 0.048 | -14% | 37% | 66% | 41% | $56,404,658 |
| FAL | Falconmetalsltd | 0.12 | -14% | 14% | -14% | -56% | $22,125,000 |
| SLZ | Sultan Resources Ltd | 0.005 | -17% | -17% | -17% | -50% | $1,157,350 |
| TMX | Terrain Minerals | 0.003 | -17% | 0% | -29% | -17% | $5,621,392 |
| PKO | Peako Limited | 0.003 | -17% | 0% | -17% | -35% | $4,463,226 |
| ADG | Adelong Gold Limited | 0.006 | -21% | -31% | 10% | -8% | $12,412,060 |
| AQX | Alice Queen Ltd | 0.003 | -25% | -50% | -57% | -57% | $3,748,920 |
| SRN | Surefire Rescs NL | 0.002 | -25% | -40% | -55% | -78% | $3,729,668 |
| KNB | Koonenberrygold | 0.044 | -35% | -52% | 238% | 144% | $63,530,934 |
| BRX | Belararoxlimited | 0.055 | -42% | -25% | -68% | -74% | $8,993,390 |
| DEG | De Grey Mining | 0 | -100% | -100% | -100% | -100% | $5,915,063,112 |
Geopacific Resources (ASX:GPR)
Geopacific Resources is getting some serious support with experienced Papua New Guinea gold producer St Barbara Mines (ASX:SBM) moving to acquire a 14.4% interest in the company.
SBM is acquiring 458.6 million GPR shares in exchange for its shareholding in Patronus Resources (ASX:PTN), making it a substantial and strategic shareholder in GPR.
This will be hugely beneficial for GPR as SBM’s existing operational presence in the country through its Simberi gold mine provides deep local experience and strategic alignment with GPR’s 1.67Moz Woodlark gold project.
GPR is currently working on a definitive feasibility study for Woodlark and is working to define additional epithermal gold resources along with searching for porphyry mineralisation to unlock a new phase of district-scale exploration potential.
In May, it noted that an independent expert review had identified 14 untested porphyry copper-gold target environments on Woodlark Island.
Historical exploration on the island had focused on near-surface and epithermal gold systems, ignoring the newly uncovered deeper porphyry potential.
All 14 porphyry copper-gold target environments require further investigations to assess their potential with fieldwork to be completed over the next six months as part of the current exploration program.
These includes three high priority porphyry targets identified in close proximity to the Kulamadau, Busai, and Little Mackenzie gold deposits.
Grade control drilling at Lefroy’s Lukcy Strike project delivered the goods with an initial set of holes returning exceptional near-surface assay results.
Notable intersections include:
19m at 4.1g/t gold from 31m including 7m at 9.58 g/t from 41m (LEFR563)
22m at 2.91g/t gold from 24m including 1m at 12g/t from 40m (LEFR602); and
7m at 8.46g/t gold from 17m including 1m at 20.1g/t from 20m (LEFR493).
These results further validate the company’s confidence in the resource and geology model.
Drilling is fully funded by mine profit share partner BML Ventures.
Gold grades have exceeded expectations in the top 40-50m of the planned northern pit, demonstrating the significant high grade mining opportunity that exists at Lucky Strike.
Diamond drilling is poised to start shortly targeting a possible larger Stage 2 at Lucky Strike, which currently has a resource of 1.27Mt at 1.95g/t gold, or 79,600oz of contained gold.
It is the first of three separate resources, totalling 1 million ounces, that LEX intends to develop over the next few years.
Acquisitions are the name of the game this week with Firetail increasing its gold exposure by securing options to acquire 80% of the Excelsior Springs project in Nevada and 100% of the Bella project in South Dakota.
Excelsior Springs is located within the >40Moz Walker Lane Tectonic Zone and has historical production of 19,200oz at 41g/t gold from shallow underground workings.
Meanwhile, Bella lies within the world-class Homestake Gold Belt that has a gold endowment of ~85Moz and is just 20km along trend from the Homestake mine which has produced ~42Moz.
FTL can earn up to 80% in Excelsior Springs by paying the vendor an initial consideration of $200,000 in cash and 32m FTL shares along with a commitment to spend US$5m over a five-year period while for Bella, the company is paying the vendor $600,000 in cash and 17 million FTL shares with no work commitment.
At Stockhead, we tell it like it is. While Firetail Resources is a Stockhead advertiser, it did not sponsor this article.
Related Topics

Related Stories


UNLOCK INSIGHTS
Discover the untold stories of emerging ASX stocks.
Daily news and expert analysis, it's free to subscribe.
By proceeding, you confirm you understand that we handle personal information in accordance with our Privacy Policy.


