Gold Digger: Things keep looking up for gold, with global ETF flow swinging in right direction

Pic via Getty Images.
- The gold market is travelling well as we close out another Aussie week
- Spot pricing is heading in the right direction, thanks to weaker dollar, ECB rate cuts and more
- According to the World Gold Council, gold ETF flows turned positive in May
- And Metals Focus has a new report, suggesting fresh all time highs for the precious yellow one are nigh
The gold market is looking pretty positive right now, wouldn’t you say? The precious yellow commodity’s spot pricing right now would certainly suggest so.
Trading up about 0.4%, in US dollars, it’s pushing higher at the time of writing – US$2,389. In weaker Aussie dollars, we’re talking about $3,580.
Yes, American friends – your currency might be weakening, but at least it’s still stronger than ours. Also, on another topical note, we suppose your baseballers generally throw a bit harder and flatter than many of our cricketers (currently on show over at the T20 World Cup in the USA) over a longer distance.
Good for them… But… BUT… they should try batting when a ball can be legally pitched at 150km/hr at their feet or head.
And can they do this? WITHOUT a great big mitt on one of their hands?
Yep, that’s a bit old school, but so is gold… (Phew, we brought it back just in time.)
But overall, at the time of writing, the upwards gold narrative this year looks very much intact. Including ASX goldies, too, some of which were on fire earlier. (Read > here and see more ASX winners and losers in the table at the end of the article.)
Insofar as the gold pricing is concerned, it can be put down to a few things mid and late week:
• The US dollar softening somewhat. Its 1D, 1W and 1M action has some chop but is drooping on the whole.
• The European Central Bank’s interest rate cutting. The ECB delivered its first-rate reduction in five years, chopping its deposit rate by 25 basis points to 3.75%.
• Potentially weak US jobs data coming in on Friday in America. Amid a cooler pace of hiring in the US in May, CBS News reports that “the US job market is starting to resemble what it looked like before the pandemic upended work and life around the globe”.
[Update: Yeahhhh… that data actually came in way hotter than was widely expected.]
• Renewed interest-rates cutting positivity from the US Federal Reserve – which many still think is a strong chance of happening before too long in H2.
• ‘Soft landing’ analytical takes a-gogo and possible recession avoidance.
• Geopolitical turmoil still in the soup, keeping the safe-haven narrative stirred in for good measure.
And speaking of “for good measure”…
There’s been an ETF flow turnaround, notes WGC
The World Gold Council (WGC) – experts on all things gold, as you might well presume – has released its latest gold market and ETF commentary reports.
The overarching tone is… positive. But you’re going to need a bit more than that. We’ll make some bullet points and begin with the gold ETF flows, because that’s probably the most striking point here.
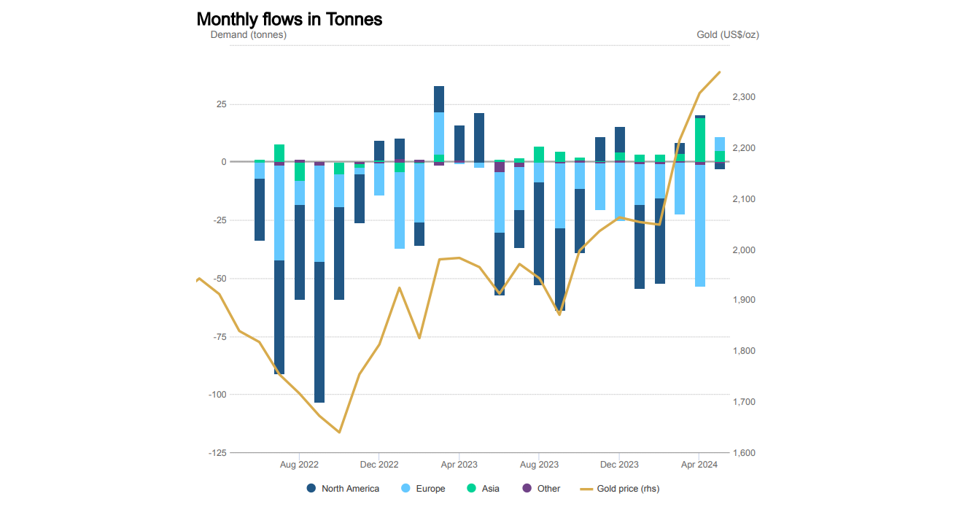
- The WGC reports that global gold-backed exchange-traded funds (ETFs) reported positive monthly flows for the first time in a year in May.
- Regarding that, total fund holdings rose to 3,088 tonnes by the end of May, which increased 8 tonnes from April. Inflows totalled some US$529 million, and these – combined with the rising gold price – pushed cumulative ETF assets under management (AUMs) to US$234 billion.
- May wasn’t all pots of gold at the end of rainbows, however. The WGC does also note that gold gains otherwise slowed on the whole in the month after a stonking April.
- That said, the US gold price still rose 2% over the month of May and recorded an all-time high of US$2,427 per ounce, before pulling back, probably due to some profit taking.
- And it should be noted that the positive ETF flows on the whole had some not so positive details on a more granular level. Inflows in Europe offset a fresh outflow in North America, the world’s biggest gold ETF market.
- Still, let’s end this round of WGC bullets on the upbeat note in which it began… gold ETF inflows have now been recorded in Asian countries for 15 straight months – the second-longest streak for the region on record. Buying activity was once again dominated by China.
Meanwhile, Metals Focus predicts fresh highs. And soon
Metals Focus, a renowned London-based precious metals research consultancy group, has released its Gold Focus 2024 – its flagship annual gold report.
To save you the trouble of reading it all, we’ve cherry-picked some of the most interesting bits, as follows:
- The report suggests that gold is expected to achieve fresh all-time highs in H2, 2024, as the economic and geopolitical backdrop remains supportive.
- The annual average gold price is forecast to rise by 16% to a record high of $2,250 in 2024. [Note, obviously the gold price is right now a fair bit higher than that forecasted average.]
- Gold’s series of record highs this year-to-date is notable in that not since its 2011 has it seen such an aggressive price increase in such a short period of time. “The rally has also been unusual in that it has coincided with the consensus on US interest rates turning less dovish than at the beginning of the year,” notes the report.
- Despite headwinds from a firmer dollar and yields, other macroeconomic factors have fuelled a return to gold by many institutional investors that were absent during much of 2023.
- Metals Focus also believes any downsides experienced in the gold market should be limited for the remainder of the year, “as there are still investors sitting on the sidelines waiting for opportunities to enter the market”.
- And lastly, it says, “as physical markets become more accustomed to higher prices, gold’s fundamentals should improve”.
Central banks are starting to cut rates as inflation remains above the 2% target.
Remember I said this was a tragic comedy?
It is tragic because many people still think central bankers have credibility.
It is a comedy that the hedge against stupidity is roaring.
Gold.
— Gold Telegraph ⚡ (@GoldTelegraph_) June 7, 2024
ASX Winners & Losers
Here’s how ASX-listed precious metals stocks are performing, circa 4pm June 7:
Scroll or swipe to reveal table. Click headings to sort. Best viewed on a laptop.
Stocks missing from this list? Please email [email protected]
| Code | Company | Price | % Week | % Month | % YTD | Market Cap |
|---|---|---|---|---|---|---|
| MRR | Minrex Resources Ltd | 0.01 | 0% | -9% | -1% | $10,848,675 |
| NPM | Newpeak Metals | 0.021 | -16% | 12% | 1% | $3,214,078 |
| ASO | Aston Minerals Ltd | 0.014 | 8% | 27% | -1% | $19,425,964 |
| MTC | Metalstech Ltd | 0.24 | 14% | -2% | 2% | $40,625,237 |
| FFX | Firefinch Ltd | 0.2 | 0% | 0% | 0% | $236,569,315 |
| GED | Golden Deeps | 0.049 | 20% | 29% | 0% | $5,660,595 |
| G88 | Golden Mile Res Ltd | 0.012 | 0% | 9% | -1% | $4,934,674 |
| NMR | Native Mineral Res | 0.034 | -8% | 70% | 1% | $7,134,917 |
| AQX | Alice Queen Ltd | 0.007 | 17% | 56% | 0% | $4,836,930 |
| SLZ | Sultan Resources Ltd | 0.01 | -9% | -9% | -1% | $1,975,865 |
| MKG | Mako Gold | 0.011 | 10% | -21% | 0% | $10,736,090 |
| KSN | Kingston Resources | 0.084 | 6% | 25% | 1% | $58,682,658 |
| AMI | Aurelia Metals Ltd | 0.1775 | -9% | -9% | 7% | $304,158,133 |
| PNX | PNX Metals Limited | 0.005 | 25% | 0% | 0% | $29,851,074 |
| GIB | Gibb River Diamonds | 0.043 | -9% | 65% | 1% | $10,152,453 |
| KCN | Kingsgate Consolid. | 1.825 | 4% | 17% | 45% | $456,220,495 |
| TMX | Terrain Minerals | 0.0035 | -13% | -13% | 0% | $5,010,847 |
| BNR | Bulletin Res Ltd | 0.045 | -8% | -15% | -10% | $13,212,600 |
| NXM | Nexus Minerals Ltd | 0.046 | -2% | -33% | 0% | $18,674,886 |
| SKY | SKY Metals Ltd | 0.038 | -3% | 12% | 0% | $22,403,020 |
| LM8 | Lunnonmetalslimited | 0.225 | -13% | -24% | -38% | $53,371,625 |
| CST | Castile Resources | 0.081 | -6% | -12% | 0% | $19,110,292 |
| YRL | Yandal Resources | 0.12 | -8% | 9% | 4% | $33,475,952 |
| FAU | First Au Ltd | 0.003 | -14% | 50% | 0% | $4,985,980 |
| ARL | Ardea Resources Ltd | 0.58 | -4% | -13% | 11% | $117,742,120 |
| GWR | GWR Group Ltd | 0.094 | -3% | -10% | 0% | $30,194,366 |
| IVR | Investigator Res Ltd | 0.057 | -5% | 14% | 2% | $90,281,136 |
| GTR | Gti Energy Ltd | 0.005 | -17% | -9% | 0% | $10,249,735 |
| IPT | Impact Minerals | 0.019 | 0% | -17% | 1% | $54,591,111 |
| BNZ | Benzmining | 0.165 | 22% | 6% | -9% | $17,427,584 |
| MOH | Moho Resources | 0.004 | 0% | 0% | -1% | $2,156,713 |
| BCM | Brazilian Critical | 0.017 | -11% | -29% | -1% | $14,953,310 |
| PUA | Peak Minerals Ltd | 0.004 | 0% | 33% | 0% | $4,165,506 |
| MRZ | Mont Royal Resources | 0.056 | 2% | 8% | -9% | $4,761,668 |
| SMS | Starmineralslimited | 0.03 | 3% | -17% | -1% | $1,973,993 |
| MVL | Marvel Gold Limited | 0.008 | -11% | -20% | 0% | $7,774,116 |
| PRX | Prodigy Gold NL | 0.003 | 20% | 20% | 0% | $5,294,436 |
| AAU | Antilles Gold Ltd | 0.006 | -14% | -45% | -2% | $5,979,210 |
| CWX | Carawine Resources | 0.105 | 5% | 5% | -1% | $24,793,172 |
| RND | Rand Mining Ltd | 1.48 | 0% | -6% | 11% | $84,176,422 |
| CAZ | Cazaly Resources | 0.02 | -5% | 11% | -1% | $9,547,363 |
| BMR | Ballymore Resources | 0.18 | -8% | 38% | 6% | $30,927,852 |
| DRE | Dreadnought Resources Ltd | 0.021 | 31% | 17% | -1% | $59,722,240 |
| ZNC | Zenith Minerals Ltd | 0.06 | -12% | -27% | -9% | $21,495,234 |
| REZ | Resourc & En Grp Ltd | 0.013 | 8% | 8% | 0% | $8,109,475 |
| LEX | Lefroy Exploration | 0.088 | -5% | -12% | -9% | $18,442,180 |
| ERM | Emmerson Resources | 0.043 | -10% | -12% | -2% | $23,422,521 |
| AM7 | Arcadia Minerals | 0.055 | -21% | -25% | -2% | $6,437,756 |
| ADT | Adriatic Metals | 3.91 | -4% | -13% | -10% | $1,069,382,630 |
| AS1 | Asara Resources Ltd | 0.01 | -9% | -9% | 0% | $8,821,754 |
| CYL | Catalyst Metals | 1.045 | -9% | 20% | 24% | $221,558,544 |
| CHN | Chalice Mining Ltd | 1.64 | 4% | 40% | -6% | $616,506,837 |
| KAL | Kalgoorliegoldmining | 0.032 | 0% | 3% | 1% | $5,547,525 |
| MLS | Metals Australia | 0.022 | 0% | 5% | -2% | $15,562,130 |
| ADN | Andromeda Metals Ltd | 0.019 | 12% | 0% | -1% | $59,095,148 |
| MEI | Meteoric Resources | 0.1825 | -1% | -17% | -8% | $358,221,572 |
| SRN | Surefire Rescs NL | 0.008 | -11% | -20% | 0% | $15,890,463 |
| SIH | Sihayo Gold Limited | 0.0025 | -17% | 0% | 0% | $24,408,512 |
| WA8 | Warriedarresourltd | 0.052 | 6% | 4% | 0% | $32,542,611 |
| HMX | Hammer Metals Ltd | 0.035 | -5% | -8% | -2% | $31,024,257 |
| WCN | White Cliff Min Ltd | 0.019 | 12% | 19% | 1% | $30,863,361 |
| AVM | Advance Metals Ltd | 0.025 | -4% | 9% | -1% | $1,003,149 |
| WRM | White Rock Min Ltd | 0 | -100% | -100% | -6% | $17,508,200 |
| ASR | Asra Minerals Ltd | 0.005 | -29% | -29% | 0% | $8,319,979 |
| MCT | Metalicity Limited | 0.002 | 0% | 0% | 0% | $8,971,705 |
| AME | Alto Metals Limited | 0.036 | -5% | 20% | -1% | $26,696,357 |
| CTO | Citigold Corp Ltd | 0.005 | 0% | -17% | 0% | $13,500,000 |
| TIE | Tietto Minerals | 0.675 | 0% | 0% | 7% | $773,881,054 |
| SMI | Santana Minerals Ltd | 1.08 | 3% | -3% | 7% | $215,146,693 |
| M2R | Miramar | 0.009 | -18% | -10% | -1% | $1,860,869 |
| MHC | Manhattan Corp Ltd | 0.002 | 0% | 0% | 0% | $4,405,470 |
| GRL | Godolphin Resources | 0.025 | -7% | 0% | -1% | $4,966,460 |
| SVG | Savannah Goldfields | 0.026 | -7% | -26% | -2% | $7,308,208 |
| EMC | Everest Metals Corp | 0.12 | -11% | 33% | 4% | $19,713,973 |
| GUL | Gullewa Limited | 0.071 | 0% | 29% | 2% | $14,538,890 |
| CY5 | Cygnus Metals Ltd | 0.05 | -29% | -36% | -9% | $14,961,316 |
| G50 | G50Corp Ltd | 0.155 | 3% | 0% | 2% | $16,939,950 |
| ADV | Ardiden Ltd | 0.145 | -3% | -6% | -3% | $9,065,038 |
| AAR | Astral Resources NL | 0.08 | -5% | 23% | 1% | $72,010,210 |
| VMC | Venus Metals Cor Ltd | 0.082 | -9% | -9% | -2% | $15,557,752 |
| NAE | New Age Exploration | 0.004 | 33% | 0% | 0% | $7,175,596 |
| VKA | Viking Mines Ltd | 0.009 | -10% | -10% | -1% | $9,227,326 |
| LCL | LCL Resources Ltd | 0.011 | 0% | -8% | -1% | $11,462,706 |
| MTH | Mithril Resources | 0.22 | -6% | 10% | 2% | $18,183,888 |
| ADG | Adelong Gold Limited | 0.005 | 25% | 25% | 0% | $5,589,945 |
| RMX | Red Mount Min Ltd | 0.001 | 0% | 0% | 0% | $3,423,577 |
| PRS | Prospech Limited | 0.038 | -3% | -17% | 1% | $10,265,651 |
| TTM | Titan Minerals | 0.033 | 6% | 14% | 1% | $61,801,131 |
| NML | Navarre Minerals Ltd | 0.019 | 0% | 0% | 0% | $28,555,654 |
| MZZ | Matador Mining Ltd | 0.062 | -14% | -10% | 2% | $33,581,598 |
| KZR | Kalamazoo Resources | 0.096 | -4% | 10% | -2% | $16,188,015 |
| BCN | Beacon Minerals | 0.0275 | -5% | -5% | 0% | $105,189,509 |
| MAU | Magnetic Resources | 1.08 | -3% | 3% | 6% | $276,060,635 |
| BC8 | Black Cat Syndicate | 0.31 | -10% | 22% | 6% | $94,108,801 |
| EM2 | Eagle Mountain | 0.056 | -14% | -23% | -2% | $23,572,495 |
| EMR | Emerald Res NL | 3.83 | 4% | 13% | 82% | $2,476,042,355 |
| BYH | Bryah Resources Ltd | 0.008 | 0% | 0% | -1% | $3,483,628 |
| HCH | Hot Chili Ltd | 0.995 | -6% | -4% | -9% | $148,318,302 |
| WAF | West African Res Ltd | 1.5275 | 7% | 13% | 58% | $1,546,795,033 |
| MEU | Marmota Limited | 0.044 | 5% | 2% | 0% | $44,469,624 |
| NVA | Nova Minerals Ltd | 0.205 | -13% | -25% | -16% | $40,464,974 |
| SVL | Silver Mines Limited | 0.185 | -3% | 12% | 3% | $278,986,708 |
| PGD | Peregrine Gold | 0.25 | -4% | 14% | 1% | $16,969,605 |
| ICL | Iceni Gold | 0.08 | 16% | 248% | 3% | $19,093,274 |
| FG1 | Flynngold | 0.028 | 0% | 4% | -2% | $6,872,707 |
| WWI | West Wits Mining Ltd | 0.0135 | 4% | -7% | 0% | $32,995,091 |
| RML | Resolution Minerals | 0.002 | 0% | -20% | 0% | $3,220,044 |
| AAJ | Aruma Resources Ltd | 0.016 | -6% | 7% | -1% | $3,544,047 |
| AL8 | Alderan Resource Ltd | 0.005 | 0% | 0% | 0% | $5,534,307 |
| GMN | Gold Mountain Ltd | 0.0035 | -13% | -13% | 0% | $9,371,068 |
| MEG | Megado Minerals Ltd | 0.011 | -8% | 10% | -2% | $2,799,011 |
| HMG | Hamelingoldlimited | 0.085 | -6% | 8% | 1% | $13,387,500 |
| TBA | Tombola Gold Ltd | 0.026 | 0% | 0% | 0% | $33,129,243 |
| BM8 | Battery Age Minerals | 0.165 | 3% | 65% | -3% | $16,279,225 |
| TBR | Tribune Res Ltd | 3.73 | 2% | -17% | 78% | $174,194,016 |
| FML | Focus Minerals Ltd | 0.155 | -3% | 19% | -3% | $44,416,590 |
| GSR | Greenstone Resources | 0.011 | -15% | 10% | 0% | $15,105,830 |
| VRC | Volt Resources Ltd | 0.004 | 0% | -20% | 0% | $20,793,391 |
| ARV | Artemis Resources | 0.013 | -13% | -24% | -1% | $26,462,942 |
| HRN | Horizon Gold Ltd | 0.265 | 0% | 2% | -4% | $39,106,779 |
| CLA | Celsius Resource Ltd | 0.01 | 11% | 0% | 0% | $24,279,127 |
| QML | Qmines Limited | 0.061 | -8% | 0% | -2% | $13,298,188 |
| RDN | Raiden Resources Ltd | 0.035 | -22% | -3% | -1% | $100,398,112 |
| TCG | Turaco Gold Limited | 0.215 | 2% | 16% | 9% | $164,579,556 |
| KCC | Kincora Copper | 0.059 | 20% | 64% | 2% | $1,207,886 |
| GBZ | GBM Rsources Ltd | 0.011 | 0% | 10% | 0% | $12,723,578 |
| DTM | Dart Mining NL | 0.023 | -12% | -18% | 1% | $5,943,956 |
| MKR | Manuka Resources. | 0.042 | -7% | -39% | -4% | $29,631,791 |
| AUC | Ausgold Limited | 0.038 | 3% | 41% | 1% | $73,476,519 |
| ANX | Anax Metals Ltd | 0.036 | -12% | -10% | 1% | $20,696,098 |
| EMU | EMU NL | 0.029 | 9% | 44% | 0% | $2,276,433 |
| SFM | Santa Fe Minerals | 0.04 | 0% | -15% | 0% | $2,912,752 |
| SSR | SSR Mining Inc. | 7.76 | 0% | -3% | -806% | $32,434,496 |
| PNR | Pantoro Limited | 0.093 | 4% | 12% | 4% | $574,012,377 |
| CMM | Capricorn Metals | 4.785 | 4% | 2% | 8% | $1,766,831,185 |
| X64 | Ten Sixty Four Ltd | 0.57 | 0% | 0% | 0% | $130,184,182 |
| SI6 | SI6 Metals Limited | 0.003 | 0% | 20% | 0% | $7,106,578 |
| HAW | Hawthorn Resources | 0.07 | 0% | -1% | -2% | $23,451,093 |
| BGD | Bartongoldholdings | 0.3 | -5% | -3% | 4% | $64,504,382 |
| SVY | Stavely Minerals Ltd | 0.042 | -14% | 45% | 0% | $16,041,484 |
| AGC | AGC Ltd | 0.34 | -28% | 247% | 27% | $74,872,656 |
| RGL | Riversgold | 0.007 | 0% | 17% | -1% | $8,467,038 |
| TSO | Tesoro Gold Ltd | 0.039 | 0% | -9% | 1% | $46,724,067 |
| GUE | Global Uranium | 0.092 | -6% | -20% | -1% | $24,443,226 |
| CPM | Coopermetalslimited | 0.078 | -29% | -32% | -26% | $6,581,875 |
| MM8 | Medallion Metals. | 0.048 | 0% | -8% | -2% | $15,384,208 |
| FFM | Firefly Metals Ltd | 0.74 | -1% | -8% | 11% | $346,109,733 |
| CBY | Canterbury Resources | 0.054 | 6% | -8% | 3% | $9,102,267 |
| LYN | Lycaonresources | 0.24 | -2% | -38% | 4% | $13,246,206 |
| SFR | Sandfire Resources | 8.99 | -2% | -7% | 165% | $4,157,393,946 |
| TMZ | Thomson Res Ltd | 0.005 | 0% | 0% | 0% | $4,881,018 |
| TAM | Tanami Gold NL | 0.033 | -8% | -13% | 0% | $38,778,203 |
| WMC | Wiluna Mining Corp | 0 | -100% | -100% | -21% | $74,238,031 |
| NWM | Norwest Minerals | 0.028 | -20% | -39% | 0% | $11,255,466 |
| ALK | Alkane Resources Ltd | 0.56 | 1% | -3% | -10% | $334,937,220 |
| BMO | Bastion Minerals | 0.007 | 0% | 17% | -1% | $3,014,087 |
| IDA | Indiana Resources | 0.077 | -3% | -3% | 0% | $47,612,503 |
| GSM | Golden State Mining | 0.011 | 10% | -8% | 0% | $3,073,077 |
| NSM | Northstaw | 0.028 | -10% | -30% | -2% | $3,916,522 |
| GSN | Great Southern | 0.019 | 0% | -5% | 0% | $15,532,190 |
| RED | Red 5 Limited | 0.45 | 3% | 5% | 14% | $1,576,029,250 |
| DEG | De Grey Mining | 1.13 | 5% | -7% | -11% | $2,660,308,705 |
| THR | Thor Energy PLC | 0.016 | -11% | -6% | -1% | $3,246,943 |
| CDR | Codrus Minerals Ltd | 0.054 | 4% | 29% | 0% | $8,930,925 |
| MDI | Middle Island Res | 0.013 | -13% | -24% | 0% | $3,049,956 |
| WTM | Waratah Minerals Ltd | 0.098 | -7% | -18% | -2% | $17,936,450 |
| POL | Polymetals Resources | 0.34 | -3% | 21% | 3% | $57,666,233 |
| RDS | Redstone Resources | 0.004 | 0% | 0% | 0% | $3,701,514 |
| NAG | Nagambie Resources | 0.01 | -17% | -9% | -2% | $7,169,721 |
| BGL | Bellevue Gold Ltd | 2 | 8% | 19% | 33% | $2,319,363,446 |
| GBR | Greatbould Resources | 0.06 | 2% | -2% | -1% | $35,162,856 |
| KAI | Kairos Minerals Ltd | 0.009 | -18% | -25% | -1% | $23,588,210 |
| KAU | Kaiser Reef | 0.145 | 0% | 12% | -3% | $24,801,365 |
| HRZ | Horizon | 0.045 | -6% | 10% | 0% | $32,245,249 |
| CAI | Calidus Resources | 0.12 | -4% | 0% | -10% | $97,751,171 |
| CDT | Castle Minerals | 0.0055 | -8% | 0% | 0% | $6,122,465 |
| RSG | Resolute Mining | 0.5825 | 9% | 39% | 14% | $1,160,332,257 |
| MXR | Maximus Resources | 0.029 | 0% | -6% | -1% | $11,981,975 |
| EVN | Evolution Mining Ltd | 4.025 | 5% | 8% | 7% | $7,844,217,144 |
| CXU | Cauldron Energy Ltd | 0.032 | -14% | -22% | 1% | $38,022,450 |
| DLI | Delta Lithium | 0.2525 | -10% | -16% | -22% | $171,217,714 |
| ALY | Alchemy Resource Ltd | 0.007 | -13% | -13% | 0% | $8,835,572 |
| HXG | Hexagon Energy | 0.019 | 6% | -10% | 1% | $9,745,402 |
| OBM | Ora Banda Mining Ltd | 0.345 | 3% | 11% | 11% | $621,958,887 |
| SLR | Silver Lake Resource | 1.5375 | 6% | 7% | 35% | $1,492,186,284 |
| AVW | Avira Resources Ltd | 0.001 | 0% | -33% | 0% | $2,663,790 |
| LCY | Legacy Iron Ore | 0.015 | 7% | -12% | 0% | $107,989,676 |
| PDI | Predictive Disc Ltd | 0.19 | 3% | -3% | -2% | $445,151,377 |
| MAT | Matsa Resources | 0.03 | 7% | -12% | 0% | $15,413,304 |
| ZAG | Zuleika Gold Ltd | 0.022 | 5% | 22% | 0% | $14,721,710 |
| GML | Gateway Mining | 0.034 | 55% | 100% | 1% | $13,050,161 |
| SBM | St Barbara Limited | 0.2475 | 5% | 1% | 4% | $192,223,039 |
| SBR | Sabre Resources | 0.017 | -6% | 0% | -2% | $6,362,453 |
| STK | Strickland Metals | 0.12 | 9% | 20% | 3% | $223,716,801 |
| ION | Iondrive Limited | 0.01 | 0% | 25% | 0% | $4,862,853 |
| CEL | Challenger Gold Ltd | 0.068 | 0% | -4% | -1% | $93,212,228 |
| LRL | Labyrinth Resources | 0.005 | 0% | -17% | 0% | $5,937,719 |
| NST | Northern Star | 14.53 | 4% | 0% | 88% | $16,713,544,513 |
| OZM | Ozaurum Resources | 0.05 | -2% | 0% | -10% | $7,143,750 |
| TG1 | Techgen Metals Ltd | 0.035 | -15% | 6% | -4% | $4,740,905 |
| XAM | Xanadu Mines Ltd | 0.064 | 3% | -7% | 1% | $109,824,385 |
| AQI | Alicanto Min Ltd | 0.017 | -15% | -26% | -2% | $10,464,976 |
| KTA | Krakatoa Resources | 0.016 | 0% | -16% | -2% | $7,553,716 |
| ARN | Aldoro Resources | 0.062 | -17% | -5% | -6% | $9,154,415 |
| WGX | Westgold Resources. | 2.405 | 7% | 12% | 23% | $1,103,540,961 |
| MBK | Metal Bank Ltd | 0.023 | 0% | 10% | 0% | $8,980,564 |
| A8G | Australasian Metals | 0.08 | -20% | 0% | -9% | $4,169,640 |
| TAR | Taruga Minerals | 0.007 | -13% | -22% | 0% | $4,942,187 |
| DTR | Dateline Resources | 0.01 | -13% | 0% | 0% | $16,033,016 |
| GOR | Gold Road Res Ltd | 1.6975 | 6% | 8% | -27% | $1,809,185,420 |
| S2R | S2 Resources | 0.12 | -4% | 0% | -5% | $56,607,249 |
| NES | Nelson Resources. | 0.003 | 0% | 0% | 0% | $1,840,783 |
| TLM | Talisman Mining | 0.28 | -20% | 4% | 5% | $53,671,299 |
| BEZ | Besragoldinc | 0.105 | 0% | 9% | -5% | $40,555,788 |
| PRU | Perseus Mining Ltd | 2.48 | 8% | 12% | 63% | $3,352,050,565 |
| SPQ | Superior Resources | 0.0075 | -17% | -17% | -1% | $16,009,763 |
| PUR | Pursuit Minerals | 0.004 | -20% | -20% | 0% | $14,719,857 |
| RMS | Ramelius Resources | 1.9925 | 7% | 3% | 31% | $2,240,100,680 |
| PKO | Peako Limited | 0.006 | 50% | 20% | 0% | $3,162,508 |
| ICG | Inca Minerals Ltd | 0.007 | 0% | 17% | 0% | $5,633,172 |
| A1G | African Gold Ltd. | 0.024 | -23% | -4% | 0% | $5,741,177 |
| OAU | Ora Gold Limited | 0.0045 | -10% | -10% | 0% | $32,135,218 |
| GNM | Great Northern | 0.012 | 9% | 14% | -1% | $2,164,807 |
| KRM | Kingsrose Mining Ltd | 0.05 | 11% | 47% | 1% | $37,626,326 |
| BTR | Brightstar Resources | 0.0155 | 3% | -3% | 0% | $68,549,770 |
| RRL | Regis Resources | 1.9225 | 7% | -8% | -26% | $1,401,153,489 |
| M24 | Mamba Exploration | 0.02 | 0% | -9% | -3% | $3,497,563 |
| TRM | Truscott Mining Corp | 0.067 | 6% | -4% | 1% | $11,268,859 |
| TNC | True North Copper | 0.057 | 0% | -23% | -4% | $40,613,355 |
| MOM | Moab Minerals Ltd | 0.004 | -20% | -20% | 0% | $2,847,852 |
| KNB | Koonenberrygold | 0.019 | -5% | 12% | -2% | $5,755,749 |
| AWJ | Auric Mining | 0.195 | 11% | 22% | 8% | $27,482,374 |
| AZS | Azure Minerals | 0 | -100% | -100% | -370% | $1,692,527,632 |
| ENR | Encounter Resources | 0.35 | 3% | -9% | 6% | $157,492,319 |
| SNG | Siren Gold | 0.08 | 3% | 23% | 1% | $16,185,926 |
| STN | Saturn Metals | 0.235 | 0% | 7% | 7% | $52,640,582 |
| USL | Unico Silver Limited | 0.1525 | -5% | 2% | 3% | $42,614,852 |
| PNM | Pacific Nickel Mines | 0.03 | -9% | 3% | -5% | $12,129,340 |
| AYM | Australia United Min | 0.002 | 0% | -33% | 0% | $3,685,155 |
| ANL | Amani Gold Ltd | 0.001 | 0% | 0% | 0% | $25,143,441 |
| HAV | Havilah Resources | 0.175 | -20% | -17% | -2% | $60,161,450 |
| SPR | Spartan Resources | 0.745 | 1% | 30% | 23% | $817,391,336 |
| PNT | Panthermetalsltd | 0.045 | 2% | 15% | -2% | $3,922,477 |
| MEK | Meeka Metals Limited | 0.033 | -8% | -3% | -1% | $41,980,104 |
| GMD | Genesis Minerals | 1.9925 | 11% | 17% | 20% | $2,154,112,005 |
| PGO | Pacgold | 0.14 | -7% | -10% | -5% | $10,518,180 |
| FEG | Far East Gold | 0.11 | -4% | -21% | -2% | $28,334,552 |
| MI6 | Minerals260Limited | 0.15 | -12% | 5% | -17% | $37,440,000 |
| IGO | IGO Limited | 6.88 | -1% | -13% | -217% | $5,194,857,197 |
| GAL | Galileo Mining Ltd | 0.27 | 10% | -2% | -2% | $52,370,606 |
| RXL | Rox Resources | 0.16 | -3% | -3% | -2% | $65,130,758 |
| KIN | KIN Min NL | 0.061 | 3% | -5% | -1% | $68,332,732 |
| CLZ | Classic Min Ltd | 0.003 | -25% | -57% | -5% | $1,366,324 |
| TGM | Theta Gold Mines Ltd | 0.15 | 15% | -6% | 4% | $103,173,277 |
| FAL | Falconmetalsltd | 0.26 | -4% | 100% | 12% | $49,560,000 |
| SXG | Southern Cross Gold | 2.8 | -1% | 15% | 154% | $545,616,924 |
| SPD | Southernpalladium | 0.42 | -21% | -14% | 5% | $18,523,681 |
| ORN | Orion Minerals Ltd | 0.018 | 0% | -5% | 0% | $109,001,489 |
| TMB | Tambourahmetals | 0.073 | 4% | 3% | -4% | $5,888,765 |
| TMS | Tennant Minerals Ltd | 0.022 | 5% | 5% | -1% | $21,029,589 |
| AZY | Antipa Minerals Ltd | 0.013 | -7% | 8% | 0% | $55,883,917 |
| PXX | Polarx Limited | 0.012 | -14% | -8% | 1% | $24,605,790 |
| TRE | Toubani Res Ltd | 0.17 | 10% | 42% | 3% | $27,609,793 |
| AUN | Aurumin | 0.041 | 5% | 21% | 2% | $18,136,219 |
| GPR | Geopacific Resources | 0.022 | -4% | 0% | 0% | $20,064,131 |
| FXG | Felix Gold Limited | 0.055 | -10% | -24% | 1% | $14,063,341 |
| ILT | Iltani Resources Lim | 0.3 | -6% | 50% | 14% | $9,522,941 |
| ARD | Argent Minerals | 0.02 | -9% | 18% | 1% | $23,301,662 |
Related Stories


UNLOCK INSIGHTS
Discover the untold stories of emerging ASX stocks.
Daily news and expert analysis, it's free to subscribe.
By proceeding, you confirm you understand that we handle personal information in accordance with our Privacy Policy.


