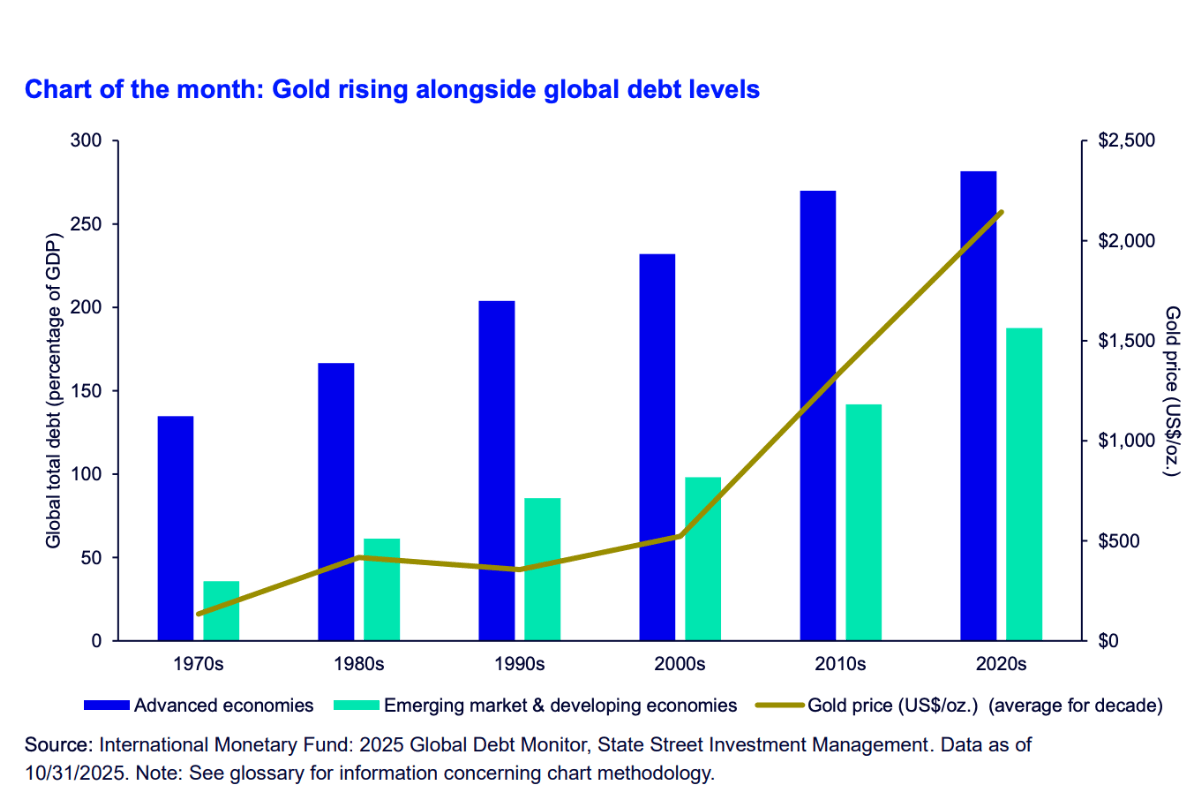
Gold Digger: State Street sees US$5000/oz gold on the cards in 2026

Gold's run has raised the prospect of even higher prices, with bullish fundamentals still in play. Pic: Getty Images
- Conditions in place for more gold price consolidation, State Street says
- Now a 35% probability of hitting US$4100-4500/oz in near term, with US$4800-5000 on the cards in 2026
- LinQ Minerals and Alice Queen lead gold stock gains in quiet news week
One of the world’s biggest asset managers has joined the calls of investment banks, saying gold has a potential path to US$5000/oz, saying it wouldn’t be surprised if we hit that mark in 2026.
State Street Investment Management’s head of gold strategy Aakash Doshi, joined by stategists Mohamad Abukhalaf and Diego Andrade, says the firm would not be surprised to see a US$4800-5000/oz range hit next year.
They believe that while gold may have screamed “overbought” on technical charts, it is still an “under-owned” portfolio asset.
“Global bullion ETF tonnage remains below the 2020 pandemic high and money manager net length on Comex gold futures/options are well below historical peaks,” Doshi and his team wrote in State Street’s latest monthly monitor.
“Gold might also benefit from incremental investment flows as portfolio managers shift out of money market mutual funds that hold a record ~US$7.3tn in assets. Unmanaged long duration exposure may also be a source, as the Fed cuts policy rates and the US Treasury curve has the potential to further bull steepen.”
What this translates to is higher prices across State Street’s forecast scenarios, revised for the first time since April.
A base case with a 50% probability is now US$3700-4100/oz, up from US$3100-3500/oz, the bear case (15%) is now US$3300-3700/oz, up from US$2700-3100/oz, and the raging bull case is now US$4100-4500/oz, up from US$3500-3900/oz. That’s a 35% probability, Doshi and his team say.
Mental, and good for gold miners if it materialises as it briefly threatened to in October.
Why are experts bullish?
With gold already on track for its best single year performance since 1979, why are experts so bullish that the trend could continue?
The key factors State Street is looking at are global debt levels, interest rate cuts in the US, central bank buying and gold ETF flows.
“October added ~US$8.2 billion to gold ETFs, following a record 3Q haul with US$26 billion of inflows (surpassing the prior quarterly high of US$24 billion in 2Q 2020),” strategists said.
“Year-to-date notional flows now total ~US$72 billion, already above the 2020 full-year record. Yet tonnage suggests scope to expand.”
If there is a stronger than expected November and December, typically periods of liquidation in ETFs, it could lead to a new high in total holdings.
“November/December gold ETF seasonals tend to be weak, even during bull runs (e.g. those two months have historically shown the highest level of redemptions even during strong market years like 2020 and 2024). That said, we think any potential end-2025 liquidation or profit-taking event will be a buying opportunity in the current macro regime,” they wrote.
Central bank buying is projected to be around 900t, below the past three record years but higher than any other point in the past 60, with major buyer Poland upping its reserve share target held in gold from 20 to 30%.
Rising US debt levels have, in particular, been a big driver of higher gold prices, with bullion acting as a hedge against virtually “unconstrained credit creation”.
“The cost to service US government debt has more than doubled since 2000 to a record US$1.1 trillion this year,” the strategists said.
“Peacetime US deficits of over 5% of GDP are unheard of in modern financial markets, drawing investor scrutiny and demand for alternative fiscal hedges like gold.
“With the current trajectory of fiscal policy still stimulative, it is likely gold will keep benefiting from this phenomenon into 2026. Especially with no debt/deficit resolutions in discussion in the near term.”
Winners and losers
Here’s how ASX-listed precious metals stocks are performing:
| CODE | COMPANY | PRICE | WEEK % | MONTH % | 6 MONTH % | YEAR % | YTD % | MARKET CAP |
|---|---|---|---|---|---|---|---|---|
| MRR | Minrex Resources Ltd | 0.012 | -8% | -8% | 41% | 50% | 71% | $ 11,933,542.53 |
| NPM | Newpeak Metals | 0.019 | -21% | 19% | 27% | 58% | 73% | $ 6,253,723.16 |
| MTC | Metalstech Ltd | 0.25 | -6% | -22% | 127% | 67% | 79% | $ 58,844,564.40 |
| GED | Golden Deeps | 0.05 | -7% | -32% | 178% | 67% | 100% | $ 12,177,391.93 |
| G88 | Golden Mile Res Ltd | 0.0085 | -6% | -15% | -29% | -43% | -6% | $ 5,007,080.26 |
| LAT | Latitude 66 Limited | 0.05 | -18% | -30% | -4% | -50% | 32% | $ 7,026,634.55 |
| NMR | Native Mineral Res | 0.083 | -6% | -25% | -54% | 159% | 113% | $ 84,283,880.44 |
| AQX | Alice Queen Ltd | 0.005 | 25% | 25% | -17% | -29% | -38% | $ 7,534,863.12 |
| SLZ | Sultan Resources Ltd | 0.008 | -20% | -11% | 33% | -20% | 33% | $ 4,826,884.49 |
| KSN | Kingston Resources | 0.13 | 13% | -21% | 37% | 30% | 83% | $ 109,205,249.79 |
| AMI | Aurelia Metals Ltd | 0.2225 | -5% | -16% | -23% | 20% | 31% | $ 380,828,844.00 |
| GIB | Gibb River Diamonds | 0.057 | -7% | -5% | 58% | 54% | 43% | $ 12,227,038.37 |
| KCN | Kingsgate Consolid. | 4.34 | 24% | 13% | 130% | 195% | 238% | $ 1,136,684,961.72 |
| TMX | Terrain Minerals | 0.0045 | -25% | 13% | 50% | 29% | 50% | $ 13,409,071.36 |
| BNR | Bulletin Res Ltd | 0.048 | -6% | -19% | -34% | 9% | 23% | $ 14,093,439.50 |
| NXM | Nexus Minerals Ltd | 0.082 | 5% | 12% | 14% | 37% | 82% | $ 47,093,249.81 |
| LM8 | Lunnonmetalslimited | 0.3 | 5% | -12% | 30% | -8% | 20% | $ 62,534,902.64 |
| CST | Castile Resources | 0.095 | -14% | -1% | 28% | 22% | 19% | $ 29,046,115.10 |
| YRL | Yandal Resources | 0.27 | -8% | -36% | 59% | -24% | 54% | $ 111,908,376.00 |
| FAU | First Au Ltd | 0.007 | -13% | -22% | 180% | 250% | 250% | $ 18,350,392.95 |
| GWR | GWR Group Ltd | 0.1 | -5% | -5% | 8% | 16% | 25% | $ 32,360,665.50 |
| IVR | Investigator Res Ltd | 0.049 | -2% | -21% | 109% | 9% | 145% | $ 97,333,988.60 |
| IPT | Impact Minerals | 0.006 | 0% | 0% | 0% | -47% | -36% | $ 28,464,595.19 |
| BNZ | Benzmining | 1.46 | -3% | -15% | 284% | 403% | 323% | $ 304,715,537.07 |
| MOH | Moho Resources | 0.008 | 0% | 0% | 100% | 14% | 60% | $ 7,126,046.05 |
| SMS | Starmineralslimited | 0.043 | -19% | -17% | 59% | -4% | 19% | $ 10,020,275.96 |
| MVL | Marvel Gold Limited | 0.017 | 6% | -11% | 21% | 31% | 89% | $ 24,130,803.78 |
| PRX | Prodigy Gold NL | 0.061 | 11% | 22% | 53% | 2% | 53% | $ 19,214,322.26 |
| AAU | Antilles Gold Ltd | 0.008 | -16% | -20% | 100% | 100% | 167% | $ 22,500,544.13 |
| RND | Rand Mining Ltd | 2.3 | -10% | -7% | 18% | 12% | 52% | $ 127,970,912.25 |
| CAZ | Cazaly Resources | 0.034 | 3% | 3% | 113% | 143% | 143% | $ 16,825,108.00 |
| BMR | Ballymore Resources | 0.155 | -3% | -3% | 15% | 3% | 29% | $ 31,958,356.17 |
| DRE | Dreadnought Resources Ltd | 0.032 | -3% | -27% | 146% | 100% | 167% | $ 184,594,928.53 |
| ZNC | Zenith Minerals Ltd | 0.086 | -9% | -48% | 79% | 87% | 115% | $ 45,298,101.91 |
| REZ | Resourc & En Grp Ltd | 0.017 | 0% | -29% | -19% | -43% | -26% | $ 13,524,103.62 |
| LEX | Lefroy Exploration | 0.16 | -3% | -6% | 105% | 111% | 129% | $ 38,505,121.39 |
| ERM | Emmerson Resources | 0.29 | 5% | 23% | 107% | 437% | 277% | $ 181,171,035.54 |
| AS1 | Asara Resources Ltd | 0.074 | 7% | -16% | 61% | 270% | 289% | $ 117,031,981.44 |
| CYL | Catalyst Metals | 7.05 | 5% | -14% | 21% | 107% | 173% | $ 1,822,718,455.29 |
| CHN | Chalice Mining Ltd | 1.78 | -10% | -27% | 52% | 0% | 61% | $ 702,335,591.76 |
| KAL | Kalgoorliegoldmining | 0.059 | -6% | 0% | 37% | 195% | 228% | $ 27,781,537.75 |
| MLS | Metals Australia | 0.031 | 0% | -6% | 59% | 29% | 35% | $ 21,951,585.72 |
| SRN | Surefire Rescs NL | 0.002 | 0% | 0% | -20% | -40% | -32% | $ 8,051,218.50 |
| WA8 | Warriedarresourltd | 0.2475 | 8% | 18% | 136% | 385% | 463% | $ 286,823,853.70 |
| HMX | Hammer Metals Ltd | 0.026 | -16% | -37% | -26% | -32% | -21% | $ 24,104,484.90 |
| WCN | White Cliff Min Ltd | 0.018 | -10% | -5% | -36% | 0% | 13% | $ 48,967,904.08 |
| AVM | Advance Metals Ltd | 0.078 | -16% | -51% | 70% | 73% | 129% | $ 31,199,319.12 |
| GA8 | Goldarc Resources | 0.046 | -8% | 48% | 130% | 53% | 53% | $ 26,673,407.10 |
| ARI | Arika Resources | 0.0285 | -14% | -19% | -19% | 19% | 6% | $ 25,181,857.46 |
| CTO | Citigold Corp Ltd | 0.012 | -8% | 33% | 200% | 200% | 200% | $ 36,000,000.00 |
| SMI | Santana Minerals Ltd | 0.825 | 11% | 5% | 47% | 26% | 70% | $ 681,698,358.02 |
| M2R | Miramar | 0.003 | -14% | 0% | 0% | -45% | 0% | $ 3,584,769.73 |
| MHC | Manhattan Corp Ltd | 0.025 | -11% | -17% | 56% | 25% | 32% | $ 13,376,966.93 |
| GRL | Godolphin Resources | 0.0135 | -16% | -33% | 35% | -21% | -7% | $ 9,746,193.20 |
| SVG | Savannah Goldfields | 0.019 | -14% | -34% | -17% | 3% | 3% | $ 40,689,963.74 |
| EMC | Everest Metals Corp | 0.11 | -10% | -12% | -24% | -15% | -19% | $ 30,866,806.96 |
| GUL | Gullewa Limited | 0.084 | 8% | -1% | 1% | 20% | 50% | $ 18,313,862.45 |
| CY5 | Cygnus Metals Ltd | 0.13 | -4% | -10% | 65% | -4% | 30% | $ 138,375,245.84 |
| G50 | G50Corp Ltd | 0.545 | 11% | 43% | 419% | 276% | 252% | $ 115,551,915.63 |
| ADV | Ardiden Ltd | 0.295 | -8% | 59% | 111% | 119% | 119% | $ 19,380,426.86 |
| AAR | Astral Resources NL | 0.1825 | -9% | -24% | 18% | 30% | 35% | $ 272,765,007.33 |
| VMC | Venus Metals Cor Ltd | 0.13 | 4% | -4% | 18% | 86% | 94% | $ 26,477,372.21 |
| NAE | New Age Exploration | 0.003 | 0% | 0% | 0% | -50% | -14% | $ 9,923,995.91 |
| VKA | Viking Mines Ltd | 0.007 | 8% | 0% | -13% | -36% | -13% | $ 9,518,281.83 |
| LCL | LCL Resources Ltd | 0.007 | 0% | -13% | 17% | -22% | -30% | $ 8,394,800.06 |
| MTH | Mithril Silver Gold | 0.455 | -14% | -27% | 23% | 2% | 14% | $ 90,244,070.28 |
| ADG | Adelong Gold Limited | 0.0105 | -19% | 17% | 31% | 133% | 133% | $ 25,668,363.62 |
| RMX | Red Mount Min Ltd | 0.036 | 16% | 20% | 414% | 260% | 300% | $ 29,900,640.71 |
| PRS | Prospech Limited | 0.016 | -6% | -20% | -38% | -41% | -43% | $ 8,376,190.10 |
| TTM | Titan Minerals | 0.55 | 3% | 25% | 39% | 11% | 45% | $ 170,476,764.75 |
| AKA | Aureka Limited | 0.135 | 4% | 13% | 13% | -99% | 0% | $ 16,019,678.00 |
| AAM | Aumegametals | 0.037 | -23% | -12% | -3% | -26% | -12% | $ 24,250,027.88 |
| KZR | Kalamazoo Resources | 0.17 | 3% | -3% | 100% | 81% | 130% | $ 42,282,754.33 |
| BCN | Beacon Minerals | 2.43 | 0% | -8% | 125% | 164% | 176% | $ 275,217,072.00 |
| MAU | Magnetic Resources | 1.23 | -4% | -23% | -18% | 2% | 11% | $ 376,463,328.90 |
| BC8 | Black Cat Syndicate | 0.94 | -1% | -35% | -4% | 72% | 66% | $ 672,319,952.76 |
| EM2 | Eagle Mountain | 0.008 | 0% | 0% | 33% | -79% | -11% | $ 9,080,298.31 |
| EMR | Emerald Res NL | 5.15 | 13% | 4% | 18% | 27% | 58% | $ 3,379,668,136.96 |
| BYH | Bryah Resources Ltd | 0.004 | -11% | -11% | 0% | 0% | 33% | $ 5,942,662.66 |
| HCH | Hot Chili Ltd | 0.84 | -13% | -19% | 78% | 0% | 21% | $ 155,191,587.25 |
| WAF | West African Res Ltd | 3.04 | 0% | 0% | 25% | 77% | 112% | $ 3,468,834,827.52 |
| MEU | Marmota Limited | 0.061 | -5% | 17% | 42% | 65% | 56% | $ 73,054,958.98 |
| NVA | Nova Minerals Ltd | 0.865 | 6% | 57% | 158% | 284% | 134% | $ 365,623,727.53 |
| SVL | Silver Mines Limited | 0.1625 | -2% | -26% | 63% | 55% | 108% | $ 342,735,395.84 |
| PGD | Peregrine Gold | 0.275 | 25% | -11% | 83% | 83% | 96% | $ 23,143,764.68 |
| ICL | Iceni Gold | 0.055 | -2% | -11% | -2% | 15% | -23% | $ 19,602,378.95 |
| FG1 | Flynngold | 0.022 | 0% | -4% | -7% | -31% | -11% | $ 13,390,416.51 |
| WWI | West Wits Mining Ltd | 0.05 | -6% | -17% | 138% | 285% | 257% | $ 195,572,212.72 |
| RML | Resolution Minerals | 0.08 | -4% | 86% | 789% | 400% | 567% | $ 151,606,756.51 |
| AAJ | Aruma Resources Ltd | 0.015 | -21% | 50% | 67% | -17% | 25% | $ 7,430,854.82 |
| HWK | Hawk Resources. | 0.032 | -14% | 78% | 78% | -20% | 45% | $ 10,837,177.57 |
| GMN | Gold Mountain Ltd | 0.065 | -8% | -28% | -28% | -28% | -52% | $ 11,895,177.19 |
| MEG | Megado Minerals Ltd | 0.03 | -3% | -17% | 173% | 125% | 76% | $ 21,307,547.65 |
| HMG | Hamelingoldlimited | 0.071 | -19% | 1% | -19% | -16% | 11% | $ 14,872,767.83 |
| BM8 | Battery Age Minerals | 0.145 | -6% | -6% | 159% | 53% | 38% | $ 27,321,276.45 |
| TBR | Tribune Res Ltd | 6.27 | -6% | -4% | 21% | 28% | 46% | $ 317,431,865.85 |
| FML | Focus Minerals Ltd | 2.655 | 7% | 44% | 1054% | 1297% | 1462% | $ 793,767,446.65 |
| VRC | Volt Resources Ltd | 0.006 | -14% | 20% | 20% | 50% | 100% | $ 32,793,945.88 |
| ARV | Artemis Resources | 0.009 | -10% | 13% | 29% | -25% | 13% | $ 30,167,377.32 |
| HRN | Horizon Gold Ltd | 0.72 | -1% | 9% | 61% | 58% | 51% | $ 122,143,555.44 |
| CLA | Celsius Resource Ltd | 0.011 | -8% | -21% | 57% | 10% | 0% | $ 34,490,372.97 |
| QML | Qmines Limited | 0.055 | 2% | -8% | 38% | -15% | 2% | $ 29,865,890.65 |
| RDN | Raiden Resources Ltd | 0.006 | -14% | 50% | 20% | -83% | -45% | $ 24,156,240.09 |
| TCG | Turaco Gold Limited | 0.43 | -5% | -3% | -4% | 37% | 69% | $ 431,307,399.47 |
| KCC | Kincora Copper | 1.2 | 9% | 15% | 264% | 186% | 344% | $ 25,573,517.69 |
| GBZ | GBM Rsources Ltd | 0.04 | 3% | -27% | 400% | 400% | 400% | $ 180,092,397.04 |
| DTM | Dart Mining NL | 0.042 | -22% | -44% | -30% | -72% | -69% | $ 8,493,161.45 |
| MKR | Manuka Resources. | 0.053 | 10% | -20% | 59% | 36% | 94% | $ 55,341,294.00 |
| AUC | Ausgold Limited | 0.78 | 3% | -21% | 39% | 53% | 86% | $ 351,116,234.73 |
| ANX | Anax Metals Ltd | 0.009 | 0% | -10% | 0% | -18% | -25% | $ 7,945,268.10 |
| EMU | EMU NL | 0.043 | -4% | 87% | 119% | 70% | 70% | $ 10,628,118.48 |
| SFM | Santa Fe Minerals | 0.265 | 13% | 13% | 616% | 783% | 755% | $ 25,384,227.53 |
| PNR | Pantoro Gold Limited | 4.87 | -2% | -24% | 56% | 160% | 218% | $ 1,911,777,398.95 |
| CMM | Capricorn Metals | 13.07 | 5% | -5% | 37% | 113% | 108% | $ 5,714,602,301.12 |
| VRL | Verity Resources | 0.018 | 0% | -25% | 13% | -38% | -8% | $ 5,950,107.70 |
| HAW | Hawthorn Resources | 0.084 | 12% | 29% | 65% | 42% | 105% | $ 29,481,373.94 |
| BGD | Bartongoldholdings | 1.08 | -4% | -15% | 112% | 286% | 341% | $ 268,896,845.30 |
| SVY | Stavely Minerals Ltd | 0.017 | 13% | -26% | 31% | -45% | 0% | $ 11,641,368.49 |
| AGC | AGC Ltd | 0.19 | 6% | 3% | 31% | -24% | 23% | $ 49,845,972.18 |
| RGL | Riversgold | 0.007 | 0% | -22% | 75% | 133% | 75% | $ 14,585,988.15 |
| TSO | Tesoro Gold Ltd | 0.054 | -4% | -22% | 100% | 93% | 170% | $ 143,546,655.49 |
| GUE | Global Uranium | 0.06 | -6% | -13% | -15% | -19% | 0% | $ 27,334,138.74 |
| CPM | Coopermetalslimited | 0.059 | -5% | -13% | 51% | 28% | 28% | $ 4,662,161.18 |
| MM8 | Medallion Metals. | 0.39 | -6% | -31% | 66% | 364% | 225% | $ 251,498,102.05 |
| FFM | Firefly Metals Ltd | 1.615 | -8% | 25% | 102% | 24% | 75% | $ 1,221,947,853.28 |
| CBY | Canterbury Resources | 0.023 | 5% | -15% | 15% | -21% | 5% | $ 6,202,482.77 |
| SLA | Solara Minerals | 0.185 | -3% | 3% | 54% | -24% | 106% | $ 10,958,442.26 |
| SFR | Sandfire Resources | 15.74 | -4% | 1% | 53% | 50% | 70% | $ 7,289,654,516.48 |
| TAM | Tanami Gold NL | 0.069 | 5% | 5% | 97% | 138% | 130% | $ 77,556,405.04 |
| NWM | Norwest Minerals | 0.014 | 0% | 8% | 0% | -9% | 17% | $ 13,391,390.36 |
| ALK | Alkane Resources Ltd | 1.01 | 3% | -14% | 24% | 92% | 98% | $ 1,427,255,740.52 |
| BMO | Bastion Minerals | 0.0015 | 0% | 0% | -36% | -68% | -52% | $ 2,236,449.88 |
| IDA | Indiana Resources | 0.044 | 5% | -12% | 33% | 75% | 72% | $ 27,680,495.69 |
| GSM | Golden State Mining | 0.014 | -13% | -18% | 100% | 27% | 75% | $ 5,469,930.08 |
| NSM | Northstaw | 0.038 | -3% | 19% | -11% | 175% | 140% | $ 13,152,198.12 |
| GSN | Great Southern | 0.031 | 3% | 3% | 41% | 107% | 107% | $ 29,904,128.70 |
| VAU | Vault Minerals Ltd | 0.715 | 4% | 0% | 55% | 91% | 117% | $ 4,853,501,486.41 |
| CDR | Codrus Minerals Ltd | 0.022 | 5% | -37% | -31% | 5% | 29% | $ 4,548,156.34 |
| MDI | Middle Island Res | 0.032 | -6% | -20% | 68% | 78% | 167% | $ 30,751,503.10 |
| WTM | Waratah Minerals Ltd | 0.7 | 8% | -12% | 133% | 133% | 352% | $ 211,843,910.36 |
| POL | Polymetals Resources | 0.88 | -29% | -30% | -1% | 19% | 11% | $ 249,066,719.61 |
| RDS | Redstone Resources | 0.003 | 0% | -25% | -50% | 0% | 20% | $ 3,689,944.93 |
| NAG | Nagambie Resources | 0.012 | -20% | -29% | -45% | -27% | -33% | $ 12,553,646.00 |
| BGL | Bellevue Gold Ltd | 1.17 | 2% | -5% | 21% | -22% | 4% | $ 1,717,668,739.08 |
| GBR | Greatbould Resources | 0.073 | 4% | -17% | 3% | 66% | 70% | $ 71,804,399.36 |
| KAI | Kairos Minerals Ltd | 0.034 | -6% | -15% | 62% | 89% | 183% | $ 107,756,487.52 |
| KAU | Kaiser Reef | 0.26 | 0% | -12% | 41% | 41% | 63% | $ 154,410,758.06 |
| HRZ | Horizon | 0.05 | -4% | -39% | -11% | 11% | 25% | $ 152,208,828.90 |
| CDT | Castle Minerals | 0.057 | -5% | -21% | 4% | -37% | -5% | $ 9,823,545.47 |
| RSG | Resolute Mining | 0.8725 | -9% | -21% | 56% | 17% | 121% | $ 1,810,241,611.05 |
| EVN | Evolution Mining Ltd | 10.69 | 2% | -5% | 25% | 109% | 122% | $ 21,787,540,868.30 |
| CXU | Cauldron Energy Ltd | 0.017 | -15% | -15% | 149% | 25% | 45% | $ 30,418,143.33 |
| ALY | Alchemy Resource Ltd | 0.008 | -16% | -20% | 60% | 14% | 14% | $ 9,504,610.05 |
| NH3 | Nh3Cleanenergyltd | 0.094 | -3% | 16% | 248% | 309% | 422% | $ 66,561,014.62 |
| OBM | Ora Banda Mining Ltd | 1.14 | -2% | -10% | 7% | 32% | 75% | $ 2,275,332,035.08 |
| AVW | Avira Resources Ltd | 0.013 | -7% | -7% | 86% | -35% | -35% | $ 3,438,500.00 |
| LCY | Legacy Iron Ore | 0.008 | -6% | 0% | 0% | -36% | -20% | $ 78,096,340.67 |
| PDI | Predictive Disc Ltd | 0.535 | -3% | 11% | 47% | 98% | 133% | $ 1,417,321,607.76 |
| MAT | Matsa Resources | 0.094 | -6% | -15% | 45% | 124% | 169% | $ 88,771,366.52 |
| ZAG | Zuleika Gold Ltd | 0.031 | -11% | 24% | 158% | 94% | 138% | $ 23,153,277.74 |
| GML | Gateway Mining | 0.079 | -10% | 8% | 163% | 182% | 276% | $ 187,973,545.67 |
| SBM | St Barbara Limited | 0.495 | -5% | -16% | 57% | 41% | 120% | $ 598,848,951.20 |
| SBR | Sabre Resources | 0.012 | 9% | -8% | 33% | 0% | 20% | $ 5,128,005.13 |
| STK | Strickland Metals | 0.17 | -11% | 21% | 102% | 172% | 124% | $ 373,289,366.51 |
| CEL | Challenger Gold Ltd | 0.115 | -15% | -28% | 42% | 109% | 145% | $ 302,389,950.88 |
| GG8 | Gorilla Gold Mines | 0.395 | -1% | -10% | -20% | 72% | 52% | $ 282,935,673.54 |
| NST | Northern Star | 24.4 | 3% | -1% | 22% | 39% | 58% | $ 35,010,093,084.64 |
| OZM | Ozaurum Resources | 0.063 | -6% | -13% | -29% | 75% | 110% | $ 14,433,418.00 |
| TG1 | Techgen Metals Ltd | 0.028 | -7% | -22% | 47% | 1% | -16% | $ 9,432,676.45 |
| AQI | Alicanto Min Ltd | 0.04 | 0% | -18% | 33% | 18% | 8% | $ 38,814,004.99 |
| KTA | Krakatoa Resources | 0.012 | -14% | 0% | 20% | 20% | 26% | $ 12,585,742.33 |
| ARN | Aldoro Resources | 0.43 | -4% | -7% | 25% | 400% | 13% | $ 99,535,822.32 |
| WGX | Westgold Resources. | 5.48 | 9% | -2% | 96% | 77% | 94% | $ 5,243,815,180.20 |
| MBK | Metal Bank Ltd | 0.0165 | 3% | -3% | 57% | -14% | 15% | $ 8,456,802.97 |
| A8G | Australasian Metals | 0.089 | -15% | -15% | 14% | 11% | 13% | $ 5,152,185.53 |
| TAR | Taruga Minerals | 0.01 | 0% | -17% | 0% | -23% | 0% | $ 7,137,540.58 |
| DTR | Dateline Resources | 0.255 | -7% | -60% | 589% | 6275% | 7186% | $ 882,265,216.22 |
| S2R | S2 Resources | 0.08 | -9% | -26% | -16% | 8% | 19% | $ 43,559,485.60 |
| NES | Nelson Resources. | 0.006 | -25% | -40% | 100% | 200% | 100% | $ 13,179,565.97 |
| TLM | Talisman Mining | 0.115 | -4% | -18% | -28% | -50% | -44% | $ 20,715,238.39 |
| BEZ | Besragoldinc | 0.048 | -20% | -28% | 26% | -41% | -47% | $ 20,775,198.85 |
| PRU | Perseus Mining Ltd | 4.85 | 3% | -2% | 36% | 77% | 89% | $ 6,458,880,924.82 |
| SPQ | Superior Resources | 0.01 | 11% | 25% | 150% | 43% | 67% | $ 23,739,827.25 |
| PUR | Pursuit Minerals | 0.065 | 2% | -45% | 67% | -57% | -32% | $ 10,082,641.73 |
| RMS | Ramelius Resources | 3.42 | 4% | -16% | 22% | 52% | 65% | $ 6,505,443,422.14 |
| PKO | Peako Limited | 0.003 | 0% | -14% | 20% | 0% | 0% | $ 5,207,096.86 |
| RKB | Rokeby Resources Ltd | 0.005 | 0% | -17% | 0% | 0% | 0% | $ 9,132,805.76 |
| A1G | African Gold Ltd. | 0.29 | -5% | -28% | 132% | 272% | 427% | $ 159,968,391.60 |
| NMG | New Murchison Gold | 0.033 | 6% | -6% | 106% | 200% | 267% | $ 367,616,214.23 |
| GNM | Great Northern | 0.058 | -9% | -38% | 346% | 346% | 314% | $ 28,911,129.30 |
| KRM | Kingsrose Mining Ltd | 0.045 | 10% | -10% | 36% | 15% | 29% | $ 33,908,693.36 |
| BTR | Brightstar Resources | 0.435 | 0% | -23% | -23% | -30% | -13% | $ 254,896,140.84 |
| RRL | Regis Resources | 6.46 | 5% | 8% | 39% | 148% | 153% | $ 4,967,574,425.44 |
| M24 | Mamba Exploration | 0.016 | -16% | -27% | 33% | 23% | 33% | $ 5,017,815.37 |
| TRM | Truscott Mining Corp | 0.08 | 0% | 11% | 33% | 4% | 3% | $ 15,655,084.80 |
| TNC | True North Copper | 0.31 | 11% | -9% | 91% | -90% | -90% | $ 40,762,492.16 |
| KNB | Koonenberrygold | 0.04 | -9% | -18% | -53% | 135% | 233% | $ 43,153,320.55 |
| AWJ | Auric Mining | 0.275 | -4% | 6% | 20% | -19% | -19% | $ 50,484,897.54 |
| ENR | Encounter Resources | 0.425 | -12% | -28% | 136% | 16% | 31% | $ 249,690,043.35 |
| SNG | Siren Gold | 0.105 | -9% | -9% | 94% | 36% | 62% | $ 31,489,353.95 |
| STN | Saturn Metals | 0.49 | 11% | -20% | 69% | 75% | 139% | $ 263,446,750.21 |
| USL | Unico Silver Limited | 0.565 | 13% | -16% | 146% | 109% | 190% | $ 275,157,724.11 |
| AYM | Australia United Min | 0.004 | 0% | 33% | 100% | 33% | 0% | $ 7,370,309.94 |
| HAV | Havilah Resources | 0.27 | 8% | -5% | 64% | 38% | 20% | $ 96,351,037.20 |
| PNT | Panthermetalsltd | 0.009 | -14% | -5% | -37% | -59% | -14% | $ 2,756,515.93 |
| MEK | Meeka Metals Limited | 0.21 | 5% | 0% | 50% | 204% | 173% | $ 628,690,674.05 |
| GMD | Genesis Minerals | 5.895 | 5% | -5% | 44% | 164% | 139% | $ 6,714,269,893.80 |
| PGO | Pacgold | 0.063 | 2% | -30% | -21% | -29% | -16% | $ 18,380,790.35 |
| FEG | Far East Gold | 0.155 | 15% | 15% | 7% | -14% | -14% | $ 55,054,117.95 |
| MI6 | Minerals260Limited | 0.3025 | 10% | 16% | 133% | 133% | 133% | $ 640,873,333.23 |
| GAL | Galileo Mining Ltd | 0.21 | -11% | -5% | 75% | 56% | 68% | $ 41,501,234.67 |
| RXL | Rox Resources | 0.405 | -6% | -26% | 31% | 125% | 103% | $ 312,379,639.13 |
| PTN | Patronus Resources | 0.0685 | -4% | -30% | 10% | 5% | 40% | $ 105,028,299.29 |
| CLZ | Classic Min Ltd | 0.001 | 0% | 0% | 0% | 0% | 0% | $ 4,265,855.46 |
| TGM | Theta Gold Mines Ltd | 0.165 | 3% | -37% | 18% | -11% | -8% | $ 167,356,955.84 |
| FAL | Falconmetalsltd | 0.62 | -7% | -25% | 464% | 276% | 439% | $ 127,587,016.20 |
| SPD | Southernpalladium | 0.96 | -8% | -16% | 292% | 24% | 60% | $ 112,414,503.96 |
| TMB | Tambourahmetals | 0.091 | -2% | -30% | 279% | 203% | 333% | $ 22,849,206.85 |
| TMS | Tennant Minerals Ltd | 0.007 | -7% | 0% | 40% | -50% | -22% | $ 8,527,123.32 |
| AZY | Antipa Minerals Ltd | 0.54 | 1% | -20% | 5% | 135% | 108% | $ 355,798,511.28 |
| PXX | Polarx Limited | 0.02 | -13% | -9% | 122% | 150% | 208% | $ 54,335,675.14 |
| TRE | Toubani Res Ltd | 0.3075 | -20% | -24% | 18% | 10% | 81% | $ 164,321,232.71 |
| AUN | Aurumin | 0.1 | -9% | -26% | 37% | 61% | 52% | $ 50,993,067.00 |
| GPR | Geopacific Resources | 0.034 | -8% | -13% | 55% | 3% | 70% | $ 127,915,813.16 |
| FXG | Felix Gold Limited | 0.435 | -11% | -29% | 164% | 437% | 418% | $ 198,544,976.55 |
| ILT | Iltani Resources Lim | 0.39 | -20% | -18% | 50% | 117% | 90% | $ 28,776,432.83 |
| BRX | Belararoxlimited | 0.089 | 1% | -6% | 14% | -61% | -49% | $ 18,089,907.93 |
| TM1 | Terra Metals Limited | 0.135 | -27% | -27% | 463% | 229% | 382% | $ 114,750,064.77 |
| TOR | Torque Met | 0.23 | -8% | -23% | 145% | 254% | 334% | $ 129,881,112.24 |
| ARD | Argent Minerals | 0.025 | 0% | -32% | 14% | -11% | 47% | $ 40,257,073.10 |
| LNQ | Linqmineralslimited | 0.23 | 31% | -4% | 0% | 0% | 0% | $ 11,133,000.18 |
| LM1 | Leeuwin Metals Ltd | 0.2 | -5% | -26% | 11% | 174% | 43% | $ 23,842,574.84 |
| SS1 | Sun Silver Limited | 0.99 | 6% | -14% | 48% | 24% | 58% | $ 119,264,329.80 |
| SX2 | Southgold Consol | 7.98 | -10% | -7% | 53% | 0% | 0% | $ 1,126,993,566.72 |
| AA2 | Ariana Resources PLC | 0.275 | -8% | -14% | 0% | 0% | 0% | $ 9,293,917.33 |
| M2M | Mtmalcolmminesnl | 0.015 | -6% | -33% | -38% | -55% | -36% | $ 4,660,201.64 |
| BM1 | Ballardmininglimited | 0.57 | 10% | -13% | 0% | 0% | 0% | $ 124,141,456.88 |
| UVA | Uvrelimited | 0.2 | -2% | 11% | 113% | 150% | 125% | $ 39,828,285.21 |
| VTX | Vertexmin | 0.21 | -12% | -42% | -18% | -16% | 1% | $ 61,601,214.99 |
| JAVDH | Deferred Settlement | 0.077 | -17% | -38% | -17% | -29% | -17% | $ 14,924,665.88 |
| SNM | Sentinel Metals | 0.3 | -3% | 0% | 0% | 0% | 0% | $ 17,132,324.58 |
| GGR | Goldengloberesources | 0.16 | -20% | 0% | 0% | 0% | 0% | $ 15,649,959.50 |
| RRE | Right Resources | 0.18 | 0% | 0% | 0% | 0% | 0% | $ 16,360,908.83 |
| GDR | Goldendragonmining | 0.2 | -9% | 0% | 0% | 0% | 0% | $ 6,564,999.80 |
| PC2 | Pc Gold Ltd | 0.225 | 2% | 0% | 0% | 0% | 0% | $ 35,924,012.78 |
| OMX | Orangeminerals | 0.083 | 5% | 0% | 80% | 144% | 186% | $ 11,870,992.56 |
Gold medal performers
Who were some of the top precious metals names this week?
LinQ Minerals ran hot on Friday with nary a peep of an ASX announcement, a touch over a week after the announcement that it had begun phase 1 drilling at the Dam gold and copper deposit in New South Wales.
The 1300m program is targeting part of the Southern Zone resource for the first time since 2012.
Between the Dam and Gidginbung deposits, LinQ boasts 120Mt of ore at 1.7Moz gold and 200,000t copper, part of a broader 3.7Moz gold and 1.2Mt copper across the Gilmore project in central NSW.
The Dam is a porphyry style deposit discovered by Paragon Gold in 1990 which clocks in at 76.8Mt at 0.5% copper equivalent for 700,000oz gold and 180,000t copper, down to 300m.
“We are excited to begin drilling at the Dam, one of the key porphyry gold copper deposits in our highly prospective 40km belt of mineralised targets,” LinQ exec chair Clive Donner said last week.
“The commencement of drilling is an important step in unlocking the broader scale of this system, particularly at depth and along strike.”
A second drill program is expected to take place at Gidginbung after the rig finishes up at the Dam.
Previous hits there from LinQ’s Phase 1 drilling included:
- 21m at 2.63g/t Au & 0.07% Cu from 149m, including 3m at 9.07g/t Au & 0.31% Cu (GBRCD010);
- 31m at 2.31g/t Au & 0.12% Cu from 176m, including 5m at 11.97g/t Au & 0.57% Cu (GBRCD010); and
- 20m at 1.77g/t Au & 0.53% Cu within a broader intercept of 52m at 0.84g/t Au & 0.24% Cu from 102m (GBRC008).
Alice Queen has appointed GBA Capital as a strategic advisor to look into development and financing options for its Horn Island gold project in Queensland, where mining is on the agenda after a rapid run up in gold prices.
A 2021 scoping study delivered a $140m NPV at a gold price of just $2450/oz, based off a mine producing 37,000ozpa over 8.5 years at all in sustaining costs of $75m.
That was long before prices climbed above $6000/oz Aussie, prompting the rethink on the development of the low-grade but substantial deposit, which hosts estimated mineral resources of 16.7Mt at 0.98g/t Au for 524,000oz at a 0.4g/t cut-off grade. An updated study is in the works.
“The Horn Island Gold Project is a compelling opportunity for Alice Queen shareholders, particularly in light of the recent increase in the gold price, together with the potentially substantial positive impact on the underlying value of the project,” AQX MD Andrew Buxton said this week.
“As a result, Alice Queen will commence an update to the 2021 scoping study to capture the latest gold price and overall key physical and economic assumptions.
“As we focus our efforts on generating an updated scoping study, and target a subsequent PFS/DFS, Alice Queen and the GBA team will work in parallel to consider a range of potential project financing structures with a view to identifying the most practical and value accretive capital structure/opportunities for the company.”
Related Topics

Related Stories


UNLOCK INSIGHTS
Discover the untold stories of emerging ASX stocks.
Daily news and expert analysis, it's free to subscribe.
By proceeding, you confirm you understand that we handle personal information in accordance with our Privacy Policy.


