Gold Digger: Stagflation to push gold through $US2,200 later this year, expert says

Pic: DamianKuzdak, Getty Images.
- Gold price to hit $US2,200 as stagflation fears take hold
- U.S. and allies officially prohibit all transactions with Russia involving gold, one of its financial lifelines. Will it work?
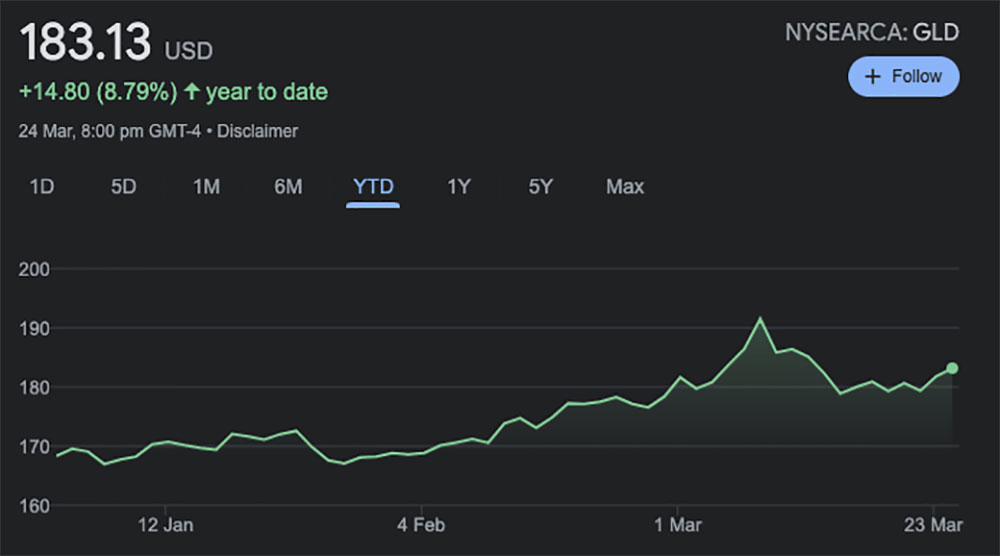
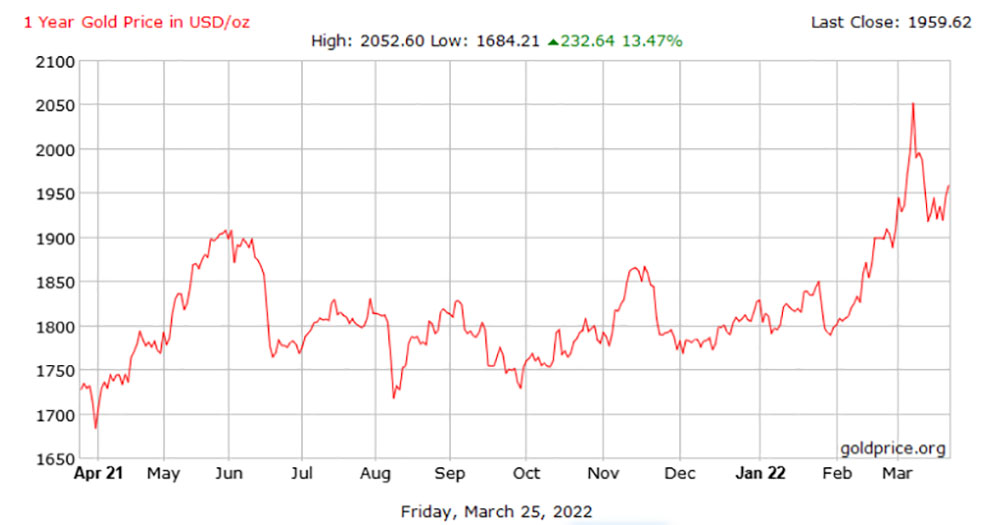
- Gold price rebounds over past week to $US1,960/oz
Our Gold Digger column wraps all the news driving ASX stocks with exposure to precious metals.
‘Stagflation’ is the unpleasant combo of high inflation, slower economic growth, and steady/ increasing unemployment.
For Central Banks, it’s a pain in the backside. But for gold, it’s a good thing.
The precious metal has historically outperformed during periods of high inflation/ slowing economic growth, of the type we are seeing right now.
Singapore’s United Overseas Bank (UOB) says price should reach $US2,200/oz in Q4 this year.
“This mounting stagflation fear, coupled with strong safe haven in-flows, have now taken over as the dominant drivers for gold price, muting the negative impact from the anticipated rate hikes from the U.S. Federal Reserve,” UOB head of markets strategy Heng Koon How says.
There are renewed in-flows to gold ETFs, he says.
There will also be more demand from central banks, Heng says.
“Various central banks, particularly in the Emerging Market space, continue to diversify their reserve holdings into gold,” Heng said.
“It is likely that this onset renewed geopolitical risk due to the Russia-Ukraine conflict will reinforce this diversification trend.”
And while we are on the topic of Central Banks …
Can the West throttle Russia’s golden lifeline? Probably not
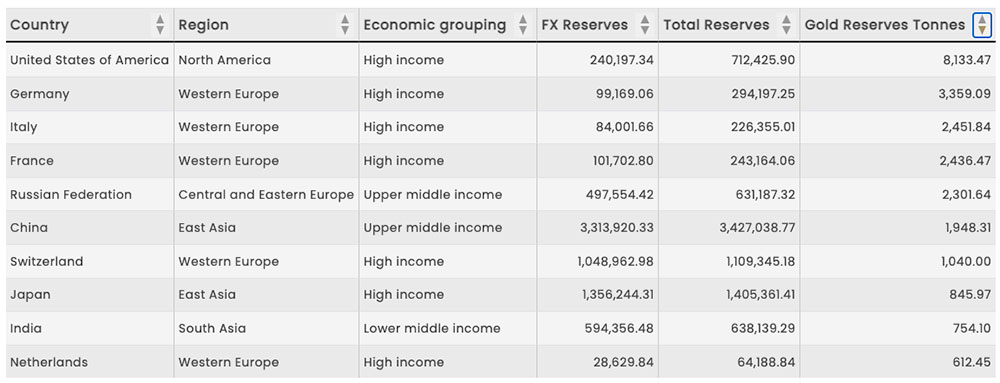
Since the 2014 invasion of Crimea, the Russian government has increased its gold stockpile as a hedge against further financial sanctions.
Now the country has the world’s fifth biggest hoard of the precious metal, worth up to $US100 billion — $US140 billion.
It keeps getting larger. In February, the Bank of Russia announced that it would resume gold purchases on the domestic market after a bunch of its financial institutions were removed from the SWIFT bank messaging system.
Yesterday, The U.S. and its allies officially prohibited all transactions with Russia involving gold, one of its financial lifelines.
But will it work?
Domestic gold reserves are physical assets held inside vaults which, bar a full-scale invasion of Russia, can never be seized by foreign powers.
But it is also hard to move, so Russia would need to rely on its ever-decreasing list of allies – like India and China — to liquidate its stash.
Unfortunately, India and China are two of the biggest gold traders in the world.
They could help out Russia in the same sort of way Russia assisted the heavily sanctioned Maduro regime in Venezuela – by physically moving tonnes of gold bars into unregulated markets around the world.
‘I remain sceptical about the gold rally’: OANDA analyst Jeffrey Halley
This week the gold bugs were back.
“The reasoning behind the rally is as tenuous as the equity rallies. Suddenly, gold has become an inflation hedge once again, and a hedge against higher US yields, go figure that one out,” Halley says.
“I believe haven buying into the end of the week, and fast-money buying the break of $1950.00 are more likely.
“As such, I remain sceptical about the gold rally. Its longer-term price action will turn constructive only if US yields cap out and US Dollar weakness returns, or if President Putin starts using weapons he shouldn’t in Ukraine.
“Gold has shown more than once recently that prices climb slowly up the stairs, and then jump out of the 10th floor window, and I believe those risks remain.”
Gold has nearby resistance at $1965.00 and $1975.00 an ounce, followed by $2000.00 where Halley expects option-related sellers to be lying in wait once again.
Support lies nearby at $1950.00 and $1938.00 an ounce, he says.
Winners & Losers
Here’s how ASX-listed gold & silver stocks are performing:
Scroll or swipe to reveal table. Click headings to sort. Best viewed on a laptop
| CODE | COMPANY | % Week | % Month | % Six Month | % Year | PRICE | MARKET CAP |
|---|---|---|---|---|---|---|---|
| ANL | Amani Gold | 150% | 67% | 150% | 150% | 0.0025 | $45,866,882.25 |
| ARL | Ardea Resources | 67% | 133% | 268% | 240% | 1.62 | $280,585,012.66 |
| RGL | Riversgold | 67% | 173% | 114% | 25% | 0.06 | $28,808,084.55 |
| CLA | Celsius Resource | 58% | 30% | 11% | -23% | 0.03 | $34,201,041.50 |
| ICG | Inca Minerals | 58% | 60% | 7% | 55% | 0.15 | $67,369,630.72 |
| BNR | Bulletin Res | 50% | 75% | 200% | 215% | 0.21 | $60,807,581.10 |
| VRC | Volt Resources | 42% | 13% | -48% | 0% | 0.017 | $45,818,456.29 |
| AUC | Ausgold Limited | 36% | 39% | 64% | 19% | 0.064 | $115,242,720.18 |
| FAU | First Au | 33% | 20% | -20% | -29% | 0.012 | $8,623,020.44 |
| GTR | Gti Resources | 32% | 71% | -15% | 30% | 0.029 | $36,120,999.30 |
| RDT | Red Dirt Metals | 31% | 29% | 118% | 265% | 0.675 | $188,490,939.84 |
| KZR | Kalamazoo Resources | 29% | 21% | 9% | -11% | 0.375 | $55,899,833.99 |
| MLS | Metals Australia | 26% | 127% | 133% | 86% | 0.093 | $31,487,744.27 |
| MEG | Megado | 25% | 24% | 3% | -42% | 0.099 | $4,046,587.01 |
| XTC | Xantippe Res | 23% | -20% | 300% | 300% | 0.008 | $51,445,984.29 |
| RDS | Redstone Resources | 22% | 22% | -8% | 0% | 0.011 | $8,105,156.36 |
| MRR | Minrex Resources | 22% | 37% | 319% | 191% | 0.067 | $53,836,627.26 |
| KAI | Kairos Minerals | 21% | 26% | -3% | -3% | 0.029 | $52,976,524.26 |
| PNX | PNX Metals Limited | 20% | 20% | -11% | -22% | 0.006 | $26,664,346.84 |
| RDN | Raiden Resources | 20% | -25% | -50% | -48% | 0.012 | $16,503,927.65 |
| SBR | Sabre Resources | 20% | 33% | 20% | 20% | 0.006 | $12,208,881.89 |
| GNM | Great Northern | 20% | 0% | -25% | -45% | 0.006 | $9,399,780.37 |
| AYM | Australia United Min | 20% | 0% | -33% | -40% | 0.006 | $11,055,464.91 |
| IPT | Impact Minerals | 18% | 8% | -13% | -46% | 0.013 | $26,285,539.03 |
| NVA | Nova Minerals | 17% | -23% | -51% | -54% | 0.715 | $134,250,702.33 |
| E2M | E2 Metals | 17% | 17% | -14% | -20% | 0.24 | $43,282,973.50 |
| PUA | Peak Minerals | 17% | 40% | -2% | -37% | 0.014 | $15,620,561.27 |
| MBK | Metal Bank | 17% | 17% | -19% | -27% | 0.007 | $16,950,818.04 |
| AL8 | Alderan Resource | 16% | 0% | -53% | -69% | 0.022 | $9,788,019.84 |
| CDT | Castle Minerals | 16% | 28% | 354% | 321% | 0.059 | $61,968,565.01 |
| SKY | SKY Metals | 15% | 2% | -1% | -42% | 0.09 | $33,156,945.36 |
| AAJ | Aruma Resources | 15% | 20% | -1% | 38% | 0.098 | $15,696,150.30 |
| BMR | Ballymore Resources | 15% | 19% | -14% | 0% | 0.19 | $14,695,616.20 |
| CYL | Catalyst Metals | 15% | 5% | 8% | 1% | 1.99 | $195,926,888.77 |
| AZL | Arizona Lithium | 15% | 41% | 288% | 288% | 0.155 | $325,752,890.08 |
| TMX | Terrain Minerals | 14% | 14% | -11% | -27% | 0.008 | $5,886,088.07 |
| ZNC | Zenith Minerals | 14% | 13% | 76% | 200% | 0.36 | $120,366,454.25 |
| NXM | Nexus Minerals | 14% | 42% | 36% | 379% | 0.455 | $128,905,611.30 |
| LCL | Los Cerros Limited | 14% | 14% | -4% | -14% | 0.125 | $79,833,294.38 |
| MDI | Middle Island Res | 14% | 0% | 32% | -55% | 0.125 | $14,690,186.64 |
| CHZ | Chesser Resources | 14% | 25% | -14% | -24% | 0.125 | $54,036,776.61 |
| BNZ | Benzmining | 13% | 23% | -3% | -10% | 0.68 | $34,899,382.96 |
| PAK | Pacific American Hld | 13% | 13% | 6% | -21% | 0.017 | $8,123,915.83 |
| GRL | Godolphin Resources | 13% | 36% | 13% | -8% | 0.17 | $13,037,262.51 |
| MEK | Meeka Gold Limited | 13% | 4% | 16% | 13% | 0.052 | $47,860,033.78 |
| NAE | New Age Exploration | 13% | -4% | -4% | 0% | 0.0135 | $17,230,786.92 |
| PKO | Peako Limited | 13% | 6% | -36% | -28% | 0.018 | $4,935,265.62 |
| LRL | Labyrinth Resources | 12% | 7% | 12% | 59% | 0.046 | $37,554,770.47 |
| FFX | Firefinch | 12% | 52% | 51% | 333% | 0.93 | $1,054,431,899.00 |
| GSM | Golden State Mining | 12% | 11% | -35% | -40% | 0.084 | $6,896,302.76 |
| OBM | Ora Banda Mining | 12% | 8% | -37% | -76% | 0.056 | $70,073,352.45 |
| RML | Resolution Minerals | 12% | 6% | -5% | -24% | 0.019 | $12,508,965.38 |
| GED | Golden Deeps | 11% | 0% | -9% | 0% | 0.01 | $7,758,514.40 |
| GCY | Gascoyne Res | 11% | 25% | 9% | -35% | 0.355 | $131,488,670.81 |
| GCY | Gascoyne Res | 11% | 25% | 9% | -35% | 0.355 | $131,488,670.81 |
| AM7 | Arcadia Minerals | 11% | 24% | 34% | 0% | 0.255 | $8,748,125.00 |
| PNT | Panthermetals | 11% | 11% | 0% | 0% | 0.26 | $7,560,000.00 |
| ADT | Adriatic Metals | 10% | 13% | -18% | 16% | 2.43 | $509,097,281.88 |
| GUL | Gullewa Limited | 10% | 4% | -12% | 0% | 0.075 | $14,277,982.50 |
| CAI | Calidus Resources | 10% | 31% | 73% | 122% | 0.975 | $394,251,067.84 |
| WRM | White Rock Min | 10% | 5% | -24% | -62% | 0.22 | $33,903,380.32 |
| MAT | Matsa Resources | 10% | 5% | 12% | -19% | 0.066 | $22,973,095.68 |
| KAU | Kaiser Reef | 10% | 10% | 7% | -33% | 0.225 | $29,130,910.65 |
| ARV | Artemis Resources | 10% | -9% | -20% | -12% | 0.069 | $95,794,837.90 |
| NES | Nelson Resources. | 10% | 10% | -45% | -82% | 0.023 | $6,768,719.77 |
| BGL | Bellevue Gold | 9% | 8% | 20% | 11% | 0.99 | $1,010,747,604.86 |
| VKA | Viking Mines | 9% | 0% | -25% | -71% | 0.012 | $12,303,101.17 |
| BRV | Big River Gold | 9% | 20% | 5% | -25% | 0.305 | $67,164,557.83 |
| BCN | Beacon Minerals | 9% | 0% | 19% | 3% | 0.037 | $132,957,834.70 |
| TLM | Talisman Mining | 9% | 9% | 28% | 76% | 0.185 | $33,793,109.46 |
| SNG | Siren Gold | 9% | 31% | 29% | -16% | 0.315 | $27,020,775.36 |
| LNY | Laneway Res | 8% | 13% | 36% | 13% | 0.0065 | $33,614,711.54 |
| GBZ | GBM Rsources | 8% | 13% | 8% | 33% | 0.13 | $63,854,249.25 |
| AVW | Avira Resources | 8% | 30% | 8% | 8% | 0.0065 | $12,712,740.00 |
| BRB | Breaker Res NL | 8% | 11% | -7% | 21% | 0.26 | $79,831,027.61 |
| MML | Medusa Mining | 8% | 15% | 26% | 15% | 0.935 | $209,719,796.92 |
| KRM | Kingsrose Mining | 8% | 15% | 67% | 78% | 0.082 | $59,962,121.52 |
| A8G | Australasian Metals | 8% | 2% | 20% | 0% | 0.48 | $18,076,722.30 |
| ADV | Ardiden | 8% | 27% | 17% | -26% | 0.014 | $37,248,992.98 |
| DTM | Dart Mining NL | 8% | -14% | -18% | -48% | 0.086 | $10,706,219.98 |
| BBX | BBX Minerals | 7% | 20% | -29% | -45% | 0.15 | $71,303,328.63 |
| BC8 | Black Cat Syndicate | 7% | 5% | 12% | -10% | 0.6 | $81,813,530.38 |
| SFR | Sandfire Resources | 7% | -20% | -2% | 9% | 5.68 | $2,308,198,057.59 |
| KTA | Krakatoa Resources | 7% | 12% | -41% | -24% | 0.047 | $14,146,076.02 |
| KCN | Kingsgate Consolid. | 7% | 19% | 37% | 75% | 1.495 | $317,594,850.06 |
| KSN | Kingston Resources | 7% | -3% | -18% | -24% | 0.16 | $66,043,110.24 |
| EMR | Emerald Res NL | 7% | 1% | 29% | 40% | 1.13 | $591,908,522.70 |
| DTR | Dateline Resources | 7% | 21% | 11% | -3% | 0.097 | $40,727,653.22 |
| AQI | Alicanto Min | 6% | 5% | -9% | -19% | 0.105 | $37,888,648.08 |
| AMI | Aurelia Metals | 6% | 10% | 50% | 32% | 0.4875 | $612,342,946.22 |
| CTO | Citigold Corp | 6% | 0% | -18% | -31% | 0.009 | $25,502,931.82 |
| RMX | Red Mount Min | 6% | 0% | 0% | -18% | 0.009 | $13,960,092.79 |
| BAT | Battery Minerals | 6% | 6% | -32% | -63% | 0.0095 | $22,300,913.42 |
| OGC | OceanaGold Corp. | 6% | 19% | 26% | 51% | 3.06 | $215,851,475.89 |
| TAM | Tanami Gold NL | 5% | -6% | -19% | -28% | 0.058 | $69,330,725.71 |
| REZ | Resourc & En Grp | 5% | -7% | -5% | -11% | 0.041 | $19,492,425.77 |
| CAZ | Cazaly Resources | 5% | 0% | -2% | 0% | 0.042 | $16,130,748.00 |
| WAF | West African Res | 5% | 19% | 42% | 52% | 1.31 | $1,357,854,170.05 |
| RED | Red 5 Limited | 5% | 16% | 87% | 139% | 0.3825 | $860,071,637.98 |
| HMX | Hammer Metals | 5% | 64% | 62% | 20% | 0.11 | $85,574,435.42 |
| MTH | Mithril Resources | 4% | 9% | -14% | -37% | 0.012 | $30,962,796.49 |
| PGD | Peregrine Gold | 4% | -4% | 37% | 0% | 0.48 | $18,951,901.16 |
| SLR | Silver Lake Resource | 4% | 15% | 67% | 34% | 2.17 | $2,018,466,623.67 |
| ALK | Alkane Resources | 4% | 13% | 36% | 57% | 1.1 | $655,141,762.00 |
| KNB | Koonenberrygold | 4% | -18% | 0% | 0% | 0.099 | $7,379,935.40 |
| GOR | Gold Road Res | 4% | 10% | 38% | 37% | 1.6875 | $1,464,736,102.36 |
| BGD | Bartongoldholdings | 4% | 4% | 44% | 0% | 0.26 | $22,747,598.94 |
| HXG | Hexagon Energy | 4% | 16% | -33% | -48% | 0.052 | $22,767,380.88 |
| MTC | Metalstech | 4% | 23% | -41% | 114% | 0.265 | $44,999,439.30 |
| NAG | Nagambie Resources | 4% | 10% | -33% | -10% | 0.054 | $27,709,892.53 |
| MZZ | Matador Mining | 4% | -7% | -23% | -8% | 0.275 | $59,680,363.88 |
| CHN | Chalice Mining | 4% | 6% | 10% | 63% | 7.33 | $2,591,671,360.20 |
| LYN | Lycaonresources | 4% | 23% | 0% | 0% | 0.43 | $12,093,750.00 |
| PRU | Perseus Mining | 4% | 9% | 40% | 70% | 1.9475 | $2,332,389,364.83 |
| MEI | Meteoric Resources | 4% | -3% | -48% | -78% | 0.0145 | $21,368,163.19 |
| WGX | Westgold Resources. | 4% | -14% | 23% | -5% | 1.9925 | $970,667,140.30 |
| PNR | Pantoro Limited | 3% | -9% | 36% | 50% | 0.3 | $480,335,240.81 |
| TBR | Tribune Res | 3% | 6% | -4% | -10% | 4.84 | $246,599,961.90 |
| ASO | Aston Minerals | 3% | 28% | 28% | 78% | 0.16 | $152,671,588.64 |
| M24 | Mamba Exploration | 3% | -11% | -16% | -47% | 0.16 | $5,904,500.42 |
| G88 | Golden Mile Res | 3% | 25% | 35% | 30% | 0.065 | $11,073,172.99 |
| KWR | Kingwest Resources | 3% | -3% | 36% | 48% | 0.17 | $40,090,549.13 |
| S2R | S2 Resources | 3% | 3% | 92% | 0% | 0.175 | $61,474,662.49 |
| VMC | Venus Metals Cor | 3% | 0% | 6% | -5% | 0.18 | $27,194,162.94 |
| SSR | SSR Mining Inc. | 3% | 4% | 44% | 54% | 29.175 | $580,502,796.12 |
| LM8 | Lunnonmetalslimited | 3% | 16% | 88% | 0% | 0.91 | $69,080,076.07 |
| MKR | Manuka Resources. | 3% | -10% | -14% | -27% | 0.285 | $33,084,164.96 |
| STN | Saturn Metals | 3% | -4% | -11% | 5% | 0.39 | $49,361,687.26 |
| CMM | Capricorn Metals | 3% | 3% | 82% | 160% | 3.94 | $1,456,595,297.36 |
| DRE | Dreadnought Resources | 3% | 5% | 5% | 122% | 0.04 | $113,547,342.04 |
| PF1 | Pathfinder Resources | 3% | -1% | 16% | 70% | 0.4 | $20,717,193.90 |
| A1G | African Gold . | 3% | -11% | -13% | -16% | 0.2 | $22,687,962.32 |
| NCM | Newcrest Mining | 3% | 5% | 16% | 7% | 26.83 | $23,214,899,708.00 |
| SVY | Stavely Minerals | 2% | 5% | 4% | -29% | 0.42 | $109,603,809.84 |
| RRL | Regis Resources | 2% | 8% | 8% | -27% | 2.14 | $1,600,125,751.76 |
| NST | Northern Star | 2% | 2% | 23% | 5% | 10.75 | $12,298,294,261.44 |
| RMS | Ramelius Resources | 2% | -1% | 18% | -3% | 1.545 | $1,318,425,365.68 |
| SVL | Silver Mines Limited | 2% | 11% | 32% | 16% | 0.25 | $316,498,875.04 |
| GSN | Great Southern | 2% | 2% | 2% | -18% | 0.051 | $27,150,721.39 |
| OKR | Okapi Resources | 2% | 25% | -47% | 71% | 0.3 | $35,126,751.90 |
| LEX | Lefroy Exploration | 2% | -3% | -16% | -52% | 0.325 | $47,409,267.10 |
| MGV | Musgrave Minerals | 1% | 13% | 28% | 0% | 0.34 | $177,267,073.17 |
| EVN | Evolution Mining | 1% | 3% | 25% | 5% | 4.515 | $8,101,893,958.86 |
| IVR | Investigator Res | 1% | 13% | 18% | -13% | 0.071 | $93,261,955.99 |
| RND | Rand Mining | 1% | 1% | 8% | 3% | 1.57 | $89,295,258.77 |
| HAW | Hawthorn Resources | 1% | -6% | 59% | 33% | 0.081 | $25,013,670.98 |
| ANX | Anax Metals | 1% | 2% | -7% | 42% | 0.088 | $34,036,393.60 |
| NML | Navarre Minerals | 1% | 2% | -3% | -35% | 0.097 | $128,279,182.29 |
| DGO | DGO Gold Limited | 1% | 2% | -6% | -17% | 2.63 | $219,544,804.56 |
| HCH | Hot Chili | 1% | 6% | -33% | -36% | 1.35 | $145,434,153.48 |
| RSG | Resolute Mining | 1% | 25% | -18% | -46% | 0.3375 | $369,817,059.20 |
| NPM | Newpeak Metals | 0% | 0% | -50% | -67% | 0.001 | $8,849,750.03 |
| NMR | Native Mineral Res | 0% | -11% | -17% | -33% | 0.21 | $9,266,972.40 |
| YRL | Yandal Resources | 0% | -11% | -50% | -41% | 0.25 | $29,022,888.25 |
| CWX | Carawine Resources | 0% | -1% | 6% | -25% | 0.2125 | $28,945,212.87 |
| KAL | Kalgoorliegoldmining | 0% | 3% | 0% | 0% | 0.16 | $11,951,709.00 |
| ADN | Andromeda Metals | 0% | 6% | 28% | -46% | 0.185 | $565,249,517.63 |
| TNR | Torian Resources | 0% | 17% | -10% | -44% | 0.028 | $33,499,395.50 |
| MCT | Metalicity Limited | 0% | -14% | -45% | -54% | 0.006 | $15,301,683.26 |
| AME | Alto Metals Limited | 0% | 16% | 15% | 26% | 0.092 | $48,579,451.10 |
| SMI | Santana Minerals | 0% | 22% | 267% | 323% | 0.55 | $71,624,135.52 |
| MHC | Manhattan Corp | 0% | 0% | 8% | -18% | 0.014 | $22,894,180.40 |
| TRY | Troy Resources | 0% | 0% | 0% | -46% | 0.037 | $31,631,563.33 |
| KGM | Kalnorth Gold | 0% | 0% | 0% | 0% | 0.013 | $11,625,120.78 |
| CGN | Crater Gold Min | 0% | 0% | 0% | -19% | 0.017 | $21,063,473.65 |
| TSC | Twenty Seven Co. | 0% | -13% | -30% | -42% | 0.0035 | $9,312,848.67 |
| CY5 | Cygnus Gold Limited | 0% | -13% | 36% | 0% | 0.17 | $20,057,503.55 |
| AGS | Alliance Resources | 0% | 0% | 23% | 8% | 0.18 | $42,123,546.54 |
| DDD | 3D Resources Limited | 0% | 0% | 0% | -50% | 0.003 | $12,541,116.28 |
| PRS | Prospech Limited | 0% | -9% | -40% | -66% | 0.048 | $3,128,688.24 |
| MAU | Magnetic Resources | 0% | 2% | -10% | -9% | 1.45 | $327,540,515.74 |
| MEU | Marmota Limited | 0% | 7% | -6% | 5% | 0.045 | $44,103,659.22 |
| DCN | Dacian Gold | 0% | 9% | 17% | -34% | 0.24 | $260,418,495.12 |
| FG1 | Flynngold | 0% | -15% | -10% | 0% | 0.14 | $8,968,547.00 |
| WWI | West Wits Mining | 0% | -18% | -23% | -53% | 0.036 | $66,176,368.60 |
| GMN | Gold Mountain | 0% | 0% | -55% | -77% | 0.009 | $11,771,640.87 |
| EMU | EMU NL | 0% | 20% | -38% | -66% | 0.018 | $10,996,289.68 |
| SI6 | SI6 Metals Limited | 0% | 11% | -23% | -44% | 0.01 | $14,995,511.84 |
| RVR | Red River Resources | 0% | 5% | 41% | -6% | 0.225 | $116,654,509.80 |
| AUT | Auteco Minerals | 0% | -8% | -8% | -17% | 0.074 | $148,457,241.26 |
| CBY | Canterbury Resources | 0% | 0% | -22% | -32% | 0.075 | $9,239,889.75 |
| IDA | Indiana Resources | 0% | -2% | 3% | -25% | 0.06 | $25,052,116.80 |
| NSM | Northstaw | 0% | 9% | -3% | -30% | 0.3 | $11,837,465.00 |
| POL | Polymetals Resources | 0% | -4% | -4% | 0% | 0.12 | $4,806,787.92 |
| OKU | Oklo Resources | 0% | 2% | -23% | -50% | 0.088 | $44,900,186.63 |
| HRZ | Horizon | 0% | 4% | 14% | 14% | 0.12 | $68,157,024.00 |
| MXR | Maximus Resources | 0% | 2% | -25% | -33% | 0.066 | $20,981,780.69 |
| ALY | Alchemy Resource | 0% | 8% | -5% | -5% | 0.013 | $12,856,656.02 |
| LCY | Legacy Iron Ore | 0% | 11% | 43% | 33% | 0.02 | $134,543,350.18 |
| GML | Gateway Mining | 0% | 8% | -28% | -52% | 0.013 | $31,641,489.14 |
| BDC | Bardoc Gold | 0% | 10% | 56% | 22% | 0.535 | $154,083,695.09 |
| STK | Strickland Metals | 0% | -8% | 6% | 179% | 0.055 | $65,271,814.50 |
| OZM | Ozaurum Resources | 0% | -8% | -15% | -27% | 0.11 | $6,436,800.00 |
| TG1 | Techgen Metals | 0% | 10% | -45% | 0% | 0.11 | $4,789,638.26 |
| PUR | Pursuit Minerals | 0% | 0% | -58% | -73% | 0.02 | $18,910,983.88 |
| BTR | Brightstar Resources | 0% | 0% | 4% | -40% | 0.028 | $18,758,965.20 |
| TRM | Truscott Mining Corp | 0% | 0% | 0% | 52% | 0.032 | $4,862,129.41 |
| DEX | Duke Exploration | 0% | 16% | -21% | -45% | 0.185 | $16,238,007.36 |
| DLC | Delecta Limited | 0% | 0% | -15% | 83% | 0.011 | $13,253,995.76 |
| ENR | Encounter Resources | 0% | 3% | -31% | 4% | 0.15 | $47,522,523.90 |
| PNM | Pacific Nickel Mines | 0% | 26% | 53% | 145% | 0.115 | $31,177,556.74 |
| HAV | Havilah Resources | 0% | 4% | -10% | -19% | 0.175 | $52,667,148.69 |
| SBM | St Barbara Limited | 0% | 8% | 16% | -26% | 1.5225 | $1,064,290,573.50 |
| AGG | AngloGold Ashanti | -1% | 4% | 59% | 19% | 6.56 | $571,821,773.65 |
| RXL | Rox Resources | -1% | -6% | 7% | -36% | 0.395 | $65,886,969.33 |
| GIB | Gibb River Diamonds | -2% | -8% | -20% | -33% | 0.06 | $13,748,113.93 |
| FML | Focus Minerals | -2% | -11% | -2% | -18% | 0.25 | $71,639,661.25 |
| BYH | Bryah Resources | -2% | 4% | -16% | -17% | 0.049 | $10,857,944.40 |
| QML | Qmines Limited | -2% | -8% | -25% | 0% | 0.24 | $15,299,986.17 |
| WMC | Wiluna Mining Corp | -2% | -13% | -9% | -7% | 0.93 | $196,522,898.85 |
| AXE | Archer Materials | -2% | -3% | -51% | 0% | 0.92 | $235,188,846.65 |
| MKG | Mako Gold | -2% | -3% | -6% | -12% | 0.087 | $33,255,019.37 |
| HRN | Horizon Gold | -2% | -2% | 20% | -5% | 0.42 | $44,810,646.72 |
| TIE | Tietto Minerals | -3% | 10% | 77% | 63% | 0.585 | $429,177,628.04 |
| CST | Castile Resources | -3% | -6% | -25% | -20% | 0.165 | $32,952,169.97 |
| SFM | Santa Fe Minerals | -3% | -21% | 94% | 65% | 0.165 | $12,015,100.19 |
| CEL | Challenger Exp | -3% | 5% | 14% | 5% | 0.33 | $329,422,352.82 |
| SLZ | Sultan Resources | -3% | 3% | -9% | -26% | 0.155 | $13,325,502.24 |
| GWR | GWR Group | -3% | 3% | 15% | -39% | 0.15 | $49,788,581.53 |
| HMG | Hamelingoldlimited | -3% | -12% | 0% | 0% | 0.15 | $17,050,000.00 |
| HMG | Hamelingoldlimited | -3% | -12% | 0% | 0% | 0.15 | $17,050,000.00 |
| XAM | Xanadu Mines | -3% | 0% | -15% | -62% | 0.029 | $37,952,140.68 |
| AGC | AGC | -3% | -9% | -31% | -49% | 0.086 | $5,960,000.99 |
| AGC | AGC | -3% | -9% | -31% | -49% | 0.086 | $5,960,000.99 |
| TRN | Torrens Mining | -4% | -4% | -13% | -21% | 0.135 | $9,573,516.63 |
| THR | Thor Mining PLC | -4% | 13% | -25% | -10% | 0.0135 | $12,136,781.71 |
| WCN | White Cliff Min | -4% | 18% | 100% | 30% | 0.026 | $16,916,286.37 |
| ERM | Emmerson Resources | -4% | 9% | 87% | 39% | 0.125 | $64,911,403.57 |
| MM8 | Medallion Metals. | -4% | 11% | 6% | 2% | 0.25 | $25,714,616.58 |
| AAU | Antilles Gold | -4% | -12% | -14% | -24% | 0.073 | $22,192,362.15 |
| G50 | Gold50Limited | -4% | 2% | 2% | 0% | 0.24 | $14,004,500.25 |
| AZS | Azure Minerals | -4% | -3% | 9% | 1% | 0.355 | $111,864,859.56 |
| ICL | Iceni Gold | -4% | 0% | -50% | 0% | 0.115 | $14,101,607.08 |
| AAR | Anglo Australian | -5% | 5% | 28% | 7% | 0.105 | $65,579,716.29 |
| PDI | Predictive Disc | -5% | 5% | 35% | 176% | 0.21 | $302,373,980.04 |
| NWM | Norwest Minerals | -5% | 15% | -23% | -20% | 0.062 | $11,197,657.99 |
| SMS | Starmineralslimited | -5% | 25% | 0% | 0% | 0.2 | $5,250,000.00 |
| TTM | Titan Minerals | -5% | -5% | -13% | -13% | 0.1 | $136,742,891.70 |
| TSO | Tesoro Resources | -5% | 13% | -26% | -61% | 0.078 | $52,137,990.53 |
| MRZ | Mont Royal Resources | -5% | -24% | -30% | -2% | 0.26 | $16,467,347.26 |
| SAU | Southern Gold | -5% | -10% | -22% | -40% | 0.052 | $11,093,095.31 |
| TMZ | Thomson Res | -6% | -18% | -49% | -61% | 0.049 | $29,635,668.45 |
| DEG | De Grey Mining | -6% | 5% | 22% | 12% | 1.215 | $1,704,700,665.25 |
| ARN | Aldoro Resources | -6% | -13% | -28% | 47% | 0.315 | $29,613,734.37 |
| AWV | Anova Metals | -6% | -25% | -25% | -38% | 0.015 | $22,929,507.20 |
| MVL | Marvel Gold Limited | -6% | -11% | -36% | -5% | 0.044 | $26,411,976.36 |
| GMR | Golden Rim Resources | -6% | -28% | -31% | -47% | 0.072 | $17,955,421.49 |
| TCG | Turaco Gold Limited | -7% | 0% | -5% | 50% | 0.105 | $44,910,250.25 |
| AWJ | Auric Mining | -7% | -17% | -39% | -53% | 0.083 | $4,653,756.63 |
| TAR | Taruga Minerals | -7% | -25% | -49% | -40% | 0.027 | $15,447,208.33 |
| CPM | Coopermetalslimited | -7% | -28% | 0% | 0% | 0.38 | $10,267,600.00 |
| SRN | Surefire Rescs NL | -8% | 0% | -11% | -56% | 0.012 | $13,537,414.91 |
| SPQ | Superior Resources | -8% | 22% | 275% | 246% | 0.045 | $76,554,918.81 |
| KCC | Kincora Copper | -9% | -5% | -5% | 0% | 0.1325 | $9,880,801.07 |
| VAN | Vango Mining | -9% | -16% | -51% | -66% | 0.031 | $39,058,066.59 |
| BEZ | Besragoldinc | -9% | -15% | 0% | 0% | 0.072 | $11,857,647.24 |
| CDR | Codrus Minerals | -9% | -23% | -38% | 0% | 0.1 | $4,000,000.00 |
| ZAG | Zuleika Gold | -9% | -14% | 25% | -23% | 0.03 | $13,028,191.25 |
| MOH | Moho Resources | -11% | 0% | -23% | -42% | 0.051 | $6,636,563.39 |
| PRX | Prodigy Gold NL | -12% | -12% | -44% | -51% | 0.023 | $13,400,434.94 |
| BMO | Bastion Minerals | -12% | -12% | -38% | -30% | 0.15 | $11,389,389.00 |
| AQX | Alice Queen | -13% | -13% | -30% | -71% | 0.007 | $12,262,784.08 |
| GSR | Greenstone Resources | -13% | 3% | 30% | 59% | 0.035 | $32,075,879.12 |
| TBA | Tombola Gold | -13% | 21% | -11% | -31% | 0.034 | $25,872,073.12 |
| GBR | Greatbould Resources | -13% | -7% | -34% | 286% | 0.135 | $44,779,476.13 |
| M2R | Miramar | -14% | -3% | -24% | -26% | 0.16 | $8,468,553.40 |
| EM2 | Eagle Mountain | -14% | -20% | -38% | -3% | 0.45 | $104,272,912.80 |
| DCX | Discovex Res | -17% | -17% | 50% | 15% | 0.0075 | $17,980,648.53 |
| CXU | Cauldron Energy | -17% | -17% | -55% | -62% | 0.015 | $8,298,874.79 |
| OAU | Ora Gold Limited | -22% | -30% | -8% | -33% | 0.014 | $13,754,237.97 |
| SIH | Sihayo Gold Limited | -23% | -17% | -50% | -64% | 0.005 | $18,427,307.07 |
Related Topics

Related Stories

UNLOCK INSIGHTS
Discover the untold stories of emerging ASX stocks.
Daily news and expert analysis, it's free to subscribe.
By proceeding, you confirm you understand that we handle personal information in accordance with our Privacy Policy.


