Gold Digger: Solar, electric vehicle demand could push silver market into long term deficit
Pic: Stockhead, Getty Images
Global silver demand hit ~1.02 billion ounces in 2021, the first time it has breached 1 billion since 2015, according to the Silver Institute.
Of that, industrial demand hit a new high of 524 million ounces.
And of that, photovoltaic (solar panel) demand rose by ~13% to over 110Moz — a new high which highlights silver’s vital role in the green economy.
Uniquely for the four main precious metals, silver saw a deficit last year and is forecast to remain in deficit this year, when the gap between supply (1.09 billion ounces) and demand (1.128 billion ounces) is expected to widen further.
“The fact that green demand is forecast to grow strongly in the next few years only adds to trends in other supply and demand segments,” Metals Focus says.
“As a result, the deficit is expected to grow in the coming years … [and] has a strong likelihood of becoming structural.”
Silver and Solar: Making hay while the sun shines
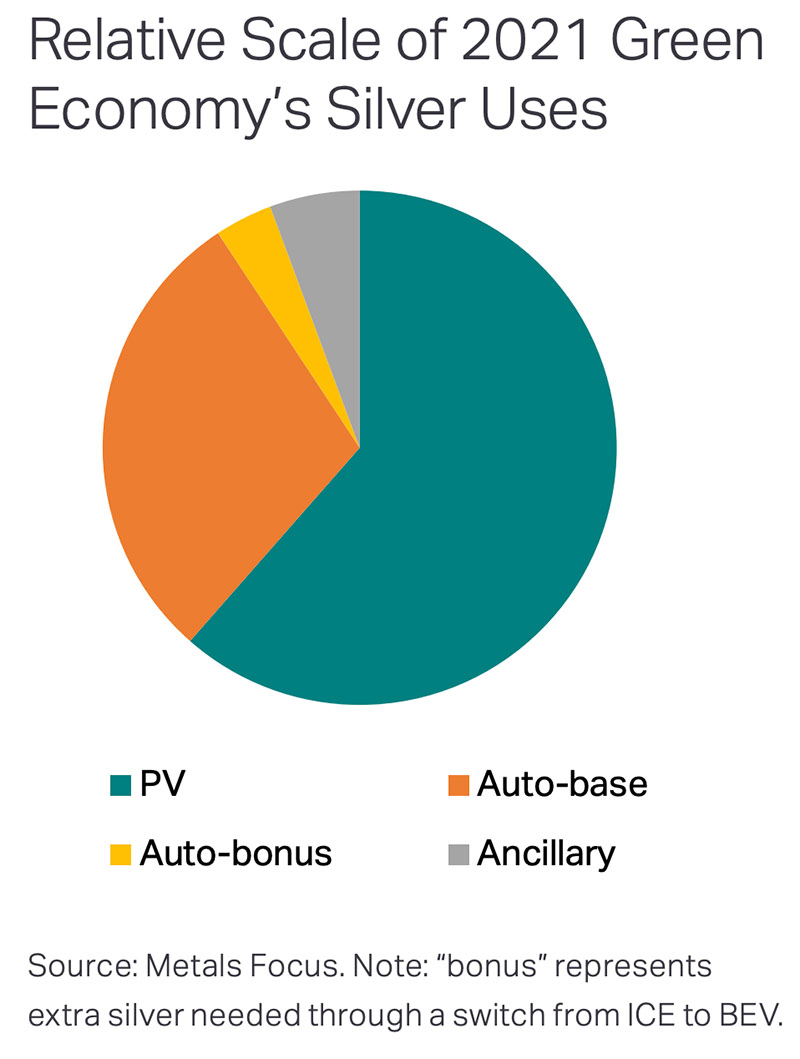
The star of silver use in the green economy over the last decade has been photovoltaics (PV), Metals Focus says.
Installations have grown massively over the last decade, up from a modest 16GW in 2010 to 158GW in 2021.
And despite heavy thrifting – Metals Focus estimates a typical cell in 2021 would only have around 20% of the silver used in 2010 — silver in PV has risen from around 5% of total silver demand in 2010 to over 10% by 2021.
There is no sign of this importance slackening either.
“We initially expected that this would all translate into slight growth in silver use in 2022 but we have recently seen forecasts suggesting much higher installations, perhaps as much as 200GW,” Metals Focus says.
“If this were to occur, PV’s silver demand in 2022 would rise by well over 10%.”
“Thereafter however, end-use could plateau as ongoing thrifting counters still high installation figures plus the bonus from the replacement of end-of-life cells (those installed before say 2010).”
Silver and Automobiles: Hitting the accelerator

While silver demand in PV might start to plateau, the opposite is true for silver use in the automotive industry, Metals Focus says.
As shown in the chart above, much will stem from the recovery in vehicle production as the chip crisis eases, but total silver use is forecast to rise at a much stronger pace than mere vehicle numbers.
This is partly due to the growing adoption of things like complex infotainment systems but mostly due to the rise of EVs, which use a lot more silver than their ICE counterparts.
“Battery electric vehicles (BEVs) require much greater amounts of silver than do internal combustion engine (ICE) vehicles,” Metals Focus says.
“These areas include the two electrodes per battery (of which there can be thousands) and the powertrain’s wiring.”
“The latter needs silver (typically in a 70:30 copper-silver mix) because of the high voltages involved.”
Current estimates point to PV being roughly twice the size of automotive. That could change very soon, Metals Focus says.
“This relative importance will rapidly change in the next few years as PV plateaus and as BEVs numbers surge; it would not surprise therefore if this BEV “bonus” reaches 20% in a few years and that total automotive use becomes similar in scale to PV demand.”
Gold, silver maintain pricing
Gold has held steady near US$1,820 and silver at $US23/oz following the latest round of US inflation data, with large cap ASX gold stocks performing well over the last few sessions.
Both have a gained a bit over 1% year-to-date.
“Gold is still comfortably above the $1800 level and could see a strong test tomorrow if earnings season, retail sales, and consumer sentiment paint an upbeat picture about the economy,” OANDA senior market analyst Edward Moya said Friday morning EST time.
“Gold’s best environment in the short-term might be if risk appetite remains strong, but risks to the outlook continue to grow.”
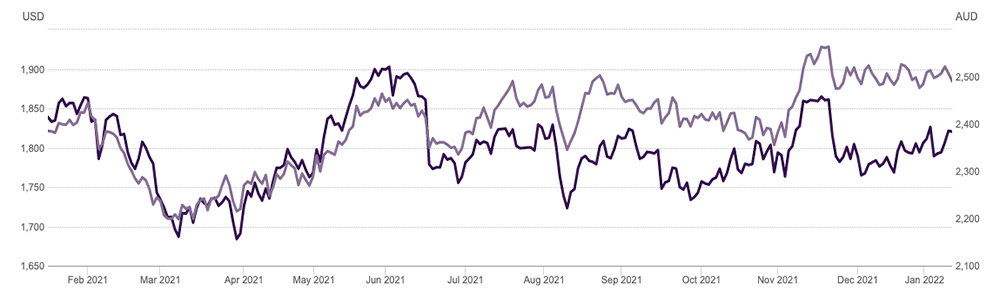
USD (dark) and AUD (light) gold prices over the past 12 months. Sources: FastMarkets, ICE Benchmark Administration, Thomson Reuters, World Gold Council
Winners & Losers
Here’s how ASX-listed gold & silver stocks are performing:
Scroll or swipe to reveal table. Click headings to sort. Best viewed on a laptop.
| CODE | COMPANY | PRICE | % YEAR | %SIX MONTH | % ONE MONTH | % WEEK | MARKET CAP |
|---|---|---|---|---|---|---|---|
| NPM | Newpeak Metals | 0.002 | -33% | 0% | 33% | 100% | $15,299,500.07 |
| NAE | New Age Exploration | 0.019 | 46% | 46% | 90% | 73% | $22,974,382.56 |
| ARL | Ardea Resources Ltd | 0.75 | 67% | 70% | 50% | 63% | $70,803,411.69 |
| SFM | Santa Fe Minerals | 0.22 | 150% | 156% | 100% | 57% | $16,384,227.53 |
| ANL | Amani Gold Ltd | 0.0015 | 50% | -25% | 50% | 50% | $34,313,346.16 |
| MDI | Middle Island Res | 0.145 | -59% | 16% | 51% | 45% | $17,138,551.08 |
| PNM | Pacific Nickel Mines | 0.12 | 118% | 140% | 48% | 43% | $28,447,528.10 |
| XTC | Xantippe Res Ltd | 0.0095 | 375% | 375% | 90% | 36% | $51,647,610.56 |
| FAU | First Au Ltd | 0.012 | -29% | -8% | 20% | 33% | $9,406,931.39 |
| AM7 | Arcadia Minerals | 0.28 | 0% | 60% | 27% | 30% | $9,306,204.75 |
| BYH | Bryah Resources Ltd | 0.058 | -16% | 0% | 10% | 29% | $12,667,601.80 |
| MLS | Metals Australia | 0.0025 | 25% | 25% | 25% | 25% | $10,477,114.72 |
| SLZ | Sultan Resources Ltd | 0.21 | 2% | 14% | 31% | 24% | $13,906,877.80 |
| AXE | Archer Materials | 1.33 | 140% | 15% | 17% | 23% | $336,691,401.52 |
| PGD | Peregrine Gold | 0.72 | 0% | 69% | 97% | 23% | $24,191,132.40 |
| CPM | Coopermetalslimited | 0.3075 | 0% | 0% | 76% | 23% | $8,241,100.00 |
| ZNC | Zenith Minerals Ltd | 0.355 | 209% | 31% | 58% | 22% | $93,903,204.95 |
| BTR | Brightstar Resources | 0.059 | -18% | 103% | 26% | 20% | $32,811,652.14 |
| BNR | Bulletin Res Ltd | 0.09 | 25% | 53% | 18% | 20% | $24,702,624.35 |
| MRZ | Mont Royal Resources | 0.395 | 52% | 58% | 0% | 20% | $23,042,700.65 |
| PF1 | Pathfinder Resources | 0.34 | 19% | 6% | 17% | 19% | $19,123,563.60 |
| SKY | SKY Metals Ltd | 0.125 | -36% | 25% | 25% | 19% | $45,214,016.40 |
| WCN | White Cliff Min Ltd | 0.025 | -11% | 108% | 56% | 19% | $13,050,320.78 |
| TNR | Torian Resources Ltd | 0.026 | -7% | 0% | 44% | 18% | $23,980,926.05 |
| TAR | Taruga Minerals | 0.048 | -4% | -6% | 23% | 17% | $23,554,760.28 |
| LNY | Laneway Res Ltd | 0.007 | 0% | 40% | 17% | 17% | $29,981,461.53 |
| DDD | 3D Resources Limited | 0.0035 | -15% | -13% | 0% | 17% | $13,581,302.32 |
| GSM | Golden State Mining | 0.098 | -46% | -41% | 18% | 17% | $8,308,798.50 |
| RDS | Redstone Resources | 0.015 | 0% | 15% | 15% | 15% | $11,503,985.01 |
| TBA | Tombola Gold Ltd | 0.032 | -46% | -20% | 0% | 14% | $23,948,903.55 |
| BMR | Ballymore Resources | 0.205 | 0% | 0% | -5% | 14% | $13,226,054.58 |
| IDA | Indiana Resources | 0.066 | 10% | -6% | 10% | 14% | $27,401,658.48 |
| LCL | Los Cerros Limited | 0.125 | 4% | -31% | -4% | 14% | $86,142,332.93 |
| S2R | S2 Resources | 0.21 | 8% | 45% | 8% | 14% | $76,620,593.83 |
| PNR | Pantoro Limited | 0.38 | 62% | 77% | 12% | 13% | $591,989,453.16 |
| KCN | Kingsgate Consolid. | 2.13 | 124% | 163% | 21% | 13% | $482,478,587.54 |
| ADN | Andromeda Metals Ltd | 0.215 | -30% | 30% | 26% | 13% | $534,001,314.89 |
| XAM | Xanadu Mines Ltd | 0.0305 | -24% | -15% | 17% | 13% | $36,644,334.75 |
| SIH | Sihayo Gold Limited | 0.009 | -55% | -18% | 29% | 13% | $33,169,152.72 |
| TSC | Twenty Seven Co. Ltd | 0.0045 | -25% | 0% | 0% | 13% | $11,973,662.57 |
| OAU | Ora Gold Limited | 0.018 | -14% | 0% | 38% | 13% | $17,684,020.24 |
| DEG | De Grey Mining | 1.26 | 23% | 4% | 8% | 12% | $1,680,676,112.38 |
| LM8 | Lunnonmetalslimited | 0.535 | 0% | 19% | 30% | 11% | $40,981,083.46 |
| AAJ | Aruma Resources Ltd | 0.088 | -16% | 44% | 31% | 11% | $10,580,766.25 |
| AMI | Aurelia Metals Ltd | 0.445 | 2% | -3% | 0% | 11% | $550,490,123.37 |
| GWR | GWR Group Ltd | 0.2 | -51% | -51% | 90% | 11% | $65,267,463.14 |
| HAW | Hawthorn Resources | 0.11 | 11% | 124% | 13% | 11% | $33,018,045.69 |
| RGL | Riversgold | 0.02 | -62% | -43% | 0% | 11% | $7,676,801.72 |
| AZS | Azure Minerals | 0.405 | -25% | 72% | 13% | 11% | $133,616,360.03 |
| GBR | Greatbould Resources | 0.155 | 260% | 76% | 19% | 11% | $53,585,371.35 |
| HMX | Hammer Metals Ltd | 0.063 | 62% | -31% | 37% | 11% | $49,714,672.00 |
| GTR | Gti Resources | 0.0265 | 6% | 19% | 10% | 10% | $29,348,311.93 |
| MTC | Metalstech Ltd | 0.33 | 124% | 78% | 14% | 10% | $54,999,314.70 |
| AWJ | Auric Mining | 0.11 | 0% | -27% | 0% | 10% | $6,167,629.27 |
| RRL | Regis Resources | 2.01 | -45% | -21% | 10% | 10% | $1,509,552,596.00 |
| A8G | Australasian Metals | 0.615 | 0% | 324% | 43% | 10% | $23,298,886.52 |
| DTM | Dart Mining NL | 0.093 | -48% | -34% | 13% | 9% | $12,075,620.21 |
| SMI | Santana Minerals Ltd | 0.35 | 84% | 312% | 9% | 9% | $46,423,050.80 |
| WWI | West Wits Mining Ltd | 0.035 | -50% | -57% | 3% | 9% | $66,039,568.60 |
| TSO | Tesoro Resources Ltd | 0.082 | -72% | -53% | 5% | 9% | $43,249,241.65 |
| BAT | Battery Minerals Ltd | 0.012 | -45% | -37% | -8% | 9% | $29,343,307.14 |
| MM8 | Medallion Metals. | 0.25 | 0% | -2% | 35% | 9% | $27,467,678.94 |
| BRV | Big River Gold Ltd | 0.255 | -31% | -38% | 6% | 9% | $54,860,613.00 |
| MHC | Manhattan Corp Ltd | 0.013 | -53% | -7% | 0% | 8% | $19,078,483.66 |
| ANX | Anax Metals Ltd | 0.0865 | 88% | 14% | -2% | 8% | $31,369,546.21 |
| PUR | Pursuit Minerals | 0.027 | -7% | -58% | -4% | 8% | $25,529,828.24 |
| HCH | Hot Chili Ltd | 1.8 | -14% | 9% | -6% | 8% | $193,324,887.00 |
| GML | Gateway Mining | 0.014 | -58% | -26% | -18% | 8% | $31,641,489.14 |
| GRL | Godolphin Resources | 0.145 | -34% | -19% | 4% | 7% | $11,775,591.94 |
| KAI | Kairos Minerals Ltd | 0.029 | -15% | 0% | 16% | 7% | $50,537,434.84 |
| EM2 | Eagle Mountain | 0.66 | 63% | -27% | 20% | 7% | $151,537,705.44 |
| WAF | West African Res Ltd | 1.33 | 35% | 20% | -4% | 7% | $1,378,044,690.75 |
| VKA | Viking Mines Ltd | 0.015 | -61% | -21% | -17% | 7% | $14,353,618.03 |
| NSM | Northstaw | 0.3 | -31% | -9% | -2% | 7% | $11,837,465.00 |
| AZL | Arizona Lithium Ltd | 0.1125 | 765% | 241% | 13% | 7% | $227,378,727.61 |
| MEU | Marmota Limited | 0.046 | -4% | -4% | 5% | 7% | $45,083,740.54 |
| ERM | Emmerson Resources | 0.165 | 114% | 126% | 14% | 6% | $79,718,158.24 |
| DGO | DGO Gold Limited | 2.81 | -4% | -24% | 6% | 6% | $221,214,346.80 |
| CAI | Calidus Resources | 0.745 | 52% | 52% | 24% | 6% | $304,201,410.64 |
| TRM | Truscott Mining Corp | 0.034 | 89% | -6% | 13% | 6% | $5,166,012.50 |
| CBY | Canterbury Resources | 0.088 | -20% | -12% | 6% | 6% | $10,841,470.64 |
| KRM | Kingsrose Mining Ltd | 0.089 | 112% | 65% | 3% | 6% | $70,169,732.69 |
| VMC | Venus Metals Cor Ltd | 0.18 | -10% | -10% | 3% | 6% | $27,194,162.94 |
| DCN | Dacian Gold Ltd | 0.205 | -59% | -33% | 24% | 5% | $222,440,797.92 |
| RMS | Ramelius Resources | 1.5175 | -6% | -10% | 2% | 5% | $1,266,382,259.14 |
| MKG | Mako Gold | 0.105 | -16% | 24% | -13% | 5% | $40,135,368.21 |
| RDN | Raiden Resources Ltd | 0.021 | -30% | -25% | 5% | 5% | $30,257,200.69 |
| MEG | Megado | 0.087 | -57% | -30% | -4% | 5% | $3,659,147.83 |
| CDT | Castle Minerals | 0.044 | 389% | 193% | 76% | 5% | $35,173,786.04 |
| EVN | Evolution Mining Ltd | 4.04 | -15% | -13% | 0% | 5% | $7,350,360,808.83 |
| EMR | Emerald Res NL | 1.14 | 44% | 34% | 7% | 5% | $613,048,003.98 |
| PRU | Perseus Mining Ltd | 1.6 | 33% | 8% | 2% | 5% | $1,917,384,306.35 |
| AQI | Alicanto Min Ltd | 0.115 | -8% | -41% | -8% | 5% | $44,012,065.96 |
| CAZ | Cazaly Resources | 0.047 | 7% | -15% | 4% | 4% | $17,369,473.55 |
| WRM | White Rock Min Ltd | 0.235 | -57% | -54% | 4% | 4% | $35,682,581.89 |
| AAR | Anglo Australian | 0.12 | -11% | 50% | 36% | 4% | $71,541,508.68 |
| SFR | Sandfire Resources | 7.07 | 40% | 13% | 12% | 4% | $2,861,673,613.14 |
| CHN | Chalice Mining Ltd | 8.66 | 120% | 24% | -2% | 4% | $3,095,368,693.28 |
| ADV | Ardiden Ltd | 0.0125 | -43% | 56% | 14% | 4% | $28,188,359.63 |
| THR | Thor Mining PLC | 0.0125 | -22% | -26% | -11% | 4% | $10,981,885.98 |
| HXG | Hexagon Energy | 0.076 | -21% | 7% | 1% | 4% | $33,451,037.03 |
| AAU | Antilles Gold Ltd | 0.077 | 0% | 1% | 7% | 4% | $23,104,377.04 |
| ADT | Adriatic Metals | 2.58 | 19% | -1% | -4% | 4% | $542,734,986.92 |
| OZM | Ozaurum Resources | 0.13 | 0% | -4% | 4% | 4% | $7,438,080.00 |
| NCM | Newcrest Mining | 24.97 | -7% | -4% | 8% | 4% | $20,203,566,823.70 |
| AL8 | Alderan Resource Ltd | 0.028 | -75% | -44% | -24% | 4% | $11,915,850.24 |
| GSR | Greenstone Resources | 0.028 | 4% | 40% | -3% | 4% | $23,405,281.98 |
| NST | Northern Star | 9.36 | -28% | -9% | 4% | 4% | $10,714,423,030.80 |
| KCC | Kincora Copper | 0.15 | 0% | -38% | 25% | 3% | $10,966,367.85 |
| RDT | Red Dirt Metals Ltd | 0.775 | 204% | 384% | 22% | 3% | $198,288,742.32 |
| AGG | AngloGold Ashanti | 5.63 | -6% | 4% | 4% | 3% | $505,808,027.55 |
| AME | Alto Metals Limited | 0.098 | 3% | 6% | -4% | 3% | $52,275,713.69 |
| AGC | AGC Ltd | 0.1 | 0% | -31% | 10% | 3% | $6,772,728.40 |
| AGC | AGC Ltd | 0.1 | 0% | -31% | 10% | 3% | $6,772,728.40 |
| BBX | BBX Minerals Ltd | 0.17 | -39% | -26% | -3% | 3% | $78,203,650.75 |
| CMM | Capricorn Metals | 3.345 | 99% | 83% | 2% | 3% | $1,236,820,146.22 |
| PDI | Predictive Disc Ltd | 0.2725 | 354% | 187% | 16% | 3% | $375,465,640.00 |
| MZZ | Matador Mining Ltd | 0.365 | 6% | -18% | 0% | 3% | $75,592,482.35 |
| AUT | Auteco Minerals | 0.076 | -31% | -37% | 12% | 3% | $126,613,420.20 |
| LRL | Labyrinth Resources | 0.038 | 27% | -16% | 9% | 3% | $31,304,203.16 |
| SLR | Silver Lake Resource | 1.76 | -1% | 2% | 8% | 3% | $1,553,991,417.23 |
| GIB | Gibb River Diamonds | 0.08 | 0% | 36% | -11% | 3% | $17,343,774.49 |
| BGL | Bellevue Gold Ltd | 0.825 | -24% | -18% | -5% | 2% | $855,980,395.23 |
| ASO | Aston Minerals Ltd | 0.1125 | 231% | -30% | -6% | 2% | $114,503,691.48 |
| GBZ | GBM Rsources Ltd | 0.1125 | -10% | -13% | -6% | 2% | $61,297,116.84 |
| BDC | Bardoc Gold Ltd | 0.475 | -10% | 26% | 25% | 2% | $136,640,257.91 |
| KTA | Krakatoa Resources | 0.048 | -36% | -8% | 2% | 2% | $14,440,785.93 |
| G50 | Gold50Limited | 0.255 | 0% | 0% | 2% | 2% | $14,284,590.26 |
| SBM | St Barbara Limited | 1.38 | -40% | -25% | -7% | 2% | $972,052,057.13 |
| ALK | Alkane Resources Ltd | 0.88 | 5% | -22% | 9% | 2% | $521,135,492.50 |
| MAT | Matsa Resources | 0.059 | -39% | -34% | 7% | 2% | $20,819,367.96 |
| CEL | Challenger Exp Ltd | 0.3 | 28% | 0% | 9% | 2% | $293,836,127.40 |
| MKR | Manuka Resources. | 0.31 | -21% | 7% | 0% | 2% | $30,954,774.22 |
| MOH | Moho Resources | 0.063 | -28% | -13% | 7% | 2% | $7,923,850.33 |
| STK | Strickland Metals | 0.07 | 86% | 67% | 6% | 1% | $90,852,805.86 |
| MML | Medusa Mining Ltd | 0.705 | -10% | -21% | -1% | 1% | $148,688,755.22 |
| WGX | Westgold Resources. | 1.925 | -23% | 3% | 1% | 1% | $802,060,272.91 |
| A1G | African Gold Ltd. | 0.195 | -4% | -4% | 15% | 1% | $22,592,962.32 |
| NXM | Nexus Minerals Ltd | 0.425 | 227% | 406% | -28% | 1% | $122,381,308.08 |
| CYL | Catalyst Metals | 1.92 | -9% | -7% | -7% | 1% | $188,542,709.55 |
| RED | Red 5 Limited | 0.2775 | 7% | 46% | -3% | 1% | $659,780,982.56 |
| SSR | SSR Mining Inc. | 23.46 | -2% | 12% | -1% | 1% | $492,646,001.99 |
| BC8 | Black Cat Syndicate | 0.61 | -13% | 2% | 15% | 1% | $86,596,803.77 |
| MRR | Minrex Resources Ltd | 0.057 | 148% | 200% | 54% | 0% | $37,965,797.30 |
| GED | Golden Deeps | 0.011 | -8% | -15% | -8% | 0% | $8,534,365.84 |
| TMX | Terrain Minerals | 0.008 | -20% | -20% | 0% | 0% | $5,886,088.07 |
| IPT | Impact Minerals | 0.0135 | -29% | -4% | 0% | 0% | $26,309,333.95 |
| PRX | Prodigy Gold NL | 0.034 | -32% | -17% | 0% | 0% | $19,809,338.60 |
| REZ | Resourc & En Grp Ltd | 0.064 | 36% | 106% | 39% | 0% | $31,987,570.50 |
| KAL | Kalgoorliegoldmining | 0.145 | 0% | 0% | -3% | 0% | $10,865,190.00 |
| MEI | Meteoric Resources | 0.017 | -76% | -67% | 6% | 0% | $25,947,055.31 |
| SRN | Surefire Rescs NL | 0.011 | -56% | -21% | 0% | 0% | $12,147,414.50 |
| AWV | Anova Metals Ltd | 0.018 | -33% | -10% | -5% | 0% | $25,795,695.60 |
| PAK | Pacific American Hld | 0.016 | -29% | 1% | -11% | 0% | $7,646,038.43 |
| MCT | Metalicity Limited | 0.009 | -47% | -31% | 0% | 0% | $21,839,569.80 |
| CTO | Citigold Corp Ltd | 0.009 | -36% | -25% | -10% | 0% | $25,502,931.82 |
| M2R | Miramar | 0.18 | -37% | -3% | -23% | 0% | $8,717,628.50 |
| TRY | Troy Resources Ltd | 0.037 | -59% | -10% | 0% | 0% | $31,631,563.33 |
| KGM | Kalnorth Gold Ltd | 0.013 | 0% | 0% | 0% | 0% | $11,625,120.78 |
| CGN | Crater Gold Min Ltd | 0.017 | -15% | 0% | 0% | 0% | $20,867,429.74 |
| RMX | Red Mount Min Ltd | 0.01 | -29% | 0% | 11% | 0% | $14,644,583.02 |
| NML | Navarre Minerals Ltd | 0.078 | -58% | -20% | 13% | 0% | $106,444,427.86 |
| BCN | Beacon Minerals | 0.033 | 4% | -3% | 6% | 0% | $118,511,744.74 |
| SVL | Silver Mines Limited | 0.21 | -11% | -19% | 8% | 0% | $271,284,750.03 |
| FG1 | Flynngold | 0.16 | 0% | 0% | -14% | 0% | $10,149,768.00 |
| RML | Resolution Minerals | 0.017 | -55% | -31% | 6% | 0% | $10,501,865.58 |
| HMG | Hamelingoldlimited | 0.15 | 0% | 0% | 3% | 0% | $17,600,000.00 |
| HMG | Hamelingoldlimited | 0.15 | 0% | 0% | 3% | 0% | $17,600,000.00 |
| CLA | Celsius Resource Ltd | 0.025 | -55% | -31% | 19% | 0% | $26,349,452.03 |
| TCG | Turaco Gold Limited | 0.115 | 92% | 15% | -12% | 0% | $49,027,694.82 |
| KWR | Kingwest Resources | 0.195 | 5% | 138% | 8% | 0% | $49,786,407.63 |
| RVR | Red River Resources | 0.2 | -29% | -15% | 14% | 0% | $103,692,897.60 |
| TAM | Tanami Gold NL | 0.062 | -31% | -16% | -3% | 0% | $74,031,113.90 |
| GSN | Great Southern | 0.064 | -26% | 23% | 5% | 0% | $30,877,290.99 |
| CDR | Codrus Minerals Ltd | 0.135 | 0% | -31% | -10% | 0% | $5,400,000.00 |
| ALY | Alchemy Resource Ltd | 0.012 | -23% | -18% | 9% | 0% | $11,428,138.68 |
| AVW | Avira Resources Ltd | 0.005 | -38% | -9% | 0% | 0% | $8,593,950.00 |
| ZAG | Zuleika Gold Ltd | 0.02 | -63% | -29% | -5% | 0% | $8,201,867.46 |
| ARN | Aldoro Resources | 0.37 | 90% | -5% | -9% | 0% | $33,092,277.93 |
| DTR | Dateline Resources | 0.077 | 54% | -9% | -1% | 0% | $33,720,745.14 |
| TLM | Talisman Mining | 0.17 | 55% | -6% | 10% | 0% | $30,977,017.01 |
| GNM | Great Northern | 0.006 | -54% | -50% | -14% | 0% | $9,808,831.34 |
| STN | Saturn Metals | 0.405 | -36% | -12% | -1% | 0% | $50,826,337.60 |
| E2M | E2 Metals | 0.285 | -50% | -14% | 2% | 0% | $43,636,651.77 |
| AYM | Australia United Min | 0.008 | 0% | 0% | 14% | 0% | $14,740,619.88 |
| KLA | Kirkland Lake Gold | 56.8 | 6% | 6% | 7% | 0% | $56,740,000.00 |
| RND | Rand Mining Ltd | 1.46 | -18% | 0% | 1% | -1% | $83,038,903.06 |
| TBR | Tribune Res Ltd | 4.82 | -18% | -5% | 0% | -1% | $252,896,131.14 |
| HRN | Horizon Gold Ltd | 0.42 | -14% | 2% | -3% | -1% | $46,944,487.04 |
| YRL | Yandal Resources | 0.375 | -12% | -29% | -3% | -1% | $44,695,247.91 |
| GOR | Gold Road Res Ltd | 1.465 | 15% | 12% | 0% | -1% | $1,296,415,517.46 |
| KZR | Kalamazoo Resources | 0.36 | -41% | -5% | 6% | -1% | $52,995,946.51 |
| RSG | Resolute Mining | 0.35 | -55% | -41% | -3% | -1% | $386,376,032.00 |
| NWM | Norwest Minerals | 0.067 | -16% | -19% | -11% | -1% | $12,100,689.03 |
| LEX | Lefroy Exploration | 0.31 | 51% | -63% | -3% | -2% | $45,221,147.08 |
| TMZ | Thomson Res Ltd | 0.062 | -46% | -52% | 3% | -2% | $35,398,253.21 |
| SNG | Siren Gold | 0.275 | -61% | 12% | -5% | -2% | $23,220,978.83 |
| HRZ | Horizon | 0.1225 | 23% | -6% | -2% | -2% | $70,996,900.00 |
| NMR | Native Mineral Res | 0.23 | -41% | 1% | -2% | -2% | $9,730,060.09 |
| G88 | Golden Mile Res Ltd | 0.045 | -17% | -24% | -10% | -2% | $7,695,824.76 |
| MAU | Magnetic Resources | 1.46 | 19% | -3% | -4% | -2% | $326,418,801.65 |
| DRE | Drednought Resources | 0.04 | 90% | 3% | 3% | -2% | $113,487,342.04 |
| LYN | Lycaonresources | 0.4 | 0% | 0% | 14% | -2% | $11,340,000.00 |
| WMC | Wiluna Mining Corp | 1.15 | -14% | 17% | 12% | -3% | $245,125,336.20 |
| CY5 | Cygnus Gold Limited | 0.17 | -6% | 48% | -6% | -3% | $19,789,353.37 |
| RXL | Rox Resources | 0.34 | -55% | -16% | -8% | -3% | $55,162,664.90 |
| BNZ | Benzmining | 0.63 | -57% | -27% | -7% | -3% | $33,163,254.21 |
| ENR | Encounter Resources | 0.155 | 4% | 1% | 11% | -3% | $49,106,608.03 |
| TG1 | Techgen Metals Ltd | 0.15 | 0% | -25% | 0% | -3% | $6,531,324.90 |
| SAU | Southern Gold | 0.055 | -54% | -23% | -2% | -4% | $11,733,081.58 |
| CXU | Cauldron Energy Ltd | 0.026 | -47% | -21% | 4% | -4% | $13,264,928.01 |
| OKU | Oklo Resources Ltd | 0.115 | -45% | -8% | -21% | -4% | $58,017,095.09 |
| AUC | Ausgold Limited | 0.045 | -4% | 5% | -4% | -4% | $75,880,303.43 |
| NVA | Nova Minerals Ltd | 1.12 | -30% | -10% | -7% | -4% | $202,727,570.63 |
| LCY | Legacy Iron Ore | 0.022 | -42% | 38% | -19% | -4% | $140,950,176.38 |
| ICG | Inca Minerals Ltd | 0.11 | 51% | 0% | 5% | -4% | $50,527,223.04 |
| MVL | Marvel Gold Limited | 0.064 | 28% | 12% | -4% | -4% | $36,976,766.90 |
| KSN | Kingston Resources | 0.1575 | -37% | -25% | -5% | -5% | $57,072,729.12 |
| IVR | Investigator Res Ltd | 0.063 | -21% | -11% | -6% | -5% | $86,316,529.46 |
| BEZ | Besragoldinc | 0.105 | 0% | 0% | -5% | -5% | $19,762,745.40 |
| TTM | Titan Minerals | 0.1 | -17% | -5% | -5% | -5% | $148,020,655.97 |
| PKO | Peako Limited | 0.02 | -17% | -49% | -5% | -5% | $6,477,536.12 |
| GUL | Gullewa Limited | 0.078 | -11% | -5% | 15% | -5% | $15,039,474.90 |
| KAU | Kaiser Reef | 0.195 | -52% | -25% | 5% | -5% | $23,872,039.23 |
| TIE | Tietto Minerals | 0.485 | 21% | 35% | 17% | -5% | $311,771,830.50 |
| AQX | Alice Queen Ltd | 0.0095 | -68% | -37% | -5% | -5% | $12,332,007.09 |
| EMU | EMU NL | 0.019 | -58% | -46% | -5% | -5% | $10,446,475.20 |
| GMR | Golden Rim Resources | 0.1325 | -20% | 10% | 49% | -5% | $33,205,231.53 |
| SVY | Stavely Minerals Ltd | 0.5 | -35% | 15% | 0% | -6% | $134,395,147.78 |
| MGV | Musgrave Minerals | 0.325 | -13% | -10% | -10% | -6% | $177,267,073.17 |
| DEX | Duke Exploration | 0.16 | -52% | -56% | -14% | -6% | $13,982,728.56 |
| CHZ | Chesser Resources | 0.1175 | -48% | -10% | 7% | -6% | $54,036,776.61 |
| TRN | Torrens Mining | 0.15 | -36% | -35% | -25% | -6% | $10,449,740.70 |
| KNB | Koonenberrygold | 0.15 | 0% | 0% | -13% | -6% | $10,746,853.06 |
| OBM | Ora Banda Mining Ltd | 0.059 | -82% | -61% | -11% | -6% | $58,453,470.30 |
| PUA | Peak Minerals Ltd | 0.014 | -39% | -21% | 12% | -7% | $15,099,855.14 |
| MTH | Mithril Resources | 0.014 | -33% | -22% | -7% | -7% | $38,703,495.62 |
| GMN | Gold Mountain Ltd | 0.014 | -65% | -54% | -7% | -7% | $14,982,088.38 |
| BGD | Bartongoldholdings | 0.2 | 0% | -5% | -2% | -7% | $17,167,999.20 |
| SPQ | Superior Resources | 0.053 | 308% | 342% | 172% | -7% | $80,420,633.82 |
| PNX | PNX Metals Limited | 0.0065 | -7% | -24% | 8% | -7% | $23,739,257.82 |
| MBK | Metal Bank Ltd | 0.0065 | -51% | -24% | -7% | -7% | $16,950,818.04 |
| VAN | Vango Mining Ltd | 0.051 | -34% | -25% | -14% | -7% | $65,516,756.86 |
| CST | Castile Resources | 0.185 | -38% | -20% | -8% | -8% | $36,946,372.39 |
| OKR | Okapi Resources | 0.365 | 43% | 18% | -3% | -8% | $39,984,270.90 |
| QML | Qmines Limited | 0.3 | 0% | -19% | -14% | -8% | $16,852,107.47 |
| NAG | Nagambie Resources | 0.06 | 30% | -35% | -10% | -8% | $29,995,940.76 |
| MXR | Maximus Resources | 0.072 | -54% | -1% | 26% | -8% | $22,253,386.68 |
| DCX | Discovex Res Ltd | 0.011 | 57% | 120% | 175% | -8% | $28,255,304.84 |
| CWX | Carawine Resources | 0.165 | -30% | -21% | -11% | -8% | $22,495,167.26 |
| ICL | Iceni Gold | 0.165 | 0% | -3% | -13% | -8% | $21,208,348.81 |
| DLC | Delecta Limited | 0.011 | 83% | 83% | -8% | -8% | $14,458,904.46 |
| VRC | Volt Resources Ltd | 0.0265 | 141% | -24% | 2% | -9% | $72,259,483.19 |
| AGS | Alliance Resources | 0.145 | -15% | -3% | -22% | -9% | $30,162,484.43 |
| FFX | Firefinch Ltd | 0.745 | 231% | 84% | 6% | -10% | $883,602,150.00 |
| SI6 | SI6 Metals Limited | 0.009 | -74% | -40% | 0% | -10% | $14,281,439.85 |
| SBR | Sabre Resources | 0.0045 | -57% | 13% | -10% | -10% | $7,775,161.42 |
| BRB | Breaker Res NL | 0.25 | 22% | 52% | -19% | -11% | $86,347,846.19 |
| NES | Nelson Resources. | 0.033 | -60% | -40% | 6% | -11% | $6,411,642.44 |
| ARV | Artemis Resources | 0.07 | -46% | 23% | -4% | -11% | $89,104,833.22 |
| M24 | Mamba Exploration | 0.185 | 0% | -5% | -5% | -12% | $7,078,500.54 |
| POL | Polymetals Resources | 0.135 | 0% | -13% | 4% | -13% | $5,365,264.64 |
| PRS | Prospech Limited | 0.056 | -72% | -55% | -24% | -14% | $3,650,136.28 |
| SMS | Starmineralslimited | 0.18 | 0% | 0% | -8% | -14% | $5,381,250.00 |
| FML | Focus Minerals Ltd | 0.27 | -33% | 0% | 4% | -14% | $51,169,598.20 |
| BMO | Bastion Minerals | 0.18 | 0% | 3% | -18% | -27% | $12,737,974.20 |
| AOP | Apollo Consolidated | 0 | -100% | -100% | -100% | -100% | $177,888,559.90 |
Related Topics

Related Stories


UNLOCK INSIGHTS
Discover the untold stories of emerging ASX stocks.
Daily news and expert analysis, it's free to subscribe.
By proceeding, you confirm you understand that we handle personal information in accordance with our Privacy Policy.


