Gold Digger: Silver Squeeze 2.0? Keep a level head
Here we go again. Pic: Getty Images
- As it hits a 13-year high, silver bulls online are trying to arrange a new silver squeeze
- But experts warn it’s prudent to be sceptical about co-ordinated short squeezes
- More moderate forecasters continue to be constructive on silver prices
Folk on the internet are calling for a new silver squeeze, branding March 31 as “BUY SILVER DAY”, promoting a buy up to break the so-called “price manipulation” of major financial institutions they claim suppresses the internet’s favourite metal.
One has even written a fictional anticipatory history predicting a breakdown of the world order in just days as silver hits US$1000/oz by mid-April.
In this Cormac McCarthy-esque rendering of reality, the balance of power shifts from the JPMorgans of this world to the silver stackers.
The bullion banks are husks; two have fallen, the rest cling to lifelines that might not hold. Governments raid vaults, but apes are way swifter – silver slips into private hands like a secret too big to keep. I’ve sold a few ounces to prop up a friend’s pub – loyalty cuts through the chaos – but the rest I grip tight. This isn’t just wealth; it’s a weapon. The banks ruled us; now they’re dust.
Christ, it’s freaking wild. Give it a read in case you missed your last microdose of LSD.
*This is not a vision of the future shared by Stockhead
WTF is Buy Silver Day?
#silversqueeze has been a popular community and catch phrase for precious metals investors for years on reddit and Twitter (now Elon Musk’s X).
In short, they think the metal’s price, in the doldrums for years, has been manipulated by large banks which have placed shorts on the commodity – effectively bets that allow them to profit when the price goes down.
Silver stackers claim to be accumulating the precious metal, around half of which is used in industrial applications largely thanks to a surge in solar PV production, in the hope it breaks out.
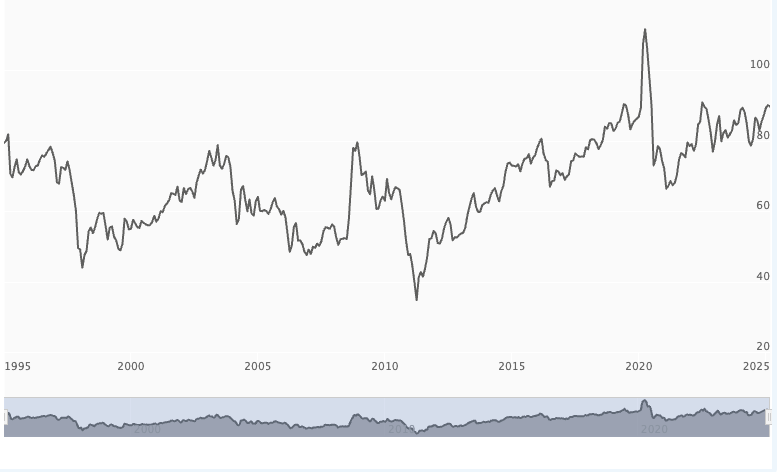
The commodity has followed its shinier cousin gold higher in the past year as investor sentiment has shifted in favour of safe haven metals. At US$33.76/oz on Wednesday, silver sat near decade long highs, but at a ratio of a 90:1 discount to the gold price, well above the 35:1 ratio seen in the last silver bull run in 2011.
But it’s gathering fresh steam on the internet of weird things ahead of March 31, which an X user called SqueakyMouse has branded as Buy Silver Day, dovetailing with the launch of a new Silver Squeeze community to coordinate a run on physical silver in an attempt to outmanouevre the banks.
March 31st, BUY SILVER Lets take back price control and break the banks. Spread the word; who’s in. #silversqueeze pic.twitter.com/bLl0hk725D
— Sqeaky Mouse (@TheSqeakyMouse) March 22, 2025
It all evokes memories of March 27, 1980 – 45 years ago yesterday – when oil barons the Hunt brothers tried and failed to corner the silver market, sending prices surging to US$50/oz (~US$180/oz adjusted for inflation) before losing big when the price collapsed and they faced a margin call.
Buy Silver Day’s facade is counter-cultural, but it’s also got a thick veneer of marketing that welcomes a sceptic’s perspective.
Experts say, be cautious
Experts say it’s important not to be sucked into the Robin Hood tropes used by promoters of short squeezes, who often stand to benefit from whipping retail investors into a frenzy.
Noah Rule’s Sean Russo, who advises companies on hedging and project finance, is long silver because the trend is positive. But he says he’s longer on gold and warned “you don’t need to believe in a conspiracy to be positive about having silver in your portfolio.”
He cautioned that movements like “Buy Silver Day” create a “sense of urgency because they want you to act”.
Instead, people should invest in assets sensibly with a long term strategy in mind. The history of past sharp silver spikes – 1980, 2010-11 and 2021 – was that they retraced as buyers piled in.
“Every parabolic market ends the same way, it retraces 80%. Unless you’re in and out very quickly you’re going to be a spotter for that run,” he said.
Wall Street Bets
The original ‘silver squeeze’ of the Covid era came when a push from reddit forum Wall Street Bets led a sharp lift in silver prices in January 2021, a follow on from other anti-establishment, anti-short movements carried out through the community like the GameStop run.
It was short-lived and prices had collapsed under US$20 by mid-2022.
Russo says a lot of that comes down to India. While the run to US$28/oz in January 2021 was modest compared to today’s US dollar silver price, in Rupee terms it was a record.
Silver stocks may not all be recorded in official ledgers, but they are plentiful. When prices surge, the temptation to melt down silverware for profit or sell to trade up to gold is strong.
Indian market participants sold into the domestic record price, levels which have been hit again in India in this year’s run.
“During Covid, the Reddit crowd, convinced the banksters were short silver, tried to ramp #silvertothemoon but got it to 28 USD/oz. On the other side of the world, that buying was presenting Indians, that were not getting government stimmy checks, with local silver prices around all-time record highs of 2000 INR/oz,” Russo reminded clients in a note last April.
“Ironically, perhaps the reason silver is not rising is because retail in the US (including the Reddit crowd), is happy to sell because they are finally back at break even after 3 years. There are plenty of stories of dis-hoarding and retail sales in the US. Might silver go to the moon and leave many of them behind in Mom and Pop’s basement?” he added elsewhere in the note at the time.
Some large investors have spread extraordinarily bullish silver cases. Eric Sprott, the billionaire founder of the asset manager named after him which runs a prominent silver ETF, recently told Kitco at the PDAC conference he could see the logic in arguments silver could get to US$250 or US$500/oz (well above even the inflation adjusted highs of the Hunt Brothers squeeze), repeating an argument that the silver:gold ratio could go to 15:1, closer to their proportional production rates.
In that scenario gold could get to US$8000-10,000/oz. A boy can dream.
Many mainstream analysts are also long silver, but are substantially more moderate in their projections.
Long silver
Capital Economics revised its target this year to an “above consensus” US$35/oz for 2025, upping 2026 levels to US$38/oz.
Melbourne fund manager Roscoe Widdup’s T8 Capital, which holds positions in silver equities in both its gold and energy vision portfolios, last year suggested in a note it could run to US$50/oz within 1-2 years, a forecast Widdup said remains in tact.
But its logic is far more fundamental than conspiratorial, centred on the presence of large deficits and growing demand from a dramatic expansion in Chinese solar PV production.
While the silver market isn’t as liquid as gold – Widdup estimates it would around a tenth of the size of the US$230bn a day gold market – he said its scale made it relatively efficient in enabling price discovery compared to equities and the retail market. Squeezes are more likely to occur in silver than gold, given the smaller size of the market and the access of retail investors to physical-backed ETFs, Widdup noted.
But that doesn’t mean a price spike will persist.
“If you get a spike, it will only be a spike for a short time because at some point supply which is not mine supply will enter the market,” Widdup said.
Nor is there evidence of institutional price manipulation.
Russo says many short positions are being held to hedge against positions elsewhere.
“That’s just beyond most of their understanding and some guy who runs a silver thing that sells silver coins at a premium whips them up into a fever that they’re going to stick it to the man, they’re going to be like a guy in the Big Short,” he said of Reddit led silver squeeze marketing.
Average breakeven points for pure silver miners, most of them Canadian listed, were around US$27/oz in 2024, though a large portion of primary silver supply comes as a by-product of gold, copper and base metals mining.
Silver moved beyond US$34/oz on Thursday night, trading around 13 year highs, while gold surged in the direction of US$3060/oz, hitting a new record after markets digested Donald Trump’s declaration of 25% tariffs on foreign made autos.
Trump recently couched some of his language on the April 2 reciprocal tariffs, as he looked to arrest market negativity that has pulled US stocks from record highs and lit up recession fears for the world’s largest economy.
Still, safe haven buying and central bank purchasing has powered unprecedented demand for bullion.
Winners & Losers
Here’s how ASX-listed precious metals stocks are performing:
| CODE | COMPANY | PRICE | WEEK % | MONTH % | 6 MONTH % | YEAR % | YTD % | MARKET CAP |
|---|---|---|---|---|---|---|---|---|
| MRR | Minrex Resources Ltd | 0.008 | 0% | 0% | 0% | -41% | 14% | $ 8,678,940.02 |
| NPM | Newpeak Metals | 0.014 | -7% | 0% | -7% | 43% | 27% | $ 4,186,932.50 |
| ASO | Aston Minerals Ltd | 0.019 | 0% | 12% | 36% | 46% | 111% | $ 24,606,221.11 |
| MTC | Metalstech Ltd | 0.11 | 0% | -15% | -33% | -29% | -21% | $ 22,717,040.55 |
| GED | Golden Deeps | 0.0195 | -7% | -19% | -49% | -60% | -22% | $ 2,926,424.63 |
| G88 | Golden Mile Res Ltd | 0.009 | 0% | -18% | -10% | -25% | 0% | $ 4,898,230.70 |
| LAT | Latitude 66 Limited | 0.07 | 8% | -5% | -48% | -65% | 84% | $ 9,321,045.83 |
| NMR | Native Mineral Res | 0.087 | 13% | 16% | 314% | 263% | 123% | $ 62,370,500.50 |
| AQX | Alice Queen Ltd | 0.0055 | -15% | -31% | -31% | 10% | -31% | $ 6,307,895.37 |
| SLZ | Sultan Resources Ltd | 0.008 | 14% | -11% | 33% | -33% | 33% | $ 1,851,759.28 |
| KSN | Kingston Resources | 0.09 | 7% | 15% | 5% | 4% | 27% | $ 72,332,031.46 |
| AMI | Aurelia Metals Ltd | 0.255 | 0% | 21% | 50% | 70% | 50% | $ 431,606,023.20 |
| GIB | Gibb River Diamonds | 0.0385 | -8% | 10% | -4% | 48% | -4% | $ 7,936,849.47 |
| KCN | Kingsgate Consolid. | 1.535 | 3% | 15% | 11% | 32% | 19% | $ 382,761,262.62 |
| TMX | Terrain Minerals | 0.003 | -25% | -25% | -25% | -25% | 0% | $ 6,010,669.80 |
| BNR | Bulletin Res Ltd | 0.042 | 0% | -7% | -13% | -33% | 8% | $ 12,038,146.24 |
| NXM | Nexus Minerals Ltd | 0.07 | -4% | 9% | 52% | 46% | 56% | $ 35,139,263.54 |
| SKY | SKY Metals Ltd | 0.051 | 2% | -4% | 28% | 55% | -6% | $ 35,535,158.30 |
| LM8 | Lunnonmetalslimited | 0.22 | 5% | 5% | 38% | -20% | -12% | $ 47,435,057.41 |
| CST | Castile Resources | 0.073 | -4% | 18% | -4% | 3% | -9% | $ 22,319,646.34 |
| YRL | Yandal Resources | 0.15 | 0% | -19% | 67% | 67% | -14% | $ 49,477,597.12 |
| FAU | First Au Ltd | 0.002 | -20% | 0% | 0% | 0% | 0% | $ 5,179,983.19 |
| ARL | Ardea Resources Ltd | 0.435 | 5% | -6% | 7% | -40% | 32% | $ 83,866,824.30 |
| GWR | GWR Group Ltd | 0.083 | -10% | -13% | -1% | -17% | 4% | $ 26,660,982.37 |
| IVR | Investigator Res Ltd | 0.025 | 4% | 9% | -31% | -39% | 25% | $ 36,544,230.20 |
| GTR | Gti Energy Ltd | 0.003 | 20% | 0% | -33% | -57% | -14% | $ 8,996,848.99 |
| IPT | Impact Minerals | 0.006 | 0% | -29% | -53% | -55% | -36% | $ 18,583,246.55 |
| BNZ | Benzmining | 0.39 | 0% | -7% | 105% | 179% | 13% | $ 49,094,405.52 |
| MOH | Moho Resources | 0.004 | 33% | 0% | -43% | -20% | -20% | $ 2,923,498.30 |
| BCM | Brazilian Critical | 0.008 | 0% | -20% | -33% | -62% | -11% | $ 8,503,668.70 |
| PUA | Peak Minerals Ltd | 0.011 | 10% | 10% | 467% | 356% | 42% | $ 33,687,855.48 |
| MRZ | Mont Royal Resources | 0.041 | 0% | 0% | -23% | -41% | -5% | $ 3,486,221.51 |
| SMS | Starmineralslimited | 0.03 | 11% | 0% | -36% | -13% | -17% | $ 3,946,972.98 |
| MVL | Marvel Gold Limited | 0.012 | 20% | 9% | 9% | 20% | 33% | $ 11,877,122.17 |
| PRX | Prodigy Gold NL | 0.002 | 0% | 0% | 0% | -44% | 0% | $ 6,350,111.10 |
| AAU | Antilles Gold Ltd | 0.004 | -11% | -20% | 0% | -80% | 33% | $ 8,481,504.23 |
| CWX | Carawine Resources | 0.099 | -6% | 3% | 5% | -8% | -1% | $ 23,376,419.45 |
| RND | Rand Mining Ltd | 1.765 | 7% | 4% | -1% | 29% | 17% | $ 100,386,071.17 |
| CAZ | Cazaly Resources | 0.015 | 7% | 0% | 0% | -21% | 7% | $ 6,919,544.87 |
| BMR | Ballymore Resources | 0.125 | -7% | 14% | -11% | 0% | 4% | $ 22,091,323.13 |
| DRE | Dreadnought Resources Ltd | 0.013 | -19% | -24% | -19% | -24% | 8% | $ 62,388,000.00 |
| ZNC | Zenith Minerals Ltd | 0.052 | 2% | 24% | 21% | -43% | 30% | $ 21,186,953.94 |
| REZ | Resourc & En Grp Ltd | 0.019 | -14% | -27% | -24% | 58% | -17% | $ 13,432,782.44 |
| LEX | Lefroy Exploration | 0.085 | -8% | -6% | 12% | -13% | 21% | $ 21,115,711.73 |
| ERM | Emmerson Resources | 0.15 | 15% | 25% | 233% | 206% | 95% | $ 88,986,643.06 |
| AM7 | Arcadia Minerals | 0.02 | 0% | 0% | -43% | -71% | 5% | $ 2,347,668.66 |
| ADT | Adriatic Metals | 4.62 | 2% | 8% | 29% | 16% | 18% | $ 1,397,280,617.60 |
| AS1 | Asara Resources Ltd | 0.041 | 21% | 21% | 173% | 356% | 116% | $ 44,047,113.92 |
| CYL | Catalyst Metals | 5.51 | 20% | 31% | 98% | 754% | 114% | $ 1,215,888,306.72 |
| CHN | Chalice Mining Ltd | 1.21 | -17% | -21% | -19% | 20% | 10% | $ 517,405,628.04 |
| KAL | Kalgoorliegoldmining | 0.07 | 11% | 3% | 192% | 192% | 289% | $ 24,984,059.40 |
| MLS | Metals Australia | 0.021 | 5% | 5% | -13% | -9% | -9% | $ 13,845,670.96 |
| ADN | Andromeda Metals Ltd | 0.008 | 14% | 14% | 0% | -65% | 14% | $ 24,001,093.82 |
| MEI | Meteoric Resources | 0.07 | -5% | 0% | -39% | -71% | -18% | $ 158,906,669.18 |
| SRN | Surefire Rescs NL | 0.003 | -14% | 0% | -57% | -73% | -14% | $ 7,248,923.44 |
| WA8 | Warriedarresourltd | 0.064 | 0% | 36% | 5% | 45% | 45% | $ 59,252,284.56 |
| HMX | Hammer Metals Ltd | 0.028 | -10% | -10% | -24% | -24% | -15% | $ 25,745,002.30 |
| WCN | White Cliff Min Ltd | 0.017 | -6% | -6% | -11% | 13% | 6% | $ 32,223,002.72 |
| AVM | Advance Metals Ltd | 0.048 | 0% | 9% | 100% | 37% | 41% | $ 9,343,702.48 |
| ASR | Asra Minerals Ltd | 0.0035 | 17% | 17% | -30% | -30% | 17% | $ 8,305,943.90 |
| ARI | Arika Resources | 0.021 | 0% | -43% | -28% | 5% | -22% | $ 13,620,435.72 |
| CTO | Citigold Corp Ltd | 0.004 | 0% | 14% | 33% | 0% | 0% | $ 12,000,000.00 |
| SMI | Santana Minerals Ltd | 0.59 | 0% | 4% | -24% | 43% | 22% | $ 411,949,644.75 |
| M2R | Miramar | 0.004 | 0% | 33% | -43% | -76% | 33% | $ 1,825,387.11 |
| MHC | Manhattan Corp Ltd | 0.018 | 0% | -10% | -40% | -57% | -5% | $ 4,228,180.16 |
| GRL | Godolphin Resources | 0.012 | -14% | -25% | -8% | -67% | -17% | $ 4,309,183.80 |
| SVG | Savannah Goldfields | 0.017 | 21% | 6% | -7% | -25% | -7% | $ 10,906,809.66 |
| EMC | Everest Metals Corp | 0.17 | 0% | -3% | 36% | 113% | 26% | $ 38,043,252.12 |
| GUL | Gullewa Limited | 0.048 | -13% | -14% | -26% | -13% | -14% | $ 10,465,064.26 |
| CY5 | Cygnus Metals Ltd | 0.11 | -8% | -12% | 38% | 112% | 10% | $ 89,169,325.46 |
| G50 | G50Corp Ltd | 0.15 | 0% | 11% | -14% | 11% | -3% | $ 23,286,660.56 |
| ADV | Ardiden Ltd | 0.14 | 0% | -7% | 0% | -15% | 4% | $ 8,127,275.78 |
| AAR | Astral Resources NL | 0.16 | 0% | 19% | 52% | 167% | 19% | $ 220,421,744.00 |
| VMC | Venus Metals Cor Ltd | 0.11 | 5% | 39% | 80% | 0% | 64% | $ 21,574,155.13 |
| NAE | New Age Exploration | 0.005 | 11% | 25% | -17% | 25% | 43% | $ 11,967,295.10 |
| VKA | Viking Mines Ltd | 0.007 | -22% | -13% | 0% | -30% | -13% | $ 10,625,178.56 |
| LCL | LCL Resources Ltd | 0.008 | 14% | -11% | -20% | -33% | -20% | $ 8,363,688.95 |
| MTH | Mithril Silver Gold | 0.425 | 6% | 27% | -30% | 113% | 6% | $ 56,847,773.58 |
| ADG | Adelong Gold Limited | 0.005 | -9% | -17% | 25% | 25% | 11% | $ 6,987,430.99 |
| RMX | Red Mount Min Ltd | 0.008 | -11% | -11% | -20% | -54% | -11% | $ 3,719,662.37 |
| PRS | Prospech Limited | 0.023 | 0% | -15% | -36% | -45% | -21% | $ 7,562,995.40 |
| TTM | Titan Minerals | 0.445 | 7% | 2% | 1% | 59% | 17% | $ 109,237,934.82 |
| AKA | Aureka Limited | 0.155 | 0% | 3% | -98% | -98% | 15% | $ 16,901,757.84 |
| AAM | Aumegametals | 0.043 | -7% | 8% | -4% | -4% | 2% | $ 25,372,747.76 |
| KZR | Kalamazoo Resources | 0.08 | -1% | 3% | 1% | -14% | 8% | $ 16,332,694.33 |
| BCN | Beacon Minerals | 0.027 | 4% | 8% | 17% | 17% | 23% | $ 111,998,651.09 |
| MAU | Magnetic Resources | 1.505 | 0% | 11% | 10% | 56% | 36% | $ 392,138,890.50 |
| BC8 | Black Cat Syndicate | 0.94 | 12% | 10% | 104% | 370% | 66% | $ 525,629,474.30 |
| EM2 | Eagle Mountain | 0.006 | 20% | -25% | -87% | -87% | -33% | $ 6,810,223.73 |
| EMR | Emerald Res NL | 3.82 | -8% | -4% | -5% | 31% | 18% | $ 2,484,518,090.04 |
| BYH | Bryah Resources Ltd | 0.004 | 0% | 0% | 0% | -64% | 33% | $ 2,507,202.91 |
| HCH | Hot Chili Ltd | 0.66 | -3% | -11% | -22% | -38% | -6% | $ 107,633,265.79 |
| WAF | West African Res Ltd | 2.39 | 4% | 36% | 34% | 104% | 67% | $ 2,610,088,972.76 |
| MEU | Marmota Limited | 0.042 | -11% | -19% | 15% | -5% | 8% | $ 49,488,843.18 |
| NVA | Nova Minerals Ltd | 0.295 | -9% | 2% | 119% | 18% | -20% | $ 99,812,999.27 |
| SVL | Silver Mines Limited | 0.11 | 5% | 36% | 17% | -33% | 41% | $ 177,977,539.20 |
| PGD | Peregrine Gold | 0.19 | 27% | 65% | -5% | -10% | 36% | $ 13,906,194.75 |
| ICL | Iceni Gold | 0.078 | -1% | -3% | 100% | 225% | 10% | $ 24,322,952.84 |
| FG1 | Flynngold | 0.026 | 18% | 0% | -16% | -42% | 4% | $ 8,030,531.75 |
| WWI | West Wits Mining Ltd | 0.018 | -5% | 0% | 29% | 20% | 29% | $ 49,877,217.74 |
| RML | Resolution Minerals | 0.0095 | 0% | 19% | -41% | -53% | -21% | $ 4,723,899.88 |
| AAJ | Aruma Resources Ltd | 0.011 | -15% | 10% | -35% | -35% | -8% | $ 2,442,639.89 |
| HWK | Hawk Resources. | 0.023 | 0% | -8% | -23% | -48% | 5% | $ 6,231,377.33 |
| GMN | Gold Mountain Ltd | 0.002 | 0% | 0% | -33% | -50% | -33% | $ 9,158,446.37 |
| MEG | Megado Minerals Ltd | 0.015 | 25% | 0% | -2% | 57% | -12% | $ 6,295,248.93 |
| HMG | Hamelingoldlimited | 0.078 | 0% | 42% | 15% | 8% | 22% | $ 12,648,000.00 |
| BM8 | Battery Age Minerals | 0.064 | 7% | -4% | -39% | -39% | -39% | $ 7,505,243.36 |
| TBR | Tribune Res Ltd | 4.6 | -3% | -5% | -7% | 24% | 7% | $ 241,877,834.97 |
| FML | Focus Minerals Ltd | 0.205 | -2% | 3% | 52% | 11% | 21% | $ 58,744,522.23 |
| VRC | Volt Resources Ltd | 0.005 | 25% | 25% | 25% | -9% | 67% | $ 21,081,500.92 |
| ARV | Artemis Resources | 0.009 | 13% | 13% | -31% | -47% | 13% | $ 22,756,763.77 |
| HRN | Horizon Gold Ltd | 0.4175 | 1% | 3% | 13% | 61% | -13% | $ 61,556,967.28 |
| CLA | Celsius Resource Ltd | 0.007 | -13% | -36% | -42% | -50% | -36% | $ 20,352,998.40 |
| QML | Qmines Limited | 0.045 | 2% | 2% | -53% | -36% | -17% | $ 18,871,726.98 |
| RDN | Raiden Resources Ltd | 0.0055 | 10% | 10% | -88% | -77% | -50% | $ 18,979,902.93 |
| TCG | Turaco Gold Limited | 0.395 | 10% | 16% | 22% | 132% | 55% | $ 315,833,511.35 |
| KCC | Kincora Copper | 0.023 | -8% | -15% | -47% | -45% | -15% | $ 5,302,345.82 |
| GBZ | GBM Rsources Ltd | 0.008 | 0% | 14% | -11% | -11% | 0% | $ 9,368,559.82 |
| DTM | Dart Mining NL | 0.005 | 0% | 0% | -71% | -68% | -44% | $ 3,438,819.57 |
| MKR | Manuka Resources. | 0.026 | -19% | -10% | -26% | -66% | -7% | $ 21,890,727.06 |
| AUC | Ausgold Limited | 0.56 | 3% | 24% | 12% | 75% | 33% | $ 196,138,141.10 |
| ANX | Anax Metals Ltd | 0.008 | -11% | -16% | -67% | -62% | -33% | $ 7,062,460.54 |
| EMU | EMU NL | 0.035 | 21% | 13% | 52% | 27% | 30% | $ 5,420,839.45 |
| SFM | Santa Fe Minerals | 0.04 | -2% | -2% | 14% | -11% | 29% | $ 2,912,751.56 |
| SSR | SSR Mining Inc. | 17.7 | 1% | 5% | 101% | 188% | 62% | $ 60,070,248.00 |
| PNR | Pantoro Limited | 0.165 | 0% | 18% | 43% | 170% | 83% | $ 1,086,410,097.47 |
| CMM | Capricorn Metals | 8.15 | -1% | 3% | 38% | 59% | 30% | $ 3,441,549,399.10 |
| X64 | Ten Sixty Four Ltd | 0 | -100% | -100% | -100% | -100% | -100% | $ 129,844,903.32 |
| VRL | Verity Resources | 0.018 | 38% | 20% | -10% | -70% | -10% | $ 3,318,130.10 |
| HAW | Hawthorn Resources | 0.052 | 21% | 16% | -16% | -26% | 27% | $ 17,755,827.49 |
| BGD | Bartongoldholdings | 0.335 | 5% | 8% | 43% | 31% | 37% | $ 70,042,600.64 |
| SVY | Stavely Minerals Ltd | 0.017 | 0% | -11% | -41% | -43% | 0% | $ 8,704,673.49 |
| AGC | AGC Ltd | 0.195 | 8% | 18% | -24% | 179% | 26% | $ 48,753,472.18 |
| RGL | Riversgold | 0.004 | 0% | -20% | -20% | -43% | 0% | $ 6,734,850.37 |
| TSO | Tesoro Gold Ltd | 0.03 | -3% | -3% | -19% | -3% | 50% | $ 49,709,249.31 |
| GUE | Global Uranium | 0.065 | -2% | -12% | -6% | -35% | 8% | $ 19,451,486.60 |
| CPM | Coopermetalslimited | 0.039 | 0% | -11% | -28% | -63% | -15% | $ 3,055,870.35 |
| MM8 | Medallion Metals. | 0.23 | 28% | 35% | 342% | 290% | 92% | $ 102,229,891.41 |
| FFM | Firefly Metals Ltd | 1.03 | -5% | -1% | -3% | 51% | 11% | $ 561,843,587.39 |
| CBY | Canterbury Resources | 0.024 | 0% | -4% | -29% | -33% | 9% | $ 4,738,581.50 |
| SLA | Solara Minerals | 0.12 | -4% | -14% | -61% | -29% | 33% | $ 6,668,254.65 |
| SFR | Sandfire Resources | 10.8 | -6% | 0% | 1% | 25% | 16% | $ 5,123,737,005.81 |
| SMG | Silvermetalgroupltd | 0 | -100% | -100% | -100% | -100% | -100% | $ 4,881,135.48 |
| TAM | Tanami Gold NL | 0.029 | 4% | 0% | -15% | -12% | -3% | $ 34,077,814.33 |
| NWM | Norwest Minerals | 0.01 | 0% | -17% | -55% | -64% | -29% | $ 4,851,195.10 |
| ALK | Alkane Resources Ltd | 0.67 | 6% | 6% | 43% | 16% | 31% | $ 393,602,229.80 |
| BMO | Bastion Minerals | 0.004 | 0% | 0% | -43% | -50% | 0% | $ 3,378,898.66 |
| IDA | Indiana Resources | 0.078 | 1% | 7% | 44% | 84% | 28% | $ 50,133,131.72 |
| GSM | Golden State Mining | 0.009 | 0% | 13% | -25% | -10% | 13% | $ 2,514,335.67 |
| NSM | Northstaw | 0.039 | -17% | 30% | 105% | 8% | 144% | $ 9,816,354.00 |
| GSN | Great Southern | 0.024 | 0% | 0% | 33% | 20% | 60% | $ 22,926,498.67 |
| VAU | Vault Minerals Ltd | 0.46 | -1% | 15% | 33% | 26% | 39% | $ 3,027,100,654.99 |
| DEG | De Grey Mining | 2.17 | 1% | 7% | 57% | 80% | 23% | $ 4,987,997,772.16 |
| THR | Thor Energy PLC | 0.013 | -7% | 0% | -19% | -46% | 0% | $ 8,505,478.02 |
| CDR | Codrus Minerals Ltd | 0.017 | 6% | 0% | -15% | -59% | 0% | $ 2,811,587.57 |
| MDI | Middle Island Res | 0.018 | 6% | 6% | 13% | 13% | 50% | $ 4,684,105.80 |
| WTM | Waratah Minerals Ltd | 0.18 | 3% | 20% | -36% | 125% | 16% | $ 35,417,812.33 |
| POL | Polymetals Resources | 0.89 | 7% | 31% | 162% | 224% | 12% | $ 206,842,301.10 |
| RDS | Redstone Resources | 0.003 | -14% | 0% | 0% | -25% | 20% | $ 2,776,135.38 |
| NAG | Nagambie Resources | 0.02 | 25% | 18% | 25% | 54% | 11% | $ 14,459,442.19 |
| BGL | Bellevue Gold Ltd | 1.145 | -15% | -4% | -13% | -38% | 2% | $ 1,469,907,307.95 |
| GBR | Greatbould Resources | 0.074 | 7% | -3% | 32% | 35% | 72% | $ 51,618,822.71 |
| KAI | Kairos Minerals Ltd | 0.022 | 0% | 16% | 76% | 76% | 83% | $ 49,987,331.59 |
| KAU | Kaiser Reef | 0.16 | -6% | -6% | -3% | 7% | 0% | $ 41,697,689.60 |
| HRZ | Horizon | 0.063 | -5% | 2% | 31% | 85% | 58% | $ 136,974,437.63 |
| CDT | Castle Minerals | 0.003 | 50% | 0% | 0% | -57% | 50% | $ 5,783,468.64 |
| RSG | Resolute Mining | 0.47 | 6% | 27% | -39% | 21% | 19% | $ 990,008,256.05 |
| MXR | Maximus Resources | 0.08 | 4% | 29% | 95% | 192% | 38% | $ 31,254,313.75 |
| EVN | Evolution Mining Ltd | 7.2 | 5% | 14% | 54% | 105% | 50% | $ 13,865,718,897.80 |
| CXU | Cauldron Energy Ltd | 0.009 | -18% | -18% | -60% | -76% | -25% | $ 13,152,641.48 |
| DLI | Delta Lithium | 0.175 | 0% | 3% | -27% | -39% | 3% | $ 128,977,522.56 |
| ALY | Alchemy Resource Ltd | 0.007 | 0% | -13% | 0% | 17% | 0% | $ 8,246,533.79 |
| NH3 | Nh3Cleanenergyltd | 0.023 | 5% | 5% | 10% | -12% | 28% | $ 14,115,119.63 |
| OBM | Ora Banda Mining Ltd | 1.13 | 1% | 22% | 75% | 319% | 74% | $ 1,986,971,840.71 |
| AVW | Avira Resources Ltd | 0.008 | -11% | -27% | -60% | -60% | -60% | $ 1,175,517.95 |
| LCY | Legacy Iron Ore | 0.011 | 10% | 22% | -12% | -24% | 10% | $ 107,382,468.42 |
| PDI | Predictive Disc Ltd | 0.395 | 7% | 14% | 46% | 76% | 72% | $ 966,504,468.80 |
| MAT | Matsa Resources | 0.055 | -8% | -8% | 57% | 83% | 57% | $ 41,772,618.04 |
| ZAG | Zuleika Gold Ltd | 0.012 | 0% | 9% | -14% | -29% | -8% | $ 8,902,559.12 |
| GML | Gateway Mining | 0.022 | 5% | 10% | -4% | -8% | 5% | $ 8,994,046.49 |
| SBM | St Barbara Limited | 0.25 | 11% | 9% | -29% | 52% | 11% | $ 259,883,121.84 |
| SBR | Sabre Resources | 0.007 | 0% | -13% | -56% | -61% | -30% | $ 2,947,214.50 |
| STK | Strickland Metals | 0.1 | 11% | 49% | 3% | 11% | 18% | $ 176,593,179.36 |
| CEL | Challenger Gold Ltd | 0.061 | 0% | 9% | 13% | -24% | 30% | $ 99,576,641.18 |
| GG8 | Gorilla Gold Mines | 0.475 | 19% | 83% | 197% | 1026% | 83% | $ 266,586,081.60 |
| NST | Northern Star | 18.63 | 2% | 6% | 15% | 31% | 21% | $ 20,530,490,952.66 |
| OZM | Ozaurum Resources | 0.067 | 18% | -1% | 76% | 43% | 123% | $ 14,500,919.87 |
| TG1 | Techgen Metals Ltd | 0.03 | 0% | 3% | -9% | 0% | -14% | $ 4,759,971.30 |
| XAM | Xanadu Mines Ltd | 0.051 | -2% | 4% | -16% | -12% | 4% | $ 99,434,272.91 |
| AQI | Alicanto Min Ltd | 0.034 | 6% | -3% | 26% | 61% | -8% | $ 27,988,718.21 |
| KTA | Krakatoa Resources | 0.009 | 0% | -10% | -25% | 13% | -5% | $ 5,581,206.23 |
| ARN | Aldoro Resources | 0.37 | 21% | -17% | 387% | 429% | -3% | $ 66,529,569.38 |
| WGX | Westgold Resources. | 2.92 | -1% | 17% | 7% | 15% | 3% | $ 2,706,724,810.30 |
| MBK | Metal Bank Ltd | 0.016 | -11% | 14% | -19% | -26% | 7% | $ 7,959,343.97 |
| A8G | Australasian Metals | 0.075 | 0% | 1% | -32% | 25% | -5% | $ 4,341,729.38 |
| TAR | Taruga Minerals | 0.008 | 0% | -11% | -11% | 33% | -20% | $ 6,354,241.07 |
| DTR | Dateline Resources | 0.005 | 25% | 67% | -17% | -64% | 43% | $ 12,827,843.10 |
| GOR | Gold Road Res Ltd | 2.93 | 19% | 16% | 68% | 88% | 43% | $ 3,179,519,107.65 |
| S2R | S2 Resources | 0.089 | 48% | 44% | 11% | -35% | 33% | $ 35,322,923.45 |
| NES | Nelson Resources. | 0.003 | 0% | 0% | 0% | -14% | 0% | $ 6,515,782.98 |
| TLM | Talisman Mining | 0.165 | -8% | -3% | -37% | -33% | -20% | $ 31,072,857.59 |
| BEZ | Besragoldinc | 0.045 | -17% | 10% | -46% | -57% | -50% | $ 18,697,002.80 |
| PRU | Perseus Mining Ltd | 3.34 | 5% | 11% | 25% | 60% | 30% | $ 4,445,877,873.96 |
| SPQ | Superior Resources | 0.006 | 0% | 0% | -25% | -33% | 0% | $ 15,189,046.59 |
| PUR | Pursuit Minerals | 0.052 | -31% | -26% | -65% | -74% | -46% | $ 4,293,499.34 |
| RMS | Ramelius Resources | 2.47 | 13% | -10% | 9% | 37% | 19% | $ 2,668,772,166.06 |
| PKO | Peako Limited | 0.004 | 33% | 33% | 0% | 30% | 33% | $ 4,463,225.88 |
| ICG | Inca Minerals Ltd | 0.006 | 20% | 20% | 20% | 20% | 20% | $ 6,160,335.20 |
| A1G | African Gold Ltd. | 0.12 | 74% | 79% | 173% | 302% | 118% | $ 41,986,672.20 |
| NMG | New Murchison Gold | 0.017 | 6% | 70% | 113% | 183% | 89% | $ 145,587,599.72 |
| GNM | Great Northern | 0.015 | 7% | -12% | 0% | 15% | 7% | $ 2,319,436.16 |
| KRM | Kingsrose Mining Ltd | 0.035 | -8% | -5% | 0% | 9% | 0% | $ 25,619,901.65 |
| BTR | Brightstar Resources | 0.019 | -5% | -5% | 12% | 27% | -5% | $ 216,717,145.83 |
| RRL | Regis Resources | 3.9 | 7% | 19% | 91% | 101% | 53% | $ 2,817,931,947.82 |
| M24 | Mamba Exploration | 0.013 | -7% | -7% | 8% | -46% | 8% | $ 3,837,152.93 |
| TRM | Truscott Mining Corp | 0.072 | -1% | 3% | 0% | 39% | -8% | $ 13,784,296.32 |
| TNC | True North Copper | 0.335 | -9% | -12% | -91% | -95% | -89% | $ 40,268,485.12 |
| MOM | Moab Minerals Ltd | 0.001 | -50% | -33% | -75% | -80% | -50% | $ 1,733,666.03 |
| KNB | Koonenberrygold | 0.045 | 25% | 41% | 350% | 137% | 275% | $ 36,697,211.62 |
| AWJ | Auric Mining | 0.275 | 0% | -5% | -25% | 62% | -19% | $ 40,962,177.03 |
| ENR | Encounter Resources | 0.225 | -4% | -6% | -51% | -4% | -31% | $ 114,722,233.37 |
| SNG | Siren Gold | 0.054 | 0% | -8% | -25% | 0% | -17% | $ 11,386,471.67 |
| STN | Saturn Metals | 0.26 | -5% | 24% | -19% | 44% | 27% | $ 80,310,069.84 |
| USL | Unico Silver Limited | 0.27 | 15% | 42% | 23% | 125% | 38% | $ 111,675,657.53 |
| PNM | Pacific Nickel Mines | 0.024 | 0% | 0% | 0% | -29% | 0% | $ 10,103,834.52 |
| AYM | Australia United Min | 0.002 | 0% | -33% | 0% | -50% | -50% | $ 3,685,154.97 |
| ANL | Amani Gold Ltd | 0 | -100% | -100% | -100% | -100% | -100% | $ 21,449,587.12 |
| HAV | Havilah Resources | 0.195 | 3% | 0% | -3% | 18% | -13% | $ 66,154,977.72 |
| SPR | Spartan Resources | 1.94 | 11% | 48% | 41% | 210% | 38% | $ 2,337,688,767.40 |
| PNT | Panthermetalsltd | 0.015 | -6% | 0% | -32% | -39% | 36% | $ 4,212,663.67 |
| MEK | Meeka Metals Limited | 0.15 | 3% | 15% | 134% | 317% | 95% | $ 351,493,473.80 |
| GMD | Genesis Minerals | 3.72 | 3% | 15% | 73% | 106% | 51% | $ 4,202,456,955.60 |
| PGO | Pacgold | 0.067 | -7% | 6% | -36% | -54% | -11% | $ 8,544,531.97 |
| FEG | Far East Gold | 0.145 | -3% | -9% | -12% | 4% | -19% | $ 51,383,843.42 |
| MI6 | Minerals260Limited | 0.13 | 0% | 0% | 0% | -16% | 0% | $ 30,420,000.00 |
| IGO | IGO Limited | 4.2 | -3% | 0% | -26% | -39% | -12% | $ 3,165,379,458.34 |
| GAL | Galileo Mining Ltd | 0.125 | -11% | -19% | -22% | -53% | 0% | $ 24,703,115.88 |
| ERW | Errawarra Resources | 0.06 | 122% | 107% | -40% | 58% | 20% | $ 5,840,000.00 |
| RXL | Rox Resources | 0.34 | 5% | 42% | 152% | 121% | 70% | $ 200,613,093.12 |
| PTN | Patronus Resources | 0.077 | 28% | 22% | 45% | 28% | 57% | $ 109,705,652.87 |
| CLZ | Classic Min Ltd | 0.001 | 0% | 0% | 0% | -94% | 0% | $ 1,544,025.56 |
| TGM | Theta Gold Mines Ltd | 0.15 | 0% | -6% | -12% | -9% | -17% | $ 131,661,437.03 |
| FAL | Falconmetalsltd | 0.135 | -7% | 23% | -29% | 8% | 17% | $ 23,010,000.00 |
| SPD | Southernpalladium | 0.41 | -2% | -5% | -11% | 24% | -32% | $ 37,289,500.00 |
| ORN | Orion Minerals Ltd | 0.017 | 6% | 21% | 0% | 21% | 13% | $ 123,308,060.72 |
| TMB | Tambourahmetals | 0.032 | -3% | 14% | -15% | -58% | 52% | $ 3,762,881.47 |
| TMS | Tennant Minerals Ltd | 0.012 | -20% | -14% | -17% | -56% | 33% | $ 13,382,465.81 |
| AZY | Antipa Minerals Ltd | 0.475 | 8% | 30% | 90% | 265% | 83% | $ 263,829,063.92 |
| PXX | Polarx Limited | 0.008 | 0% | 14% | -11% | -38% | 23% | $ 19,004,007.82 |
| TRE | Toubani Res Ltd | 0.225 | 25% | 55% | -29% | 61% | 32% | $ 48,081,591.39 |
| AUN | Aurumin | 0.062 | -3% | -8% | 35% | 82% | -6% | $ 30,644,128.93 |
| GPR | Geopacific Resources | 0.022 | -2% | 10% | -6% | 19% | 10% | $ 70,014,237.17 |
| FXG | Felix Gold Limited | 0.165 | -3% | 27% | 38% | 416% | 96% | $ 54,269,553.69 |
| ILT | Iltani Resources Lim | 0.22 | -8% | -14% | -4% | 47% | 7% | $ 9,982,720.35 |
| BRX | Belararoxlimited | 0.3 | 150% | 122% | 22% | 13% | 71% | $ 43,909,054.47 |
| TM1 | Terra Metals Limited | 0.02 | 0% | -26% | -49% | -64% | -29% | $ 8,152,701.24 |
| TOR | Torque Met | 0.099 | -6% | 0% | 19% | -27% | 87% | $ 26,966,392.60 |
| ARD | Argent Minerals | 0.026 | 4% | 44% | 44% | 136% | 53% | $ 34,695,371.52 |
| LM1 | Leeuwin Metals Ltd | 0.15 | 43% | 25% | 79% | 100% | 7% | $ 10,537,464.50 |
| SX2 | Southgold Consol | 4.96 | 18% | 41% | 0% | 0% | 0% | $ 622,453,085.80 |
Among the biggest winners of the past week was a (newly branded) silver stock, Errawarra Resources (ASX:ERW).
Tom Reddicliffe chaired Errawarra has acquired a package in the Pilbara which includes the historic Elizabeth Hill mine, which closed in 2000 due to low silver prices and from which 1.2Moz of silver was produced from 16,000t of ore at a head grade of 2194g/t Ag in only one year of production.
ERW, which is to be renamed West Coast Silver (ASX:WCE) subject to shareholder approval, is the first explorer to consolidate the additional highly prospective underexplored areas for silver mineralisation.
Read more about it here.
The views, information, or opinions expressed in the interviews in this article are solely those of the interviewees and do not represent the views of Stockhead.
Stockhead does not provide, endorse or otherwise assume responsibility for any financial product advice contained in this article.
At Stockhead, we tell it like it is. While Errawarra Resources is a Stockhead advertiser, it did not sponsor this article.
Related Topics
Related Stories

UNLOCK INSIGHTS
Discover the untold stories of emerging ASX stocks.
Daily news and expert analysis, it's free to subscribe.
By proceeding, you confirm you understand that we handle personal information in accordance with our Privacy Policy.


