Gold Digger: Silver is ‘flashing a strong buy signal’, experts say

Pic: Vasilisa_k, iStock / Getty Images Plus
- Since reaching its peak in the summer of 2020, silver has fallen ~35%
- Smart money is going net long on silver, speculators almost net short; a good sign for silver outlook say Goehring & Rozencwajg
- This week’s top ASX precious metals stocks: African Gold, GBM Resources
Our Gold Digger column wraps all the news driving ASX stocks with exposure to precious metals.
Since reaching its peak in the summer of 2020, the silver price has fallen ~35%.
The good news? The next bull market is approaching, say resources investors Goehring & Rozencwajg.
“Precious metals have now been through almost two years of corrective price action, and it has paid handsomely to have minimal exposure over the last two years,” they say.
“However, given that we are strong believers that huge gold and silver bull markets sit directly in front of us, we are carefully monitoring both markets for strong buy signals.”
One of those buy signals for silver is now flashing green, they say.
Watch the COMEX futures market
A precious metal ‘buy or sell’ signal investors should keep an eye on is the behaviour exhibited by traders in the COMEX futures market, Goehring & Rozencwajg say.
The Commodity Exchange, or COMEX, is the primary futures and options market for trading metals such as gold, silver, copper and aluminum.
(Futures = financial contract obligating the buyer and seller to exchange an asset at a predetermined future date and set price. Options = contract giving the buyer the right, but not the obligation, to buy [or sell] an asset at a specific price at any time during the life of the contract.)
Over the last 20 years, several significant buy signals have been given when commercial gold and silver traders positioned themselves net ‘long’ (believe prices will rise) and speculative traders went net ‘short’ (believe prices will fall).
Commercials (those who use the futures markets to hedge various commercial needs) represent the smart money.
Speculators (hedge funds, algorithmic traders, and other trend-followers) represent the dumb money.
Follow the smart money, Goehring & Rozencwajg say.
“Whenever smart money goes net long and dumb money goes net short, that often coincides with a significant bottom in precious metals,” they say.
“It doesn’t happen very often, but when it does, there is a significant buying opportunity.”
Is a silver bull market approaching?
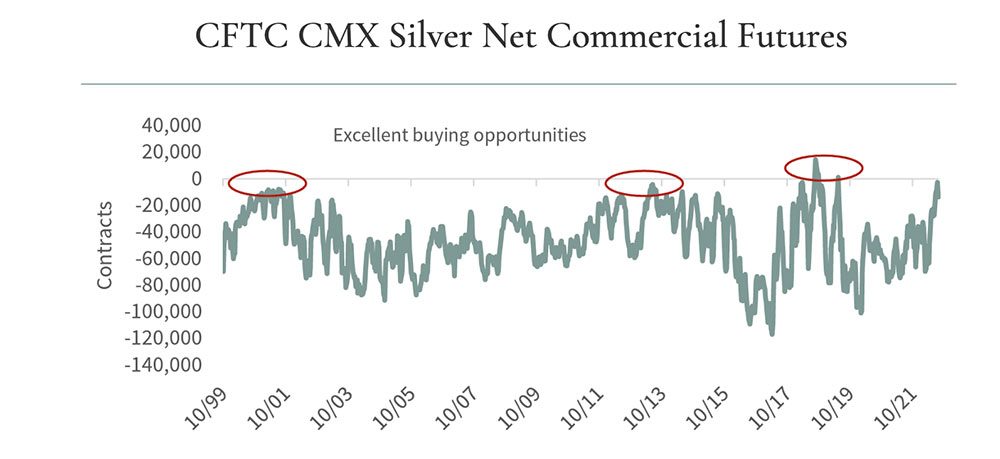
While the positioning of commercial and speculative gold futures is not anywhere close to flashing a buy signal, silver is.
“As you can see from the chart below, commercials have slashed their net short position by almost 90% over the last three months,” Goehring & Rozencwajg say.
“And just as silver commercial players are on the verge of becoming net long, speculators are on their verge of going net short — a sign that the two-year corrective phase in silver is coming to a close.”
Winners & Losers
Here’s how ASX-listed precious metals stocks are performing:
Scroll or swipe to reveal table. Click headings to sort. Best viewed on a laptop.
Stocks missing from this list? Email [email protected]
| CODE | COMPANY | 1 WEEK RETURN% | 1 MONTH RETURN % | 6 MONTH RETURN % | 1 YEAR RETURN % | PRICE | MARKET CAP |
|---|---|---|---|---|---|---|---|
| A1G | African Gold Ltd. | 103% | 63% | -16% | -42% | 0.13 | $14,926,291 |
| ANL | Amani Gold Ltd | 100% | 33% | 33% | 0% | 0.002 | $47,386,882 |
| NWM | Norwest Minerals | 61% | 18% | -25% | -42% | 0.045 | $9,772,725 |
| ALY | Alchemy Resource Ltd | 35% | 84% | 3% | 169% | 0.035 | $43,403,821 |
| GBZ | GBM Rsources Ltd | 34% | 41% | -52% | -62% | 0.055 | $30,839,264 |
| MBK | Metal Bank Ltd | 33% | 0% | -33% | -53% | 0.004 | $10,460,991 |
| QML | Qmines Limited | 29% | 48% | -29% | -45% | 0.2 | $15,190,818 |
| CST | Castile Resources | 28% | 14% | -25% | -54% | 0.12 | $29,028,291 |
| NMR | Native Mineral Res | 25% | 3% | -27% | -41% | 0.15 | $7,042,942 |
| AQX | Alice Queen Ltd | 25% | 0% | -69% | -77% | 0.0025 | $5,500,625 |
| SIH | Sihayo Gold Limited | 25% | -17% | -17% | -72% | 0.0025 | $15,255,320 |
| BRB | Breaker Res NL | 24% | 46% | 10% | -10% | 0.285 | $92,864,665 |
| PRS | Prospech Limited | 21% | 3% | -39% | -62% | 0.034 | $2,216,154 |
| BBX | BBX Minerals Ltd | 20% | -10% | -48% | -65% | 0.06 | $29,203,289 |
| RXL | Rox Resources | 18% | -12% | -44% | -41% | 0.225 | $34,632,894 |
| RMS | Ramelius Resources | 17% | 16% | -52% | -55% | 0.71 | $619,330,366 |
| TMX | Terrain Minerals | 17% | 0% | -33% | -22% | 0.007 | $5,325,327 |
| DRE | Dreadnought Resources Ltd | 17% | 17% | 192% | 210% | 0.1225 | $380,316,694 |
| GMN | Gold Mountain Ltd | 17% | -22% | 0% | -65% | 0.007 | $8,898,895 |
| ENR | Encounter Resources | 17% | 8% | -13% | -33% | 0.14 | $47,401,980 |
| E2M | E2 Metals | 16% | 4% | -33% | -38% | 0.145 | $28,874,187 |
| GOR | Gold Road Res Ltd | 14% | 19% | -9% | 4% | 1.4025 | $1,538,583,186 |
| ADV | Ardiden Ltd | 14% | 0% | -41% | -27% | 0.008 | $18,678,347 |
| ALK | Alkane Resources Ltd | 13% | 6% | -30% | -20% | 0.715 | $434,124,629 |
| HMX | Hammer Metals Ltd | 13% | 26% | -41% | -2% | 0.059 | $49,203,555 |
| ADT | Adriatic Metals | 13% | 23% | 1% | -15% | 2.48 | $537,022,668 |
| STK | Strickland Metals | 13% | 27% | -28% | -42% | 0.052 | $79,159,814 |
| BNR | Bulletin Res Ltd | 13% | 13% | -37% | 80% | 0.135 | $40,962,754 |
| PRU | Perseus Mining Ltd | 12% | 31% | -3% | 12% | 1.825 | $2,573,383,531 |
| GSR | Greenstone Resources | 12% | -55% | -13% | 17% | 0.028 | $27,939,053 |
| ARN | Aldoro Resources | 12% | 30% | 2% | -46% | 0.28 | $30,964,449 |
| NST | Northern Star | 12% | 24% | -9% | -6% | 8.83 | $10,352,523,710 |
| PNX | PNX Metals Limited | 11% | 0% | 0% | -26% | 0.005 | $22,220,289 |
| MZZ | Matador Mining Ltd | 11% | 0% | -54% | -73% | 0.11 | $29,633,621 |
| BAT | Battery Minerals Ltd | 11% | 11% | -44% | -62% | 0.005 | $13,163,591 |
| BNZ | Benzmining | 11% | 12% | -27% | -30% | 0.505 | $36,285,466 |
| IDA | Indiana Resources | 11% | -5% | -10% | 5% | 0.061 | $29,512,094 |
| EVN | Evolution Mining Ltd | 11% | 11% | -49% | -44% | 2.05 | $3,816,621,401 |
| YRL | Yandal Resources | 10% | -24% | -56% | -73% | 0.11 | $14,878,404 |
| SBM | St Barbara Limited | 10% | -26% | -62% | -65% | 0.505 | $424,341,655 |
| RED | Red 5 Limited | 10% | -17% | -56% | -35% | 0.17 | $475,385,548 |
| AUC | Ausgold Limited | 10% | 15% | -37% | 2% | 0.046 | $93,355,829 |
| KCN | Kingsgate Consolid. | 9% | 6% | 15% | -3% | 1.675 | $378,457,975 |
| RSG | Resolute Mining | 9% | -1% | -37% | -53% | 0.2025 | $237,407,164 |
| TG1 | Techgen Metals Ltd | 9% | -20% | -8% | -38% | 0.12 | $6,569,875 |
| CMM | Capricorn Metals | 9% | 28% | -16% | 35% | 3.4 | $1,286,302,636 |
| GSN | Great Southern | 9% | 48% | -16% | -29% | 0.049 | $28,424,430 |
| SVL | Silver Mines Limited | 9% | 16% | -16% | -14% | 0.185 | $245,448,107 |
| DEG | De Grey Mining | 9% | 13% | -9% | -2% | 1.07 | $1,702,579,486 |
| SFR | Sandfire Resources | 9% | -5% | -32% | -38% | 3.56 | $1,505,366,501 |
| LM8 | Lunnonmetalslimited | 8% | -4% | -30% | 73% | 0.77 | $84,604,618 |
| RND | Rand Mining Ltd | 8% | 3% | 0% | -2% | 1.55 | $88,157,740 |
| MEI | Meteoric Resources | 8% | -7% | -13% | -28% | 0.013 | $19,841,866 |
| KZR | Kalamazoo Resources | 8% | -1% | -52% | -47% | 0.195 | $29,019,778 |
| PNT | Panthermetalsltd | 8% | -5% | -17% | 0% | 0.195 | $5,947,500 |
| MKR | Manuka Resources. | 8% | -4% | -52% | -63% | 0.135 | $38,612,751 |
| BGL | Bellevue Gold Ltd | 8% | 7% | -19% | -14% | 0.745 | $806,596,063 |
| SVG | Savannah Goldfields | 7% | -8% | 10% | 15% | 0.22 | $37,421,656 |
| AWV | Anova Metals Ltd | 7% | 7% | 15% | -32% | 0.015 | $23,971,413 |
| KAI | Kairos Minerals Ltd | 7% | -12% | 3% | 0% | 0.03 | $56,958,711 |
| GTR | Gti Energy Ltd | 7% | -6% | -20% | -48% | 0.016 | $24,087,737 |
| HXG | Hexagon Energy | 7% | 3% | -56% | -82% | 0.016 | $8,206,654 |
| KIN | KIN Min NL | 7% | 19% | -11% | -33% | 0.08 | $83,881,721 |
| AAU | Antilles Gold Ltd | 7% | 9% | -25% | -36% | 0.049 | $19,541,861 |
| HRN | Horizon Gold Ltd | 6% | -7% | -20% | -26% | 0.33 | $41,309,942 |
| NML | Navarre Minerals Ltd | 6% | 16% | -41% | -44% | 0.05 | $69,737,139 |
| LYN | Lycaonresources | 6% | -21% | -39% | 0% | 0.25 | $7,979,688 |
| ADG | Adelong Gold Limited | 6% | -15% | -76% | -79% | 0.0085 | $3,767,089 |
| KAU | Kaiser Reef | 6% | 19% | -10% | -18% | 0.185 | $23,410,289 |
| WWI | West Wits Mining Ltd | 6% | 27% | -39% | -53% | 0.019 | $38,190,716 |
| TMZ | Thomson Res Ltd | 6% | -10% | -55% | -79% | 0.019 | $15,320,971 |
| RRL | Regis Resources | 6% | 9% | -26% | -25% | 1.52 | $1,177,840,443 |
| HCH | Hot Chili Ltd | 5% | 15% | -38% | -59% | 0.985 | $118,250,754 |
| SLZ | Sultan Resources Ltd | 5% | 14% | -35% | -44% | 0.1 | $8,328,439 |
| REZ | Resourc & En Grp Ltd | 5% | 0% | -55% | -57% | 0.02 | $9,996,116 |
| WCN | White Cliff Min Ltd | 5% | 5% | -31% | 33% | 0.02 | $15,699,671 |
| POL | Polymetals Resources | 5% | 29% | 74% | 48% | 0.2 | $8,236,538 |
| NCM | Newcrest Mining | 5% | 10% | -34% | -29% | 17.68 | $16,024,199,178 |
| HAV | Havilah Resources | 5% | 7% | 77% | 68% | 0.31 | $94,991,763 |
| SSR | SSR Mining Inc. | 5% | 8% | -26% | 1% | 21.92 | $398,768,210 |
| KTA | Krakatoa Resources | 5% | 7% | -47% | 5% | 0.064 | $22,406,145 |
| AMI | Aurelia Metals Ltd | 5% | -41% | -74% | -70% | 0.115 | $148,492,466 |
| GMD | Genesis Minerals | 4% | 30% | -18% | -5% | 1.17 | $473,297,126 |
| AUT | Auteco Minerals | 4% | 27% | -37% | -41% | 0.047 | $101,323,979 |
| GAL | Galileo Mining Ltd | 4% | 0% | 462% | 402% | 1.18 | $236,889,912 |
| IGO | IGO Limited | 4% | 16% | 25% | 65% | 16.25 | $12,351,038,030 |
| M24 | Mamba Exploration | 4% | 4% | -4% | -38% | 0.125 | $5,271,875 |
| WAF | West African Res Ltd | 4% | 4% | -21% | -27% | 1.025 | $1,113,002,142 |
| KNB | Koonenberrygold | 4% | -1% | -21% | -55% | 0.079 | $5,984,759 |
| KSN | Kingston Resources | 4% | -2% | -53% | -62% | 0.08 | $33,071,730 |
| KRM | Kingsrose Mining Ltd | 4% | 4% | -28% | -10% | 0.054 | $40,636,432 |
| VMC | Venus Metals Cor Ltd | 4% | -6% | -22% | -24% | 0.145 | $24,011,802 |
| FML | Focus Minerals Ltd | 4% | 12% | -38% | -49% | 0.145 | $40,118,210 |
| CAZ | Cazaly Resources | 3% | -15% | -18% | -30% | 0.031 | $12,237,119 |
| AM7 | Arcadia Minerals | 3% | 5% | 2% | 63% | 0.31 | $14,476,347 |
| CPM | Coopermetalslimited | 3% | 6% | -19% | 0% | 0.35 | $13,132,000 |
| EM2 | Eagle Mountain | 3% | -19% | -46% | -73% | 0.19 | $50,970,362 |
| VAN | Vango Mining Ltd | 3% | 0% | -27% | -35% | 0.04 | $50,397,505 |
| FEG | Far East Gold | 2% | 5% | 79% | 0% | 0.68 | $82,985,303 |
| MGV | Musgrave Minerals | 2% | -4% | -30% | -41% | 0.23 | $121,628,914 |
| TIE | Tietto Minerals | 2% | 55% | 45% | 74% | 0.705 | $755,669,243 |
| TBR | Tribune Res Ltd | 2% | -6% | -29% | -32% | 3.34 | $175,243,377 |
| IVR | Investigator Res Ltd | 2% | 7% | -23% | -35% | 0.048 | $63,951,056 |
| GIB | Gibb River Diamonds | 2% | 2% | -10% | -32% | 0.056 | $11,844,529 |
| AZS | Azure Minerals | 2% | 60% | -15% | -36% | 0.28 | $87,006,002 |
| GWR | GWR Group Ltd | 2% | -23% | -60% | -56% | 0.064 | $20,557,866 |
| BC8 | Black Cat Syndicate | 2% | 5% | -40% | -43% | 0.325 | $65,268,223 |
| NVA | Nova Minerals Ltd | 1% | -1% | 0% | -55% | 0.7 | $126,726,280 |
| PNM | Pacific Nickel Mines | 1% | -19% | -35% | -42% | 0.072 | $25,799,719 |
| WGX | Westgold Resources. | 1% | 3% | -50% | -60% | 0.775 | $383,634,411 |
| NAG | Nagambie Resources | 1% | 5% | 67% | 7% | 0.08 | $42,293,715 |
| AGG | AngloGold Ashanti | 1% | 11% | -28% | -18% | 4.1 | $359,507,293 |
| NPM | Newpeak Metals | 0% | 0% | 0% | 0% | 0.001 | $8,853,750 |
| FFX | Firefinch Ltd | 0% | 0% | -42% | -8% | 0.2 | $236,248,644 |
| MKG | Mako Gold | 0% | -20% | -51% | -59% | 0.041 | $19,472,312 |
| IPT | Impact Minerals | 0% | 0% | -44% | -48% | 0.007 | $17,369,594 |
| MOH | Moho Resources | 0% | -21% | -55% | -62% | 0.023 | $4,776,231 |
| PUA | Peak Minerals Ltd | 0% | -25% | -63% | -63% | 0.006 | $6,248,225 |
| MRZ | Mont Royal Resources | 0% | -16% | -42% | -53% | 0.19 | $12,736,831 |
| PRX | Prodigy Gold NL | 0% | 22% | -46% | -63% | 0.011 | $19,226,711 |
| CWX | Carawine Resources | 0% | -9% | -59% | -57% | 0.086 | $11,853,754 |
| LEX | Lefroy Exploration | 0% | -3% | -6% | -36% | 0.29 | $41,574,280 |
| KAL | Kalgoorliegoldmining | 0% | -13% | -25% | 0% | 0.105 | $7,605,633 |
| SRN | Surefire Rescs NL | 0% | -7% | -64% | -10% | 0.013 | $20,557,725 |
| MCT | Metalicity Limited | 0% | 0% | -36% | -54% | 0.004 | $13,968,157 |
| CTO | Citigold Corp Ltd | 0% | 0% | -29% | -40% | 0.006 | $17,001,955 |
| MHC | Manhattan Corp Ltd | 0% | -13% | -46% | -46% | 0.007 | $12,210,230 |
| TRY | Troy Resources Ltd | 0% | 0% | 0% | 0% | 0.0295 | $62,920,961 |
| CGN | Crater Gold Min Ltd | 0% | 0% | 0% | 0% | 0.017 | $21,063,474 |
| TSC | Twenty Seven Co. Ltd | 0% | 0% | -29% | -43% | 0.002 | $10,643,256 |
| GUL | Gullewa Limited | 0% | 3% | -23% | -23% | 0.062 | $11,835,992 |
| G50 | Gold50Limited | 0% | -14% | -49% | -50% | 0.12 | $6,833,160 |
| VKA | Viking Mines Ltd | 0% | 14% | -33% | -60% | 0.008 | $8,202,067 |
| LCL | Los Cerros Limited | 0% | -21% | -75% | -84% | 0.023 | $15,615,573 |
| MTH | Mithril Resources | 0% | 0% | -44% | -64% | 0.005 | $14,701,165 |
| XTC | Xantippe Res Ltd | 0% | -22% | -50% | 75% | 0.007 | $57,016,609 |
| BCN | Beacon Minerals | 0% | 0% | -29% | -27% | 0.024 | $90,162,436 |
| FG1 | Flynngold | 0% | -8% | -27% | -31% | 0.11 | $7,046,716 |
| TBA | Tombola Gold Ltd | 0% | -3% | -38% | -15% | 0.033 | $36,033,120 |
| PF1 | Pathfinder Resources | 0% | 0% | 0% | 56% | 0.5 | $26,560,505 |
| CLA | Celsius Resource Ltd | 0% | -13% | -43% | -55% | 0.013 | $19,536,778 |
| RDN | Raiden Resources Ltd | 0% | -6% | -52% | -65% | 0.008 | $14,691,979 |
| SFM | Santa Fe Minerals | 0% | 2% | -28% | 9% | 0.087 | $6,335,235 |
| OKR | Okapi Resources | 0% | -2% | -25% | -59% | 0.23 | $31,466,801 |
| CBY | Canterbury Resources | 0% | 5% | -27% | -58% | 0.044 | $5,897,035 |
| WMC | Wiluna Mining Corp | 0% | 0% | -68% | -77% | 0.205 | $74,238,031 |
| GBR | Greatbould Resources | 0% | -3% | -11% | -46% | 0.089 | $37,212,751 |
| HRZ | Horizon | 0% | -19% | -54% | -56% | 0.055 | $34,177,831 |
| CXU | Cauldron Energy Ltd | 0% | -23% | -33% | -63% | 0.01 | $5,354,113 |
| OBM | Ora Banda Mining Ltd | 0% | 51% | 95% | -3% | 0.08 | $111,419,739 |
| PDI | Predictive Disc Ltd | 0% | 0% | -15% | 0% | 0.175 | $281,935,754 |
| MAT | Matsa Resources | 0% | 6% | -40% | -37% | 0.038 | $15,650,476 |
| ZAG | Zuleika Gold Ltd | 0% | -5% | -40% | -18% | 0.018 | $9,387,911 |
| LRL | Labyrinth Resources | 0% | -10% | -51% | -49% | 0.019 | $16,593,968 |
| S2R | S2 Resources | 0% | 4% | -13% | 59% | 0.135 | $48,151,105 |
| TLM | Talisman Mining | 0% | 0% | -18% | 0% | 0.14 | $25,344,832 |
| SPQ | Superior Resources | 0% | -10% | 10% | 246% | 0.045 | $76,554,919 |
| PUR | Pursuit Minerals | 0% | -4% | -59% | -68% | 0.012 | $11,978,150 |
| GNM | Great Northern | 0% | -11% | -27% | -50% | 0.004 | $6,836,204 |
| DEX | Duke Exploration | 0% | 10% | -65% | -71% | 0.053 | $4,781,191 |
| MOM | Moab Minerals Ltd | 0% | -20% | -56% | -68% | 0.012 | $8,183,562 |
| AYM | Australia United Min | 0% | -20% | -33% | -64% | 0.004 | $7,370,310 |
| GCY | Gascoyne Res Ltd | 0% | -10% | -17% | -53% | 0.225 | $95,857,932 |
| CLZ | Classic Min Ltd | 0% | 0% | -88% | -88% | 0.017 | $7,640,830 |
| CHN | Chalice Mining Ltd | 0% | 17% | -33% | -35% | 4.33 | $1,644,418,738 |
| SLR | Silver Lake Resource | 0% | 8% | -44% | -33% | 1.115 | $1,129,639,365 |
| CY5 | Cygnus Gold Limited | -1% | 92% | 188% | 241% | 0.46 | $75,178,404 |
| ERM | Emmerson Resources | -1% | 7% | -27% | -1% | 0.08 | $43,576,783 |
| EMR | Emerald Res NL | -1% | 0% | -5% | 13% | 1.1 | $652,851,081 |
| DTR | Dateline Resources | -1% | -17% | -48% | -22% | 0.07 | $39,345,622 |
| MI6 | Minerals260Limited | -2% | 20% | -34% | -36% | 0.305 | $66,000,000 |
| X64 | Ten Sixty Four Ltd | -2% | 1% | -29% | -20% | 0.6 | $137,035,981 |
| ZNC | Zenith Minerals Ltd | -2% | 5% | -31% | 28% | 0.295 | $98,257,250 |
| XAM | Xanadu Mines Ltd | -2% | 2% | -19% | -2% | 0.0285 | $40,249,416 |
| RDT | Red Dirt Metals Ltd | -2% | -12% | 0% | -21% | 0.53 | $176,346,453 |
| AAJ | Aruma Resources Ltd | -2% | 21% | -29% | -20% | 0.07 | $10,987,305 |
| SMS | Starmineralslimited | -2% | -3% | -58% | -60% | 0.085 | $2,514,300 |
| MRR | Minrex Resources Ltd | -2% | -9% | -37% | 121% | 0.042 | $45,495,070 |
| MLS | Metals Australia | -2% | -9% | -76% | 0% | 0.04 | $24,281,448 |
| TAM | Tanami Gold NL | -2% | -5% | -33% | -44% | 0.04 | $47,003,882 |
| GMR | Golden Rim Resources | -3% | -9% | -43% | -57% | 0.039 | $12,242,622 |
| OZM | Ozaurum Resources | -3% | -18% | -46% | -48% | 0.078 | $5,507,564 |
| AME | Alto Metals Limited | -3% | 10% | -18% | -29% | 0.075 | $40,090,313 |
| AQI | Alicanto Min Ltd | -3% | -18% | -65% | -77% | 0.034 | $13,616,249 |
| TRM | Truscott Mining Corp | -3% | -14% | -33% | 3% | 0.034 | $5,367,598 |
| AGC | AGC Ltd | -3% | -6% | -34% | -45% | 0.066 | $4,470,001 |
| SMI | Santana Minerals Ltd | -3% | -4% | -14% | 160% | 0.65 | $95,964,237 |
| KWR | Kingwest Resources | -3% | -20% | -84% | -75% | 0.032 | $9,015,258 |
| ANX | Anax Metals Ltd | -3% | -5% | -48% | -43% | 0.057 | $23,120,805 |
| DCN | Dacian Gold Ltd | -3% | 89% | -39% | -44% | 0.14 | $164,268,127 |
| BGD | Bartongoldholdings | -3% | 4% | -39% | -20% | 0.14 | $12,034,291 |
| GRL | Godolphin Resources | -4% | -8% | -42% | -46% | 0.081 | $9,587,925 |
| MTC | Metalstech Ltd | -4% | -8% | 63% | 7% | 0.39 | $65,960,540 |
| G88 | Golden Mile Res Ltd | -4% | -19% | -61% | -47% | 0.026 | $5,319,334 |
| WRM | White Rock Min Ltd | -4% | 10% | -61% | -77% | 0.078 | $15,046,679 |
| STN | Saturn Metals | -4% | 4% | -32% | -37% | 0.26 | $33,773,786 |
| RVR | Red River Resources | -4% | -17% | -69% | -67% | 0.073 | $37,847,908 |
| SKY | SKY Metals Ltd | -4% | -4% | -52% | -51% | 0.048 | $18,085,607 |
| BYH | Bryah Resources Ltd | -4% | -4% | -60% | -55% | 0.024 | $6,702,083 |
| MEU | Marmota Limited | -4% | -2% | -8% | 2% | 0.045 | $49,763,627 |
| RGL | Riversgold | -4% | 22% | -35% | 94% | 0.044 | $34,157,246 |
| PGO | Pacgold | -5% | -9% | -41% | 30% | 0.42 | $23,083,962 |
| ADN | Andromeda Metals Ltd | -5% | -11% | -59% | -77% | 0.041 | $124,400,337 |
| MEK | Meeka Metals Limited | -5% | -2% | 30% | 33% | 0.06 | $63,506,536 |
| AWJ | Auric Mining | -5% | -6% | -16% | -45% | 0.072 | $5,506,816 |
| ARL | Ardea Resources Ltd | -5% | 2% | -43% | 85% | 0.89 | $151,915,306 |
| CAI | Calidus Resources | -5% | -33% | -65% | -42% | 0.345 | $148,845,780 |
| ASO | Aston Minerals Ltd | -6% | 4% | -48% | -40% | 0.075 | $83,514,820 |
| BMO | Bastion Minerals | -6% | -30% | -67% | -75% | 0.064 | $6,169,579 |
| THR | Thor Mining PLC | -6% | -11% | -47% | -53% | 0.008 | $8,814,388 |
| HMG | Hamelingoldlimited | -6% | 15% | -3% | 0% | 0.15 | $16,500,000 |
| KCC | Kincora Copper | -6% | -12% | -40% | -57% | 0.06 | $4,438,007 |
| CYL | Catalyst Metals | -6% | -3% | -36% | -45% | 1.17 | $115,193,693 |
| TTM | Titan Minerals | -7% | 9% | -25% | -41% | 0.071 | $94,555,303 |
| TCG | Turaco Gold Limited | -7% | -18% | -58% | -71% | 0.042 | $17,964,100 |
| HAW | Hawthorn Resources | -7% | -7% | -48% | 58% | 0.084 | $28,015,311 |
| SVY | Stavely Minerals Ltd | -7% | -10% | -64% | -70% | 0.14 | $45,213,652 |
| MXR | Maximus Resources | -7% | -7% | -54% | -51% | 0.042 | $13,394,042 |
| GSM | Golden State Mining | -7% | -26% | -55% | -66% | 0.034 | $3,978,483 |
| CHZ | Chesser Resources | -7% | -13% | -43% | -55% | 0.068 | $39,992,371 |
| GED | Golden Deeps | -7% | -7% | -19% | 8% | 0.013 | $15,017,947 |
| NSM | Northstaw | -7% | -7% | -55% | -57% | 0.13 | $15,015,875 |
| CDR | Codrus Minerals Ltd | -7% | -17% | -29% | -54% | 0.065 | $2,600,000 |
| AXE | Archer Materials | -7% | -4% | -17% | -52% | 0.715 | $178,896,389 |
| SNG | Siren Gold | -8% | 3% | -52% | -50% | 0.185 | $21,631,213 |
| ASR | Asra Minerals Ltd | -8% | -4% | -11% | -20% | 0.024 | $35,142,277 |
| ICL | Iceni Gold | -8% | -29% | -56% | -73% | 0.071 | $9,101,946 |
| AAR | Astral Resources NL | -8% | -25% | -36% | -29% | 0.058 | $38,593,779 |
| MDI | Middle Island Res | -8% | -14% | -59% | -42% | 0.058 | $7,100,257 |
| M2R | Miramar | -8% | 1% | -53% | -47% | 0.092 | $6,502,720 |
| CDT | Castle Minerals | -8% | -12% | -56% | 28% | 0.023 | $23,987,832 |
| NXM | Nexus Minerals Ltd | -8% | -8% | -48% | -63% | 0.165 | $52,544,796 |
| TGM | Theta Gold Mines Ltd | -9% | 12% | -44% | -62% | 0.075 | $46,358,144 |
| CEL | Challenger Exp Ltd | -9% | -11% | -52% | -44% | 0.155 | $161,961,244 |
| TAR | Taruga Minerals | -9% | 11% | 55% | -33% | 0.031 | $18,011,830 |
| RMX | Red Mount Min Ltd | -9% | 0% | -50% | -50% | 0.005 | $8,211,819 |
| SI6 | SI6 Metals Limited | -9% | -29% | -50% | -58% | 0.005 | $8,929,134 |
| SBR | Sabre Resources | -9% | 0% | -9% | 0% | 0.005 | $14,574,280 |
| SAU | Southern Gold | -9% | -3% | -41% | -61% | 0.029 | $7,253,178 |
| BMR | Ballymore Resources | -10% | 0% | 3% | -21% | 0.19 | $13,960,835 |
| MAU | Magnetic Resources | -10% | 4% | -42% | -50% | 0.83 | $189,628,023 |
| FAU | First Au Ltd | -10% | -25% | -69% | -59% | 0.0045 | $4,657,055 |
| MEG | Megado Minerals Ltd | -10% | -10% | -52% | -24% | 0.072 | $7,851,513 |
| LCY | Legacy Iron Ore | -10% | -5% | -31% | 29% | 0.018 | $115,322,872 |
| GML | Gateway Mining | -10% | -18% | -40% | -60% | 0.072 | $16,272,789 |
| BTR | Brightstar Resources | -10% | -18% | -36% | -65% | 0.018 | $12,176,957 |
| MM8 | Medallion Metals. | -11% | 3% | -35% | -13% | 0.17 | $23,792,360 |
| PKO | Peako Limited | -11% | -20% | -11% | -27% | 0.016 | $6,066,911 |
| MVL | Marvel Gold Limited | -13% | -19% | -54% | -70% | 0.021 | $16,203,371 |
| NAE | New Age Exploration | -13% | -22% | -46% | -36% | 0.007 | $10,051,292 |
| RDS | Redstone Resources | -13% | 0% | -30% | -50% | 0.007 | $5,157,827 |
| OAU | Ora Gold Limited | -13% | -22% | -56% | -51% | 0.007 | $7,873,850 |
| TUL | Tulla Resources | -14% | -14% | -37% | -25% | 0.38 | $61,683,496 |
| VRC | Volt Resources Ltd | -14% | 4% | 14% | -17% | 0.025 | $79,695,931 |
| DCX | Discovex Res Ltd | -14% | -25% | -61% | -37% | 0.003 | $9,907,704 |
| AVM | Advance Metals Ltd | -14% | 9% | -25% | -29% | 0.012 | $5,734,529 |
| AVW | Avira Resources Ltd | -14% | -25% | -50% | -54% | 0.003 | $6,401,370 |
| A8G | Australasian Metals | -15% | -19% | -50% | -65% | 0.235 | $9,880,919 |
| PNR | Pantoro Limited | -15% | -9% | -53% | -34% | 0.145 | $228,557,971 |
| TSO | Tesoro Gold Ltd | -15% | 6% | -56% | -62% | 0.034 | $31,391,308 |
| EMU | EMU NL | -17% | -38% | -74% | -82% | 0.005 | $4,123,609 |
| ICG | Inca Minerals Ltd | -17% | -26% | -70% | -78% | 0.029 | $14,943,948 |
| ARV | Artemis Resources | -18% | -32% | -48% | -68% | 0.032 | $41,742,551 |
| BEZ | Besragoldinc | -20% | 5% | -25% | -72% | 0.041 | $10,336,663 |
| AL8 | Alderan Resource Ltd | -20% | -11% | -67% | -81% | 0.008 | $4,626,129 |
| RML | Resolution Minerals | -23% | 0% | -33% | -50% | 0.01 | $11,657,208 |
| NES | Nelson Resources. | -25% | -36% | -59% | -77% | 0.007 | $2,060,080 |
| PGD | Peregrine Gold | -28% | -26% | -12% | 9% | 0.43 | $15,875,838 |
| DTM | Dart Mining NL | -29% | -18% | -18% | -45% | 0.06 | $9,936,650 |
Small Cap Standouts
AFRICAN GOLD (ASX:A1G)
$14m market cap A1G Had an absolute belter this week after Barry ‘Midas Touch’ FitzGerald gave them a boost in his latest Stockhead column.
A1G has a large and underexplored gold system on its hands in Côte d’Ivoire with the potential for multi-million ounces, all for a $10m market cap, he says.
“That the stock is just above its 52-week low shows just how tough things are for the gold explorers because recent exploration news from A1G’s Didievi gold project deserves some attention,” he said when the stock was trading at 8.2c.
“Early in the week the company reported another batch of high-grade gold hits from both the Blaffo Gueto and Pranoi prospects at Didievi (10m at 123g/t from 66m, and 12m at 5.6g/t up from 24m respectively).
“More to the point, an independent review of the results has allowed the company to release a compliant ‘Exploration Target’ of 600,000ozs to 1.9mozs depending on the cut-off grade used in the calculation.”
GBM RESOURCES (ASX:GBZ)
Another good week for GBZ, which recently inked a $25m farm in agreement with gold giant Newcrest (ASX:NCM) over GBZ’s 330,000oz Mount Coolon project in the Drummond Basin of QLD.
NCM can acquire up to 75% of Mount Coolon by spending up to $25m and completing a series of exploration milestones – including 23,000m of drilling – over six years.
The deal frees up GBZ to focus its efforts (and money) on the nearby Twin Hills and Yandan gold projects, which have a combined resource of ~1.38Moz.
GBZ purchased Mount Coolon in February 2015 from DGO (recently acquired by Gold Road Resources) for $850,000 cash and 50m shares.
It has done some drilling since then but believes “a well-credentialed partner in Newcrest” is required to give the project a red-hot go.
Related Stories


UNLOCK INSIGHTS
Discover the untold stories of emerging ASX stocks.
Daily news and expert analysis, it's free to subscribe.
By proceeding, you confirm you understand that we handle personal information in accordance with our Privacy Policy.


