Gold Digger: Silver demand expected to fall in 2025 … but experts say the bull thesis remains intact
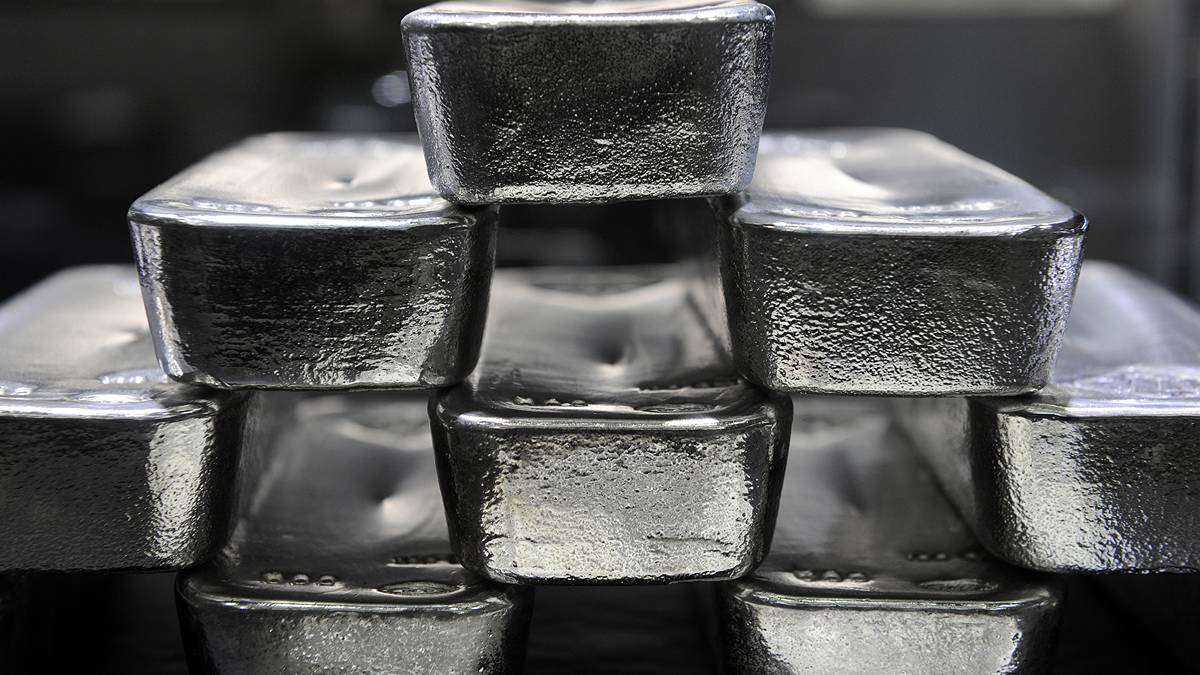
With a fifth straight deficit in 2025, even a drop in demand is doing little to dull experts' optimism in silver. Pic: Getty Images
- The Silver Institute says silver demand is actually expected to fall 4% this year, despite record prices
- Industrial demand has reduced, but that doesn’t mean we won’t see silver sail higher
- Set-up remains good for 2026 with a fifth straight deficit due in 2025 and stagnant mine supply
It’s been a watershed year for silver, and the once derided ‘silver stackers’ who’ve been baying loudly on sub-reddits and twitter communities for a life-changing short squeeze.
We had a short-lived physical squeeze in October, briefly pushing prices to a peak of US$54.48/oz.
Nominally that’s the highest on record, though prices have since retraced to US$49.50/oz, a mere 62.5% higher in the past 12 months.
Not too bad really. It may surprise you to learn that demand for silver is actually on track to fall this year.
And that’s not the end of the world for bulls.
In a note this week, Metals Focus analysts reviwed Silver Institute forecasts that silver demand is projected to fall 4% this year, with industrial offtake easing 2% from the successive all time highs set in the previous three years.
“For much of the year, industrial demand has been constrained by a challenging economic backdrop, driven by uncertainty over US tariffs and slowing global economic growth. Soaring metal prices have also weighed on industrial activity,” Metals Focus says.
“In the photovoltaic (PV) sector, for example, elevated silver prices have created significant cost pressure, prompting manufacturers to accelerate thrifting and substitution. As a result, despite continued growth in PV installations, silver demand in this segment is forecast to decline by 5% this year.”
Jewellery demand is set to decline 4%, with silverware 11% lower.
Worrying? Not really.
Demand is growing from AI and grid infrastructure and while physical investment is expected to fall 4% for the third consecutive year to its lowest level since 2018, that’s largely due to liquidations in the US market.
It’s an outsized component of global investment demand, with US silver purchases amounting to 70% of gold purchases through 2024 against 6% elsewhere in the world.
If the US is taken out of the equation, global physical investment is due to rise 11% with Indian buyers leading the way.
Supply remains strained
But the fundamentals remain impressive, with supply struggling to respond to higher silver prices and a fifth straight deficit expected this year.
Supply will grow just 1% this year, largely due to hedging activities, but mine production will be flat and recycling is only expected to have risen 1%, with higher prices doing nothing to inspire industrial recycling.
“Overall, the silver market is expected to record a structural deficit in 2025 for the fifth consecutive year. Although this year’s shortfall will be smaller than in previous years, it will continue to erode above-ground stocks, tightening physical market conditions. More importantly, this ongoing deficit coincides with a notable rise in silver investment,” Metals Focus analysts say.
Including exchange traded products makes the shortfall look a lot more concerning.
“Silver ETPs, for example, are on track for the second-largest annual increase in 2025. In fact, when changes in ETP holdings are included, the market balance points to the deepest supply shortfall on record,” they said.
“Looking ahead, we expect most of the macroeconomic and geopolitical factors underpinning the broader rally in precious metals to remain in place over the next 12 months or so. Meanwhile, silver’s supply–demand fundamentals should continue to provide price support.
“While we recognise that high prices have weighed on some areas of silver fabrication, in some applications this will take time to translate into materially weaker demand. Coupled with a projected recovery in silver bar and coin sales, this will keep the silver market in deficit through 2026.”
Winners and losers
Here’s how ASX-listed precious metals stocks are performing:
| CODE | COMPANY | PRICE | WEEK % | MONTH % | 6 MONTH % | YEAR % | YTD % | MARKET CAP |
|---|---|---|---|---|---|---|---|---|
| MRR | Minrex Resources Ltd | 0.011 | -15% | -8% | 0% | 38% | 57% | $ 12,475,976.28 |
| NPM | Newpeak Metals | 0.023 | -4% | -8% | 77% | 130% | 109% | $ 7,570,296.45 |
| MTC | Metalstech Ltd | 0.275 | -4% | -13% | 104% | 120% | 96% | $ 61,065,114.00 |
| GED | Golden Deeps | 0.051 | -15% | -32% | 183% | 89% | 104% | $ 11,291,763.43 |
| G88 | Golden Mile Res Ltd | 0.007 | -13% | -22% | -50% | -36% | -22% | $ 4,381,195.23 |
| LAT | Latitude 66 Limited | 0.05 | 0% | -22% | 4% | -36% | 32% | $ 6,883,233.84 |
| NMR | Native Mineral Res | 0.07 | -18% | -39% | -58% | 89% | 79% | $ 70,236,567.03 |
| AQX | Alice Queen Ltd | 0.005 | 0% | 11% | 0% | -38% | -38% | $ 6,027,890.49 |
| SLZ | Sultan Resources Ltd | 0.008 | -11% | -33% | 33% | 14% | 33% | $ 4,290,563.99 |
| KSN | Kingston Resources | 0.115 | -12% | -23% | -8% | 25% | 62% | $ 96,604,644.05 |
| AMI | Aurelia Metals Ltd | 0.21 | -9% | -18% | -30% | 20% | 24% | $ 355,440,254.40 |
| GIB | Gibb River Diamonds | 0.058 | -3% | -6% | 61% | 61% | 45% | $ 12,441,547.81 |
| KCN | Kingsgate Consolid. | 3.93 | -15% | -3% | 99% | 193% | 206% | $ 1,087,712,140.24 |
| TMX | Terrain Minerals | 0.004 | -20% | -20% | 33% | 33% | 33% | $ 11,864,812.69 |
| BNR | Bulletin Res Ltd | 0.05 | 9% | -14% | -26% | 25% | 28% | $ 14,680,666.15 |
| NXM | Nexus Minerals Ltd | 0.075 | -4% | -7% | 9% | 17% | 67% | $ 45,281,970.98 |
| LM8 | Lunnonmetalslimited | 0.285 | -5% | -14% | 33% | 12% | 14% | $ 63,651,597.33 |
| CST | Castile Resources | 0.1 | -9% | -29% | 56% | 28% | 25% | $ 30,574,858.00 |
| YRL | Yandal Resources | 0.3 | -3% | -21% | 131% | -13% | 71% | $ 113,852,679.60 |
| FAU | First Au Ltd | 0.007 | 0% | -22% | 100% | 250% | 250% | $ 18,350,392.95 |
| GWR | GWR Group Ltd | 0.105 | 2% | 5% | 7% | 24% | 31% | $ 35,596,732.05 |
| IVR | Investigator Res Ltd | 0.046 | -19% | -19% | 109% | 21% | 130% | $ 84,478,556.15 |
| IPT | Impact Minerals | 0.0055 | 0% | -8% | -8% | -51% | -42% | $ 26,092,545.59 |
| BNZ | Benzmining | 1.325 | -9% | -28% | 253% | 410% | 284% | $ 274,658,562.33 |
| MOH | Moho Resources | 0.007 | 0% | -22% | 17% | 40% | 40% | $ 6,235,290.29 |
| SMS | Starmineralslimited | 0.045 | -2% | -18% | 73% | 18% | 25% | $ 10,020,275.96 |
| MVL | Marvel Gold Limited | 0.017 | 6% | -11% | 21% | 55% | 89% | $ 24,130,803.78 |
| PRX | Prodigy Gold NL | 0.063 | 5% | 5% | 58% | 58% | 58% | $ 21,236,882.50 |
| AAU | Antilles Gold Ltd | 0.008 | -11% | -27% | 100% | 100% | 167% | $ 22,500,544.13 |
| RND | Rand Mining Ltd | 2.4 | 5% | -14% | 26% | 26% | 58% | $ 136,502,306.40 |
| CAZ | Cazaly Resources | 0.034 | -6% | 13% | 113% | 162% | 143% | $ 15,890,379.77 |
| BMR | Ballymore Resources | 0.205 | 5% | 28% | 32% | 58% | 71% | $ 42,267,503.32 |
| DRE | Dreadnought Resources Ltd | 0.031 | -14% | -14% | 138% | 121% | 158% | $ 173,407,357.10 |
| ZNC | Zenith Minerals Ltd | 0.088 | 4% | -4% | 120% | 105% | 120% | $ 52,176,858.45 |
| REZ | Resourc & En Grp Ltd | 0.016 | 0% | -27% | -11% | -41% | -30% | $ 12,364,894.74 |
| LEX | Lefroy Exploration | 0.185 | -5% | 6% | 134% | 140% | 164% | $ 45,957,725.53 |
| ERM | Emmerson Resources | 0.275 | -5% | -7% | 112% | 337% | 257% | $ 175,724,300.68 |
| AS1 | Asara Resources Ltd | 0.073 | -9% | -3% | 59% | 217% | 284% | $ 117,031,981.44 |
| CYL | Catalyst Metals | 6.82 | -7% | -9% | 3% | 123% | 164% | $ 1,946,749,864.95 |
| KAL | Kalgoorliegoldmining | 0.056 | -15% | -15% | 33% | 167% | 211% | $ 25,504,362.52 |
| MLS | Metals Australia | 0.029 | 0% | -9% | 61% | 12% | 26% | $ 21,219,866.20 |
| SRN | Surefire Rescs NL | 0.002 | 0% | 0% | -20% | -32% | -32% | $ 8,051,218.50 |
| WA8 | Warriedarresourltd | 0.265 | 0% | 2% | 121% | 430% | 502% | $ 332,993,866.69 |
| HMX | Hammer Metals Ltd | 0.023 | -4% | -26% | -23% | -34% | -30% | $ 20,533,450.10 |
| WCN | White Cliff Min Ltd | 0.0185 | -8% | -12% | -38% | 16% | 16% | $ 46,519,508.88 |
| AVM | Advance Metals Ltd | 0.077 | -15% | -33% | 83% | 114% | 126% | $ 30,029,344.65 |
| GA8 | Goldarc Resources | 0.056 | 8% | 4% | 180% | 87% | 87% | $ 31,781,080.80 |
| ARI | Arika Resources | 0.029 | 0% | -12% | -15% | 0% | 7% | $ 26,081,209.51 |
| CTO | Citigold Corp Ltd | 0.011 | 0% | 0% | 175% | 175% | 175% | $ 33,000,000.00 |
| SMI | Santana Minerals Ltd | 0.795 | -9% | -16% | 47% | 36% | 64% | $ 660,914,871.50 |
| M2R | Miramar | 0.003 | 0% | -14% | 0% | -45% | 0% | $ 2,987,308.11 |
| MHC | Manhattan Corp Ltd | 0.023 | -12% | -8% | -4% | 15% | 21% | $ 12,819,593.31 |
| GRL | Godolphin Resources | 0.015 | -6% | -35% | 67% | 0% | 3% | $ 10,442,349.86 |
| SVG | Savannah Goldfields | 0.019 | 0% | -24% | -21% | 3% | 3% | $ 40,689,963.74 |
| EMC | Everest Metals Corp | 0.115 | 10% | -15% | -23% | -12% | -15% | $ 30,866,806.96 |
| GUL | Gullewa Limited | 0.077 | -5% | -6% | 10% | 22% | 38% | $ 16,787,707.24 |
| CY5 | Cygnus Metals Ltd | 0.115 | -12% | -18% | 64% | -4% | 15% | $ 122,408,871.32 |
| G50 | G50Corp Ltd | 0.57 | -5% | -11% | 443% | 208% | 268% | $ 115,551,915.63 |
| ADV | Ardiden Ltd | 0.3 | -9% | -17% | 107% | 131% | 122% | $ 18,737,664.27 |
| AAR | Astral Resources NL | 0.195 | -7% | -22% | 26% | 44% | 44% | $ 287,509,061.78 |
| VMC | Venus Metals Cor Ltd | 0.17 | 17% | 17% | 62% | 143% | 154% | $ 33,341,876.11 |
| NAE | New Age Exploration | 0.003 | -14% | 0% | -25% | -25% | -14% | $ 9,923,995.91 |
| VKA | Viking Mines Ltd | 0.006 | 0% | -14% | -14% | -50% | -25% | $ 8,158,527.28 |
| LCL | LCL Resources Ltd | 0.006 | -14% | -33% | -14% | -40% | -40% | $ 7,195,542.91 |
| MTH | Mithril Silver Gold | 0.365 | -22% | -35% | 3% | -12% | -9% | $ 67,352,327.26 |
| ADG | Adelong Gold Limited | 0.01 | 0% | -33% | 33% | 100% | 122% | $ 25,668,363.62 |
| RMX | Red Mount Min Ltd | 0.031 | 3% | -14% | 288% | 210% | 244% | $ 24,547,627.95 |
| PRS | Prospech Limited | 0.015 | 0% | -35% | -35% | -48% | -46% | $ 7,852,678.22 |
| TTM | Titan Minerals | 0.585 | -4% | 7% | 54% | 39% | 54% | $ 167,611,609.04 |
| AKA | Aureka Limited | 0.155 | -11% | 3% | 19% | 41% | 15% | $ 19,864,400.72 |
| AAM | Aumegametals | 0.036 | 3% | -32% | 0% | -12% | -14% | $ 21,218,774.40 |
| KZR | Kalamazoo Resources | 0.185 | -10% | -5% | 113% | 123% | 150% | $ 44,726,661.72 |
| BCN | Beacon Minerals | 2.42 | -2% | -14% | 116% | 175% | 175% | $ 256,163,734.86 |
| MAU | Magnetic Resources | 1.18 | -6% | -15% | -29% | -6% | 7% | $ 348,413,120.08 |
| BC8 | Black Cat Syndicate | 0.935 | -12% | -28% | 11% | 53% | 65% | $ 722,935,466.87 |
| EM2 | Eagle Mountain | 0.009 | -10% | 0% | 80% | -73% | 0% | $ 11,870,435.60 |
| EMR | Emerald Res NL | 5.07 | -4% | -3% | 11% | 38% | 56% | $ 3,492,608,722.68 |
| BYH | Bryah Resources Ltd | 0.004 | -11% | -33% | -20% | 0% | 33% | $ 5,942,662.66 |
| HCH | Hot Chili Ltd | 0.79 | -9% | -12% | 56% | -1% | 13% | $ 140,115,833.06 |
| WAF | West African Res Ltd | 3.04 | 0% | 0% | 22% | 105% | 112% | $ 3,468,834,827.52 |
| MEU | Marmota Limited | 0.073 | 11% | 9% | 62% | 78% | 87% | $ 86,016,322.67 |
| NVA | Nova Minerals Ltd | 1.03 | -14% | -9% | 217% | 379% | 178% | $ 426,554,741.51 |
| SVL | Silver Mines Limited | 0.17 | -3% | -13% | 79% | 70% | 118% | $ 364,202,553.71 |
| PGD | Peregrine Gold | 0.25 | -15% | -7% | 85% | 92% | 79% | $ 24,621,026.25 |
| ICL | Iceni Gold | 0.052 | -7% | -16% | -17% | -9% | -27% | $ 17,882,872.02 |
| FG1 | Flynngold | 0.021 | -5% | -16% | -15% | -32% | -15% | $ 12,781,761.22 |
| WWI | West Wits Mining Ltd | 0.048 | -6% | -24% | 71% | 269% | 243% | $ 184,067,964.91 |
| RML | Resolution Minerals | 0.061 | -15% | -42% | 369% | 408% | 408% | $ 114,240,978.91 |
| AAJ | Aruma Resources Ltd | 0.018 | 0% | -18% | 64% | 20% | 50% | $ 7,430,854.82 |
| HWK | Hawk Resources. | 0.029 | -3% | -6% | 45% | -3% | 32% | $ 9,821,192.17 |
| GMN | Gold Mountain Ltd | 0.066 | 0% | -22% | -2% | -2% | -51% | $ 12,078,179.92 |
| MEG | Megado Minerals Ltd | 0.028 | 4% | -22% | 115% | 133% | 65% | $ 18,079,131.34 |
| HMG | Hamelingoldlimited | 0.07 | -8% | -23% | -7% | -17% | 9% | $ 13,881,249.97 |
| TBR | Tribune Res Ltd | 6.09 | 2% | -16% | 28% | 24% | 42% | $ 319,530,588.93 |
| FML | Focus Minerals Ltd | 2.58 | -12% | 29% | 998% | 1333% | 1418% | $ 739,321,304.10 |
| ARV | Artemis Resources | 0.009 | -10% | -10% | 50% | -14% | 13% | $ 33,938,299.49 |
| HRN | Horizon Gold Ltd | 0.74 | 0% | -5% | 48% | 54% | 55% | $ 124,688,212.85 |
| CLA | Celsius Resource Ltd | 0.01 | -17% | -9% | 43% | 0% | -9% | $ 31,354,884.52 |
| QML | Qmines Limited | 0.056 | -5% | -3% | 51% | -7% | 4% | $ 32,611,657.32 |
| RDN | Raiden Resources Ltd | 0.005 | -17% | -29% | -17% | -78% | -55% | $ 17,254,457.21 |
| TCG | Turaco Gold Limited | 0.445 | -2% | -11% | 2% | 46% | 75% | $ 468,482,323.82 |
| KCC | Kincora Copper | 1.1 | -11% | 9% | 238% | 224% | 307% | $ 23,639,386.10 |
| GBZ | GBM Rsources Ltd | 0.035 | -8% | -24% | 338% | 400% | 338% | $ 158,144,109.24 |
| DTM | Dart Mining NL | 0.033 | -15% | -59% | -45% | -80% | -76% | $ 6,920,384.56 |
| MKR | Manuka Resources. | 0.077 | 13% | 8% | 125% | 107% | 181% | $ 85,456,592.76 |
| AUC | Ausgold Limited | 0.78 | -11% | -13% | 29% | 75% | 86% | $ 338,111,929.74 |
| ANX | Anax Metals Ltd | 0.01 | 11% | 0% | 25% | -9% | -17% | $ 8,828,075.67 |
| EMU | EMU NL | 0.044 | -14% | 0% | 147% | 81% | 74% | $ 11,616,780.66 |
| SFM | Santa Fe Minerals | 0.26 | 8% | 6% | 603% | 767% | 739% | $ 29,332,885.14 |
| PNR | Pantoro Gold Limited | 4.65 | -8% | -23% | 36% | 174% | 204% | $ 1,966,962,725.93 |
| CMM | Capricorn Metals | 13.4 | -5% | -7% | 48% | 105% | 113% | $ 6,116,005,634.96 |
| VRL | Verity Resources | 0.016 | -11% | -30% | -45% | -18% | -18% | $ 6,504,519.42 |
| HAW | Hawthorn Resources | 0.083 | 0% | 9% | 73% | 77% | 102% | $ 27,806,295.88 |
| BGD | Bartongoldholdings | 1.01 | -14% | -12% | 55% | 261% | 312% | $ 240,874,708.10 |
| SVY | Stavely Minerals Ltd | 0.013 | -32% | -28% | 8% | -50% | -24% | $ 8,902,222.97 |
| AGC | AGC Ltd | 0.175 | -10% | -20% | 17% | -20% | 13% | $ 47,124,054.78 |
| RGL | Riversgold | 0.007 | -13% | -22% | 75% | 133% | 75% | $ 14,585,988.15 |
| TSO | Tesoro Gold Ltd | 0.068 | 11% | 1% | 162% | 172% | 240% | $ 171,758,641.64 |
| GUE | Global Uranium | 0.058 | 0% | -11% | -6% | -2% | -3% | $ 26,423,000.78 |
| CPM | Coopermetalslimited | 0.056 | -2% | -2% | 51% | 17% | 22% | $ 4,387,916.40 |
| MM8 | Medallion Metals. | 0.365 | -10% | -32% | 46% | 306% | 204% | $ 223,894,651.83 |
| FFM | Firefly Metals Ltd | 1.63 | -8% | 1% | 65% | 53% | 76% | $ 1,218,534,591.12 |
| CBY | Canterbury Resources | 0.024 | 4% | 4% | 9% | -4% | 9% | $ 6,472,155.94 |
| SLA | Solara Minerals | 0.19 | -7% | 0% | 58% | -17% | 111% | $ 11,254,616.37 |
| SFR | Sandfire Resources | 15 | -8% | -6% | 37% | 47% | 62% | $ 7,289,654,516.48 |
| TAM | Tanami Gold NL | 0.067 | -4% | -7% | 76% | 139% | 123% | $ 78,731,502.08 |
| NWM | Norwest Minerals | 0.0105 | -13% | -30% | -5% | -39% | -12% | $ 10,816,122.99 |
| ALK | Alkane Resources Ltd | 0.9 | -12% | -17% | 26% | 80% | 76% | $ 1,311,163,168.32 |
| BMO | Bastion Minerals | 0.001 | -33% | 0% | 27% | -75% | -68% | $ 2,566,449.88 |
| IDA | Indiana Resources | 0.038 | -14% | -22% | 15% | 58% | 49% | $ 24,461,833.40 |
| GSM | Golden State Mining | 0.016 | 0% | -6% | 78% | 78% | 100% | $ 5,639,444.48 |
| NSM | Northstaw | 0.034 | -8% | -13% | -6% | 213% | 115% | $ 12,085,803.68 |
| GSN | Great Southern | 0.03 | -9% | 0% | 30% | 58% | 100% | $ 29,904,128.70 |
| VAUDA | Vault Minerals Ltd | 4.4 | -13% | -12% | 56% | 102% | 105% | $ 4,783,009,535.08 |
| CDR | Codrus Minerals Ltd | 0.022 | 5% | -12% | -33% | 22% | 29% | $ 4,341,421.96 |
| MDI | Middle Island Res | 0.03 | -17% | -32% | 58% | 100% | 150% | $ 29,799,652.89 |
| WTM | Waratah Minerals Ltd | 0.47 | -9% | -41% | 36% | 154% | 203% | $ 145,352,756.01 |
| POL | Polymetals Resources | 0.92 | -11% | -32% | 15% | 29% | 16% | $ 246,388,582.84 |
| RDS | Redstone Resources | 0.003 | 20% | 0% | -50% | 20% | 20% | $ 3,689,944.93 |
| NAG | Nagambie Resources | 0.012 | -8% | -33% | -33% | -33% | -33% | $ 10,760,268.00 |
| BGL | Bellevue Gold Ltd | 1.205 | -5% | -9% | 36% | -8% | 7% | $ 1,873,147,374.95 |
| GBR | Greatbould Resources | 0.07 | -13% | -17% | 13% | 63% | 63% | $ 72,845,042.83 |
| KAI | Kairos Minerals Ltd | 0.031 | -11% | -24% | 15% | 107% | 158% | $ 104,389,097.29 |
| KAU | Kaiser Reef | 0.255 | -6% | -26% | 55% | 59% | 59% | $ 151,441,320.41 |
| HRZ | Horizon | 0.062 | -6% | -22% | 27% | 41% | 55% | $ 191,068,497.71 |
| CDT | Castle Minerals | 0.061 | -2% | -12% | -36% | -19% | 2% | $ 10,577,127.64 |
| RSG | Resolute Mining | 0.99 | -2% | -17% | 60% | 144% | 151% | $ 2,289,423,213.98 |
| EVN | Evolution Mining Ltd | 10.89 | -6% | -6% | 26% | 117% | 126% | $ 23,147,993,094.00 |
| CXU | Cauldron Energy Ltd | 0.022 | 16% | 0% | 182% | 51% | 88% | $ 39,366,934.71 |
| ALY | Alchemy Resource Ltd | 0.008 | 0% | -27% | 33% | 14% | 14% | $ 9,504,610.05 |
| NH3 | Nh3Cleanenergyltd | 0.095 | -5% | -21% | 296% | 352% | 428% | $ 65,188,622.57 |
| OBM | Ora Banda Mining Ltd | 1.17 | -2% | -14% | 10% | 56% | 80% | $ 2,294,372,470.52 |
| AVW | Avira Resources Ltd | 0.011 | -8% | -27% | 38% | -45% | -45% | $ 2,909,500.00 |
| LCY | Legacy Iron Ore | 0.008 | 0% | -11% | -11% | -36% | -20% | $ 78,096,340.67 |
| PDI | Predictive Disc Ltd | 0.55 | -3% | -10% | 29% | 124% | 139% | $ 1,496,061,697.08 |
| MAT | Matsa Resources | 0.1 | -5% | -13% | 49% | 117% | 186% | $ 93,843,131.50 |
| ZAG | Zuleika Gold Ltd | 0.045 | 50% | 73% | 275% | 165% | 246% | $ 38,109,596.72 |
| GML | Gateway Mining | 0.085 | 9% | -11% | 193% | 270% | 305% | $ 194,850,626.61 |
| SBM | St Barbara Limited | 0.505 | -6% | -14% | 66% | 44% | 124% | $ 610,946,909.81 |
| SBR | Sabre Resources | 0.012 | 0% | -14% | 50% | 9% | 20% | $ 4,339,081.26 |
| STK | Strickland Metals | 0.18 | 0% | -16% | 92% | 158% | 137% | $ 407,224,763.46 |
| CEL | Challenger Gold Ltd | 0.115 | -12% | -26% | 47% | 140% | 145% | $ 278,198,754.81 |
| GG8 | Gorilla Gold Mines | 0.37 | -9% | -22% | -28% | 42% | 42% | $ 269,733,739.59 |
| NST | Northern Star | 25.5 | -4% | -1% | 33% | 45% | 65% | $ 38,000,329,886.72 |
| OZM | Ozaurum Resources | 0.057 | -12% | -21% | -32% | 97% | 90% | $ 13,746,112.38 |
| TG1 | Techgen Metals Ltd | 0.029 | -12% | -19% | 22% | 1% | -13% | $ 9,432,676.45 |
| AQI | Alicanto Min Ltd | 0.041 | 3% | -7% | 52% | 32% | 11% | $ 37,889,862.02 |
| KTA | Krakatoa Resources | 0.011 | -8% | -31% | 10% | 10% | 16% | $ 11,807,093.32 |
| ARN | Aldoro Resources | 0.465 | -7% | -14% | 48% | 447% | 22% | $ 99,553,422.32 |
| WGX | Westgold Resources. | 5.45 | -4% | -4% | 100% | 94% | 93% | $ 5,527,264,649.40 |
| MBK | Metal Bank Ltd | 0.019 | 27% | 12% | 81% | 10% | 33% | $ 12,736,502.54 |
| A8G | Australasian Metals | 0.086 | -4% | -36% | 25% | 16% | 9% | $ 4,978,516.35 |
| TAR | Taruga Minerals | 0.01 | -9% | -29% | 25% | -9% | 0% | $ 7,137,540.58 |
| DTR | Dateline Resources | 0.265 | -4% | -29% | 502% | 8733% | 7471% | $ 919,849,751.84 |
| S2R | S2 Resources | 0.09 | 13% | -7% | -1% | 11% | 34% | $ 47,809,191.51 |
| NES | Nelson Resources. | 0.0055 | 0% | -21% | 83% | 175% | 83% | $ 10,982,971.64 |
| TLM | Talisman Mining | 0.099 | -6% | -27% | -34% | -54% | -52% | $ 18,643,714.55 |
| BEZ | Besragoldinc | 0.037 | 0% | -49% | -3% | -44% | -59% | $ 15,373,647.15 |
| PRU | Perseus Mining Ltd | 5.19 | -1% | 1% | 40% | 94% | 102% | $ 7,296,643,722.60 |
| SPQ | Superior Resources | 0.009 | -18% | -18% | 125% | 29% | 50% | $ 21,365,844.53 |
| PUR | Pursuit Minerals | 0.076 | 10% | -10% | 90% | -49% | -21% | $ 11,610,314.72 |
| RMS | Ramelius Resources | 3.39 | -5% | -14% | 26% | 63% | 64% | $ 6,794,416,259.89 |
| PKO | Peako Limited | 0.0035 | -13% | -30% | 40% | 17% | 17% | $ 5,207,096.86 |
| RKB | Rokeby Resources Ltd | 0.005 | 0% | 0% | 11% | -23% | 0% | $ 9,132,805.76 |
| A1G | African Gold Ltd. | 0.31 | -2% | -9% | 158% | 474% | 464% | $ 165,300,671.32 |
| NMG | New Murchison Gold | 0.035 | -3% | 13% | 150% | 289% | 289% | $ 378,778,455.83 |
| GNM | Great Northern | 0.055 | -8% | -35% | 189% | 358% | 293% | $ 26,529,368.53 |
| KRM | Kingsrose Mining Ltd | 0.042 | -7% | -16% | 35% | 24% | 20% | $ 31,648,113.80 |
| BTR | Brightstar Resources | 0.43 | -9% | -23% | -30% | -25% | -14% | $ 249,103,046.73 |
| RRL | Regis Resources | 6.6 | -7% | 1% | 36% | 149% | 159% | $ 5,308,337,914.99 |
| M24 | Mamba Exploration | 0.016 | -6% | -20% | 7% | 33% | 33% | $ 4,722,649.76 |
| TRM | Truscott Mining Corp | 0.08 | -2% | 3% | 23% | 14% | 3% | $ 15,655,084.80 |
| TNC | True North Copper | 0.405 | 25% | 42% | 45% | -87% | -87% | $ 51,590,029.14 |
| KNB | Koonenberrygold | 0.04 | -2% | -20% | -35% | 167% | 233% | $ 41,098,400.52 |
| AWJ | Auric Mining | 0.26 | -4% | -9% | 37% | -7% | -24% | $ 48,615,086.52 |
| ENR | Encounter Resources | 0.4 | -7% | -26% | 82% | 0% | 23% | $ 221,946,705.20 |
| SNG | Siren Gold | 0.11 | -4% | -4% | 129% | 59% | 69% | $ 33,001,299.87 |
| STN | Saturn Metals | 0.47 | -8% | -15% | 71% | 104% | 129% | $ 253,555,788.47 |
| USL | Unico Silver Limited | 0.49 | -27% | -18% | 139% | 133% | 151% | $ 252,038,116.47 |
| AYM | Australia United Min | 0.004 | 0% | -33% | 33% | 33% | 0% | $ 7,370,309.94 |
| HAV | Havilah Resources | 0.425 | -2% | 73% | 158% | 113% | 89% | $ 148,906,148.40 |
| PNT | Panthermetalsltd | 0.008 | 0% | -30% | -35% | -60% | -23% | $ 2,450,236.38 |
| MEK | Meeka Metals Limited | 0.215 | -10% | -4% | 59% | 226% | 179% | $ 628,690,674.05 |
| GMD | Genesis Minerals | 6.17 | -2% | -7% | 49% | 149% | 150% | $ 7,536,425,391.00 |
| PGO | Pacgold | 0.06 | -9% | -18% | -24% | -33% | -20% | $ 16,966,883.40 |
| FEG | Far East Gold | 0.16 | 14% | 7% | 7% | -6% | -11% | $ 58,724,392.48 |
| MI6 | Minerals260Limited | 0.305 | -3% | -10% | 91% | 135% | 135% | $ 630,536,666.57 |
| GAL | Galileo Mining Ltd | 0.16 | -24% | -16% | 33% | 33% | 28% | $ 31,619,988.32 |
| RXL | Rox Resources | 0.365 | -4% | -28% | 24% | 128% | 83% | $ 275,520,437.61 |
| PTN | Patronus Resources | 0.071 | -8% | -22% | 25% | 13% | 45% | $ 105,028,299.29 |
| CLZ | Classic Min Ltd | 0.001 | 0% | 0% | 0% | 0% | 0% | $ 4,265,855.46 |
| TGM | Theta Gold Mines Ltd | 0.155 | -6% | -14% | 29% | -14% | -14% | $ 162,127,050.97 |
| FAL | Falconmetalsltd | 0.55 | -6% | -26% | 358% | 307% | 378% | $ 116,954,764.85 |
| SPD | Southernpalladium | 0.965 | -17% | -15% | 245% | 38% | 61% | $ 109,632,777.64 |
| TMB | Tambourahmetals | 0.087 | -13% | -28% | 248% | 235% | 314% | $ 21,832,980.69 |
| TMS | Tennant Minerals Ltd | 0.007 | -13% | -22% | 0% | -50% | -22% | $ 7,461,232.91 |
| AZY | Antipa Minerals Ltd | 0.56 | -3% | -13% | -12% | 155% | 115% | $ 370,936,233.92 |
| PXX | Polarx Limited | 0.019 | -10% | -32% | 171% | 138% | 192% | $ 51,618,891.38 |
| TRE | Toubani Res Ltd | 0.35 | 0% | -21% | 27% | 84% | 106% | $ 182,579,147.45 |
| AUN | Aurumin | 0.105 | -5% | -19% | 59% | 88% | 59% | $ 53,760,888.09 |
| GPR | Geopacific Resources | 0.033 | -6% | -21% | 74% | 36% | 65% | $ 105,530,545.86 |
| FXG | Felix Gold Limited | 0.415 | -17% | -37% | 196% | 476% | 394% | $ 183,102,589.49 |
| ILT | Iltani Resources Lim | 0.415 | -7% | -26% | 84% | 144% | 102% | $ 28,776,432.83 |
| BRX | Belararoxlimited | 0.086 | -4% | -2% | -34% | -59% | -51% | $ 17,452,708.94 |
| TM1 | Terra Metals Limited | 0.12 | -17% | -23% | 300% | 300% | 329% | $ 94,965,570.84 |
| TOR | Torque Met | 0.25 | 0% | -23% | 117% | 381% | 372% | $ 135,292,825.25 |
| ARD | Argent Minerals | 0.027 | -18% | -13% | 35% | 8% | 59% | $ 45,289,207.24 |
| LNQ | Linqmineralslimited | 0.185 | -3% | -5% | 0% | 0% | 0% | $ 10,823,750.18 |
| LM1 | Leeuwin Metals Ltd | 0.145 | -19% | -45% | -3% | 99% | 4% | $ 18,195,649.22 |
| SS1 | Sun Silver Limited | 0.975 | -15% | -18% | 51% | 41% | 56% | $ 129,203,023.95 |
| SX2 | Southgold Consol | 6.7 | -13% | -22% | 17% | 0% | 0% | $ 1,047,497,650.56 |
| AA2 | Ariana Resources PLC | 0.27 | -4% | -23% | 0% | 0% | 0% | $ 7,896,918.15 |
| M2M | Mtmalcolmminesnl | 0.017 | 13% | -13% | -32% | -33% | -28% | $ 5,281,561.85 |
| BM1 | Ballardmininglimited | 0.62 | -10% | 18% | 0% | 0% | 0% | $ 137,442,327.26 |
| UVA | Uvrelimited | 0.185 | -3% | -21% | 85% | 87% | 108% | $ 35,086,822.69 |
| VTX | Vertexmin | 0.22 | 0% | -23% | -2% | 10% | 6% | $ 63,033,801.38 |
| JAV | Javelin Minerals Ltd | 0.074 | -16% | -20% | -20% | -32% | -20% | $ 19,239,233.51 |
| SNM | Sentinel Metals | 0.32 | -7% | 0% | 0% | 0% | 0% | $ 17,404,266.24 |
| GGR | Goldengloberesources | 0.135 | -16% | 0% | 0% | 0% | 0% | $ 15,091,032.38 |
| RRE | Right Resources | 0.17 | -13% | 0% | 0% | 0% | 0% | $ 15,034,348.65 |
| GDR | Goldendragonmining | 0.195 | -3% | 0% | 0% | 0% | 0% | $ 6,400,874.81 |
| PC2 | Pc Gold Ltd | 0.215 | -7% | -26% | 0% | 0% | 0% | $ 34,327,389.99 |
| OMX | Orangeminerals | 0.089 | -1% | 0% | 46% | 197% | 207% | $ 15,226,619.11 |
| WCE | Westcoastsilver Ltd | 0.145 | -15% | -19% | 184% | 113% | 196% | $ 47,942,842.78 |
| RCR | Rincon | 0.015 | -12% | -21% | 15% | 15% | 36% | $ 4,733,436.50 |
| CRS | Caprice Resources | 0.13 | -16% | 0% | 132% | 491% | 465% | $ 90,373,394.15 |
| MAG | Magmatic Resrce Ltd | 0.059 | -3% | -18% | 64% | 44% | 97% | $ 29,631,631.48 |
| CHN | Chalice Mining Ltd | 1.715 | -8% | -21% | 53% | 26% | 55% | $ 721,790,871.31 |
| ORE | Orezone Gold Corp | 1.375 | -10% | -15% | 0% | 0% | 0% | $ 102,030,226.38 |
| RXR | Robex Resources | 4.63 | -4% | -12% | 0% | 0% | 0% | $ 345,280,147.98 |
| GGP | Greatland Resources | 7.48 | -6% | -11% | 0% | 0% | 0% | $ 5,312,353,250.16 |
| MMA | Maronanmetalslimited | 0.285 | -14% | -15% | 24% | 36% | 36% | $ 71,662,412.10 |
| LGM | Legacy Minerals | 0.23 | -8% | -15% | 31% | 24% | 59% | $ 38,653,733.53 |
| LDR | Lode Resources | 0.18 | -8% | -38% | 20% | 64% | 96% | $ 29,121,146.10 |
| BUS | Bubalusresources | 0.15 | 20% | 0% | 15% | 15% | 15% | $ 8,608,201.20 |
Gold medal performers
Who were some of the top precious metals names this week?
Mark Creasy’s Zuleika Gold will claim $31 million in Catalyst Metals (ASX:CYL) shares and $17m in cash in a $48 million settlement to end a legal dispute dating back to the days of a JV partnership between tthe companies in their former guises as Dampier Gold and Vango Mining.
It gives the company plenty of ammunition to fund gold exploration and pursue acquisitions after relinquishing its claim to part of a mining lease at Catalyst’s Plutonic gold operations.
“The Board welcomes this excellent settlement outcome, which provides clarity, certainty and a major step forward for the Company. This settlement marks an important milestone for Zuleika and a significant win for our Shareholders,” Zuleika chair Annie Guo said.
“Successfully ending this five-year litigation has required considerable resolve and an unwavering commitment to protecting Zuleika’s rights. The Board’s persistence has paid off, delivering a strong settlement that both protects and enhances shareholder value.
“The Board extends its sincere thanks to our Shareholders for their unflagging support throughout this challenging period. Their commitment has been vital in achieving this outcome and places Zuleika in a far stronger position for the future. Zuleika can now turn its undivided attention to progressing our strategic priorities of advancing our portfolio of exciting gold assets and pursuing further growth opportunities.”
It’s one of a number of cashed up Creasy vehicles on the ASX, including iron ore, gold and copper explorer CZR Resources (ASX:CZR), with the prospector also quietly looking to build a private gold empire through his firm AIM Mining, which owns the Warrawoona and Nullagine gold mines, and is looking to engineer a deal to claim the assets of the collapsed Wiluna Mining Corporation.
Andrew Forrest backed Hastings Technology Metals (ASX:HAS) has been drilling out its Whiteheads gold project near Kalgoorlie, currently planned to be vended into Metal Bank in exchange for a major stake in the company, which HAS plans to distribute in-specie to its shareholders.
The obvious point is that Hastings, planning to develop its Yangibana rare earths project in WA’s Gascoyne, has no need for three small gold assets that could move the needle for a company like Metal Bank. As part of the $2.3m (share) deal, MBK will pick up three projects including Darcy’s in the East Kimberley, Ark Gold, near Yangibana, and the more advanced Whiteheads.
Located 80km northeast of Kalgoorlie, the plan is to have a maiden resource estimate by December with a view to potentially mining it via a toll treatment deal as soon as 2026. Those agreements have become common with gold roaring past US$4000/oz (+A$6000/oz), making it far more economic to haul and treat ore via third party mills.
Metal Bank shareholders will be looking at those projects more gleefully after results from 21 of 32 holes of recent reverse circulation drilling at Whiteheads were returned. They included:
- 5m at 15.17g/t Au from 27m, including 2m at 35.55g/t Au from 28m (SLRC0014)
- 35m at 1.94g/t Au from surface including 1m at 18.05g/t Au from 33m (SLRC0005)
- 17m at 2.17g/t Au from 17m including 3m at 5.75g/t Au from 28m (SLRC0002); and
- 26m at 1.77g/t Au from 14m including 15m at 2.58g/t Au from 23m (SLRC004)
MBK holders have approved the deal, with only Hastings shareholder approval for the deal and in-specie distribution of Metal Bank shares needed at the company’s AGM on Friday.
True North Copper ran hot on Tuesday as it revealed a massive copper hit at its Aquila discovery, part of the Mt Oxide project around 140km north of Mt Isa.
Mt Oxide already hosts the Vero resource, containing 15.03Mt at 1.46% copper and 10.59 g/t silver (indicated and inferred) and 9.15 Mt at 0.23% cobalt (measured, indicated and inferred).
But the hit – 59m at 1.77% Cu, 0.04% Co, 5.2 g/t Ag from 134m – suggests something just as, if not more substantial could be lurking at Aquila, including a 7m section at 7.9% copper.
TNC was brought out of administration earlier this year, backed in by the owner of the Mt Isa copper concentrator and smelter Glencore. The mining giant has shut its own underground mining operation in the town and is in need of long-term sources of copper ore.
The early mail is Aquila could well play a role if further assays return similar results. Assays for another 3313m of phase 2 drilling at Aquila still need to be returned and reported to the market, with this week’s hit putting more eyeballs on those results.
At Stockhead, we tell it like it is. While True North Copper is a Stockhead advertiser, it did not sponsor this article.

Related Stories


UNLOCK INSIGHTS
Discover the untold stories of emerging ASX stocks.
Daily news and expert analysis, it's free to subscribe.
By proceeding, you confirm you understand that we handle personal information in accordance with our Privacy Policy.


