Gold Digger: Price movements are the latest spectator sport

Pic: Getty Images
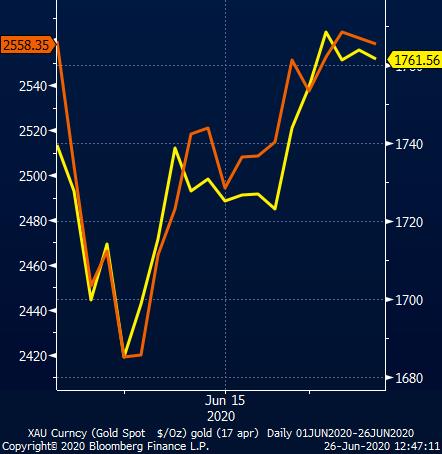
Bets are being taken on which way gold prices will go with safe haven investors clashing with those who believe the worst of the COVID-19 pandemic is over and markets are now in recovery mode.
Over the past three months, gold prices have ranged between $US1,700 and $US1,790 an ounce for the most part.
>>Scroll down for the top small cap movers over the past week>>>
“It’s a huge band, but it’s also telling of the dynamics in the market,” investing.com commodities analyst Barani Krishnan said.
“The variables range from the second wave of the pandemic and the dollar debasement that could come from the trillions the US has already thrown at the problem, to a V-shaped recovery and gigantic revaluations in asset pricing that could follow.
“There is absolutely no certainty where the swinging pendulum will ultimately rest, and that’s what makes gold such an interesting watch.”
In the US, the infection rate in Texas has doubled from 4.5 per cent to 9 per cent since late May, while concerns have been raised that the UK’s move to ease travel restrictions and reopen pubs and restaurants will lead to another wave of infections.
Gold bulls will also be buoyed by the US considering new tariffs on exports from the UK, Spain, France and Germany, adding to ongoing tensions between China and the US.
Meanwhile, market pundits point to progress in the development of potential vaccine candidates with volunteers testing a new vaccine in the UK.
UK researchers have identified an old anti-inflammatory drug that improves the chances of survival for those who need oxygen or ventilators to survive, while Australian researchers have found a potential blocker that prevents COVID-19 from replicating.
China’s rapid recovery to date and the slower rate of infections in Europe have also been singled out as reasons for a broader market recovery.
Winners & Losers
Here’s how ASX gold stocks performed for the period June 19 – June 26 [intraday]:
Scroll or swipe to reveal table. Click headings to sort. Best viewed on a laptop:
| CODE | COMPANY NAME | 1 WEEK RETURN | 1 YEAR RETURN | PRICE [INTRADAY FRI] | MARKET CAP |
|---|---|---|---|---|---|
| MCT | Metalicity | 133 | 366 | 2.8 | $40,500,000.00 |
| RXL | ROX RESOURCES LTD | 77 | 453 | 77 | $ 169,073,584.00 |
| RGL | RIVERSGOLD LTD | 74 | 402 | 74 | $ 20,955,988.00 |
| AUC | AUSGOLD LTD | 58 | 100 | 58 | $ 32,079,786.00 |
| GMR | GOLDEN RIM RESOURCES LTD | 57 | -8 | 57 | $ 15,475,676.00 |
| ARV | ARTEMIS RESOURCES LTD | 55 | 86 | 55 | $ 72,367,360.00 |
| HRN | HORIZON GOLD LIMITED | 42 | 118 | 42 | $ 28,316,328.00 |
| DEG | DE GREY MINING LTD | 42 | 1027 | 42 | $ 978,868,416.00 |
| GSM | GOLDEN STATE MINING LTD | 38 | 678 | 38 | $ 22,888,100.00 |
| BBX | BBX MINERALS LTD | 38 | -28 | 38 | $ 73,034,800.00 |
| VMC | VENUS METALS CORP LTD | 36 | 114 | 36 | $ 47,589,784.00 |
| ALK | ALKANE RESOURCES LTD | 35 | 183 | 35 | $ 684,439,296.00 |
| CDV | CARDINAL RESOURCES LTD | 33 | 88 | 33 | $ 312,515,328.00 |
| MDI | MIDDLE ISLAND RESOURCES LTD | 29 | 260 | 29 | $ 32,097,140.00 |
| AYR | ALLOY RESOURCES LTD | 27 | -5 | 27 | $ 6,036,623.00 |
| SIH | SIHAYO GOLD LTD | 25 | 114 | 25 | $ 62,933,100.00 |
| DGO | DGO GOLD LTD | 25 | 365 | 25 | $ 129,144,280.00 |
| TIE | TIETTO MINERALS LTD | 24 | 223 | 24 | $ 171,187,904.00 |
| STN | SATURN METALS LTD | 22 | 94 | 22 | $ 50,500,608.00 |
| RML | RESOLUTION MINERALS LTD | 22 | 134 | 22 | $ 19,198,332.00 |
| NES | NELSON RESOURCES LTD | 19 | 31 | 19 | $ 3,274,949.25 |
| CAI | CALIDUS RESOURCES LTD | 19 | 70 | 19 | $ 113,023,992.00 |
| HMX | HAMMER METALS LTD | 18 | 80 | 18 | $ 29,187,912.00 |
| WWI | WEST WITS MINING LTD | 18 | 86 | 18 | $ 12,277,515.00 |
| AOP | APOLLO CONSOLIDATED LTD | 18 | 53 | 18 | $ 79,383,200.00 |
| BC8 | BLACK CAT SYNDICATE LTD | 17 | 178 | 17 | $ 67,219,424.00 |
| OKU | OKLO RESOURCES LTD | 17 | 94 | 17 | $ 148,778,640.00 |
| TTM | TITAN MINERALS LTD | 17 | -59 | 17 | $ 74,457,448.00 |
| EMR | EMERALD RESOURCES NL | 16 | 34 | 16 | $ 275,256,544.00 |
| MOH | MOHO RESOURCES NL | 16 | 62 | 16 | $ 5,213,221.50 |
| GBZ | GBM RESOURCES LTD | 16 | 59 | 16 | $ 15,190,074.00 |
| GED | GOLDEN DEEPS LTD | 14 | -76 | 14 | $ 2,806,085.75 |
| BRV | BIG RIVER GOLD LTD | 14 | 60 | 14 | $ 40,857,512.00 |
| SAR | SARACEN MINERAL HOLDINGS LTD | 14 | 38 | 14 | $ 5,934,094,336.00 |
| RMS | RAMELIUS RESOURCES LTD | 14 | 168 | 14 | $ 1,732,802,048.00 |
| MTH | MITHRIL RESOURCES LTD | 13 | 240 | 13 | $ 31,627,984.00 |
| BGL | BELLEVUE GOLD LTD | 13 | 49 | 13 | $ 807,771,072.00 |
| SLZ | SULTAN RESOURCES LTD | 13 | 155 | 13 | $ 9,380,048.00 |
| TBR | TRIBUNE RESOURCES LTD | 12 | 29 | 12 | $ 372,523,360.00 |
| LNY | LANEWAY RESOURCES LTD | 11 | -50 | 11 | $ 18,600,330.00 |
| ARM | AURORA MINERALS LTD | 11 | 82 | 11 | $ 5,153,864.50 |
| NAG | NAGAMBIE RESOURCES LTD | 11 | 38 | 11 | $ 25,496,550.00 |
| MML | MEDUSA MINING LTD | 10 | 13 | 10 | $ 152,728,816.00 |
| TSC | TWENTY SEVEN CO LTD | 10 | 175 | 10 | $ 7,431,604.50 |
| HRZ | HORIZON MINERALS LTD | 10 | 10 | 10 | $ 52,092,148.00 |
| WAF | WEST AFRICAN RESOURCES LTD | 10 | 188 | 10 | $ 839,839,360.00 |
| CMM | CAPRICORN METALS LTD | 10 | 304 | 10 | $ 560,464,512.00 |
| GOR | GOLD ROAD RESOURCES LTD | 9 | 59 | 9 | $ 1,473,520,512.00 |
| AWV | ANOVA METALS LTD | 9 | 173 | 9 | $ 34,917,160.00 |
| PGI | PANTERRA GOLD LTD | 9 | 213 | 9 | $ 10,342,507.00 |
| CHN | CHALICE GOLD MINES LTD | 9 | 652 | 9 | $ 298,984,128.00 |
| RSG | RESOLUTE MINING LTD | 8 | -12 | 8 | $ 1,295,821,696.00 |
| MKG | MAKO GOLD LTD | 8 | -1 | 8 | $ 9,493,447.00 |
| PRU | PERSEUS MINING LTD | 8 | 103 | 8 | $ 1,495,111,040.00 |
| GBR | GREAT BOULDER RESOURCES LTD | 8 | -44 | 8 | $ 4,003,619.75 |
| PDI | PREDICTIVE DISCOVERY LTD | 8 | 461 | 8 | $ 71,678,104.00 |
| E2M | E2 METALS LTD | 8 | -28 | 8 | $ 15,372,421.00 |
| GML | GATEWAY MINING LTD | 8 | 40 | 8 | $ 21,433,856.00 |
| OAU | ORA GOLD LTD | 7 | 88 | 7 | $ 10,763,392.00 |
| PRX | PRODIGY GOLD NL | 7 | -51 | 7 | $ 29,612,008.00 |
| SLR | SILVER LAKE RESOURCES LTD | 7 | 60 | 7 | $ 1,821,277,312.00 |
| SBM | ST BARBARA LTD | 7 | 7 | 7 | $ 2,327,243,264.00 |
| NWM | NORWEST MINERALS LTD | 7 | -7 | 7 | $ 12,576,027.00 |
| WGX | WESTGOLD RESOURCES LTD | 7 | 9 | 7 | $ 916,102,016.00 |
| SVL | SILVER MINES LTD | 6 | 85 | 6 | $ 111,027,184.00 |
| BDC | BARDOC GOLD LTD | 6 | 58 | 6 | $ 115,844,352.00 |
| GMN | GOLD MOUNTAIN LTD | 6 | -24 | 6 | $ 34,727,608.00 |
| WMX | WILUNA MINING CORP LTD | 6 | 2 | 6 | $ 148,419,872.00 |
| TAR | TARUGA MINERALS LTD | 6 | -24 | 6 | $ 6,248,557.50 |
| BRB | BREAKER RESOURCES NL | 6 | -11 | 6 | $ 71,709,224.00 |
| KRM | KINGSROSE MINING LTD | 5 | 0 | 5 | $ 31,390,316.00 |
| NXM | NEXUS MINERALS LTD | 4 | -2 | 4 | $ 5,675,547.00 |
| NST | NORTHERN STAR RESOURCES LTD | 4 | 18 | 4 | $ 10,434,688,000.00 |
| KWR | KINGWEST RESOURCES LTD | 4 | 4 | 4 | $ 15,847,699.00 |
| AAR | ANGLO AUSTRALIAN RESOURCES | 4 | 133 | 4 | $ 67,321,496.00 |
| TLM | TALISMAN MINING LTD | 4 | 88 | 4 | $ 27,061,116.00 |
| HAW | HAWTHORN RESOURCES LTD | 4 | 179 | 4 | $ 48,359,764.00 |
| MAT | MATSA RESOURCES LTD | 3 | -3 | 3 | $ 35,195,444.00 |
| AGS | ALLIANCE RESOURCES LTD | 3 | 68 | 3 | $ 26,745,012.00 |
| RND | RAND MINING LTD | 3 | -37 | 3 | $ 120,296,952.00 |
| CWX | CARAWINE RESOURCES LTD | 3 | 59 | 3 | $ 13,135,708.00 |
| NCM | NEWCREST MINING LTD | 3 | -4 | 3 | $ 25,755,228,160.00 |
| BCN | BEACON MINERALS LTD | 3 | 27 | 3 | $ 111,640,592.00 |
| MAU | MAGNETIC RESOURCES NL | 3 | 214 | 3 | $ 248,894,704.00 |
| GSN | GREAT SOUTHERN MINING LTD | 2 | 209 | 2 | $ 39,585,288.00 |
| ADN | ANDROMEDA METALS LTD | 2 | 231 | 2 | $ 83,601,656.00 |
| CYL | CATALYST METALS LTD | 1 | 34 | 1 | $ 234,838,992.00 |
| CY5 | CYGNUS GOLD LTD | 1 | 129 | 1 | $ 4,845,827.00 |
| KCN | KINGSGATE CONSOLIDATED LTD | 1 | 54 | 1 | $ 90,490,376.00 |
| RRL | REGIS RESOURCES LTD | 1 | 4 | 1 | $ 2,728,929,024.00 |
| EVN | EVOLUTION MINING LTD | 0 | 26 | 0 | $ 9,561,762,816.00 |
| SFM | SANTA FE MINERALS LTD | 0 | -39 | 0 | $ 4,369,127.50 |
| A1G | AFRICAN GOLD LTD | 0 | -39 | 0 | $ 6,391,000.00 |
| DTR | DATELINE RESOURCES LTD | 0 | -33 | 0 | $ 12,315,117.00 |
| TRY | TROY RESOURCES LTD | 0 | -8 | 0 | $ 49,933,036.00 |
| SMI | SANTANA MINERALS LTD | 0 | -33 | 0 | $ 5,367,891.00 |
| GNM | GREAT NORTHERN MINERALS LTD | 0 | 50 | 0 | $ 11,553,394.00 |
| AMG | AUSMEX MINING GROUP LTD | 0 | -70 | 0 | $ 18,069,754.00 |
| TNR | TORIAN RESOURCES LTD | 0 | 170 | 0 | $ 12,028,131.00 |
| MSR | MANAS RESOUCES LTD | 0 | 50 | 0 | $ 13,215,812.00 |
| SPX | SPECTRUM METALS LTD | 0 | 660 | 0 | |
| CGN | CRATER GOLD MINING LTD | 0 | -29 | 0 | $ 12,274,959.00 |
| ANL | AMANI GOLD LTD | 0 | -67 | 0 | $ 6,834,496.50 |
| AVW | AVIRA RESOURCES LTD | 0 | 0 | 0 | $ 3,375,000.00 |
| TAM | TANAMI GOLD NL | 0 | 18 | 0 | $ 69,330,728.00 |
| MLL | MALI LITHIUM LTD | -1 | -29 | -1 | $ 31,734,812.00 |
| ARS | ALT RESOURCES LTD | -1 | 153 | -1 | $ 27,972,644.00 |
| DCN | DACIAN GOLD LTD | -1 | 27 | -1 | $ 255,881,792.00 |
| DGR | DGR GLOBAL LTD | -2 | -45 | -2 | $ 43,689,224.00 |
| BNR | BULLETIN RESOURCES LTD | -3 | 400 | -3 | $ 12,371,222.00 |
| GWR | GWR GROUP LTD | -3 | -54 | -3 | $ 15,536,469.00 |
| FML | FOCUS MINERALS LTD | -4 | -4 | -4 | $ 42,945,912.00 |
| ERM | EMMERSON RESOURCES LTD | -4 | 12 | -4 | $ 50,982,464.00 |
| NUS | NUSANTARA RESOURCES LTD | -5 | 55 | -5 | $ 67,846,176.00 |
| LEX | LEFROY EXPLORATION LTD | -5 | -14 | -5 | $ 20,599,782.00 |
| MEU | MARMOTA LTD | -5 | 211 | -5 | $ 48,187,356.00 |
| BYH | BRYAH RESOURCES LTD | -6 | -24 | -6 | $ 6,070,240.00 |
| KTA | KRAKATOA RESOURCES LTD | -6 | 23 | -6 | $ 7,218,750.00 |
| OKR | OKAPI RESOURCES LTD | -6 | -9 | -6 | $ 5,406,430.00 |
| AQI | ALICANTO MINERALS LTD | -7 | 33 | -7 | $ 14,441,208.00 |
| DAU | DAMPIER GOLD LTD | -7 | 0 | -7 | $ 8,039,580.00 |
| ARL | ARDEA RESOURCES LTD | -7 | -9 | -7 | $ 31,084,616.00 |
| AME | ALTO METALS LTD | -7 | 123 | -7 | $ 21,122,912.00 |
| NVA | NOVA MINERALS LTD | -10 | 160 | -10 | $ 58,006,848.00 |
| GUL | GULLEWA LTD | -10 | 258 | -10 | $ 13,790,022.00 |
| PUA | PURE ALUMINA LTD | -11 | -46 | -11 | $ 4,743,464.00 |
| CDT | CASTLE MINERALS LTD | -11 | 60 | -11 | $ 2,182,527.75 |
| SAU | SOUTHERN GOLD LTD | -11 | -4 | -11 | $ 16,682,738.00 |
| BAR | BARRA RESOURCES LTD | -13 | -39 | -13 | $ 10,140,768.00 |
| CXU | CAULDRON ENERGY LTD | -13 | 50 | -13 | $ 7,902,086.50 |
| VKA | VIKING MINES LTD | -14 | -33 | -14 | $ 1,882,307.13 |
| KGM | KALNORTH GOLD MINES LTD | -14 | 100 | -14 | $ 5,365,440.50 |
| ALY | ALCHEMY RESOURCES LTD | -14 | 56 | -14 | $ 11,010,487.00 |
| VAN | VANGO MINING LTD | -17 | -44 | -17 | $ 87,296,424.00 |
| DTM | DART MINING NL | -18 | -10 | -18 | $ 7,057,502.00 |
| CTO | CITIGOLD CORP LTD | -20 | -20 | -20 | $ 10,404,693.00 |
| ONX | ORMINEX LTD | -25 | -82 | -25 | $ 17,790,372.00 |
| AAJ | ARUMA RESOURCES LTD | -25 | 0 | -25 | $ 2,464,241.75 |
| DHR | DARK HORSE RESOURCES LTD | -25 | -63 | -25 | $ 5,888,126.00 |
| MLS | METALS AUSTRALIA LTD | -25 | 0 | -25 | $ 6,414,705.50 |
| TMX | TERRAIN MINERALS LTD | -38 | 150 | -38 | $ 4,338,966.00 |
| RED | RED 5 LTD | -38 | 3 | -38 | $ 430,945,984.00 |
TOP PERFORMERS
Metalicity (ASX:MCT) has been a shining star this week after reporting that initial holes in its 2020 drilling campaign highlighted the potential of its Kookynie project to be a prolific, open pittable gold mine.
Drilling at the Leipold prospect returned results of up to 4m at 16.3 grams per tonne (g/t) gold from 42m, including 3m at 20.7g/t gold from a depth of 42m.
It continues the company’s streak of successful drilling programs, with the assays from the remaining 33 holes over the Leipold and McTavish prospects likely to be closely watched.
Gold hits were also responsible for Rox Resources’ (ASX:RXL) strong performance this week.
Shallow infill drilling at its Grace prospect returned some very high-grade hits including 4m at 88.81g/t gold from 27m and 11m at 18.75g/t gold from 8m.
The latest results will be complemented by upcoming diamond drilling to define a maiden resource estimate.
Alkane Resources’ (ASX:ALK) infill drilling at its Tomingley gold project in New South Wales has also proved to be remarkably successful, returning thick high-grade intercepts.
Notable results from the Roswell and San Antonio deposits include 69m grading 9.12g/t gold from 218m and 7m at 7.67g/t gold from 186m respectively.
At Stockhead, we tell it like it is. While Metalicity and Rox Resources are Stockhead advertisers, they did not sponsor this article.
Related Topics

Related Stories


UNLOCK INSIGHTS
Discover the untold stories of emerging ASX stocks.
Daily news and expert analysis, it's free to subscribe.
By proceeding, you confirm you understand that we handle personal information in accordance with our Privacy Policy.


