Gold Digger: Old phones gathering dust? You’re sitting on a gold mine

Pic: Stockhead/ Images Via Getty
- 1 gram of gold can be recovered from about 41 recycled mobile phones
- Mint Innovation can recover $US12,000 worth of gold from one tonne of old circuit boards
- Gold trades sideways at ~$US1,850/oz
Our Gold Digger column wraps all the news driving ASX stocks with exposure to precious metals.
Gold’s nature is uniquely twofold – it acts both as a safe haven asset (via gold bar and coin purchases) and in practical applications, mostly jewellery and technology.
In 2021, the use of gold in the tech sector increased 9% to reach a three-year high of 330 tonnes (11.6Moz).
While technology demand is smaller than other sectors, its uses are far reaching and prevalent in a variety of electronics, from mobile devices, medical equipment, and cleantech.
How much gold is in my old mobile phone?
1 gram of gold can be recovered from about 41 recycled mobile phones, says Sandra Wilson, ‘urban miner’ and Professor of Ecological Metal Design at University of Dundee.
With the price of gold currently around A$2,600 per ounce — roughly $84 per gram — there’s about $2 worth of gold in every junked device.
MobileMuster reckons there is about 23.5 million mobiles still stored in our homes around the country.
If our loose grasp on the dark arts of mathematics is correct, that’s about 20,200oz of gold worth $52,520,000, just sitting there.
Companies are popping up all over the joint to take advantage of the recycling thematic.
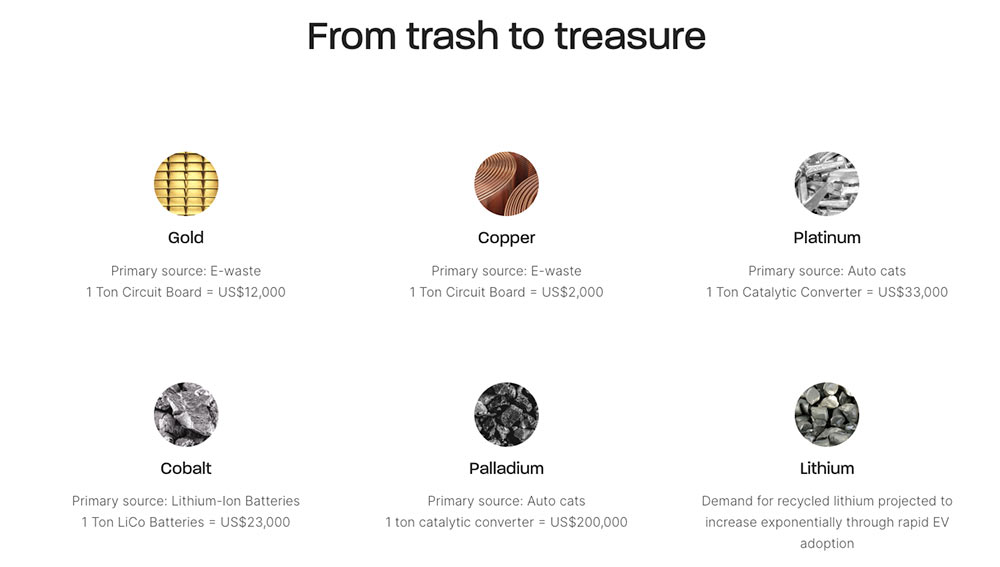
Like Mint Innovation, which reckons it can recover $US12,000 worth of gold from one tonne of old circuit boards.
And it’s not just gold, either. Electronics also contain silver, PGEs, glass, and aluminium, while their batteries contain graphene, nickel, cobalt, and lithium.
All recyclable.
Winners & Losers
Here’s how ASX-listed gold & silver stocks are performing:
Scroll or swipe to reveal table. Click headings to sort. Best viewed on a laptop
> Stocks missing from this list? Email [email protected]
| CODE | COMPANY | 1 WEEK RETURN % | 1 MONTH RETURN % | 6 MONTH RETURN % | 1YEAR RETURN % | PRICE | MARKET CAP |
|---|---|---|---|---|---|---|---|
| OKU | Oklo Resources | 84% | 64% | -2% | 9% | 0.1475 | $38,341,732.40 |
| BEZ | Besragoldinc | 80% | 48% | -33% | 0% | 0.09 | $14,950,946.52 |
| BBX | BBX Minerals | 44% | 4% | -24% | -50% | 0.13 | $52,902,469.63 |
| KCC | Kincora Copper | 29% | -5% | -20% | -71% | 0.0955 | $7,323,561.90 |
| SRN | Surefire Rescs NL | 28% | 32% | 242% | 64% | 0.041 | $52,574,073.61 |
| PUR | Pursuit Minerals | 28% | -21% | -32% | -70% | 0.023 | $20,802,082.27 |
| MTC | Metalstech | 27% | 71% | 71% | 326% | 0.445 | $72,499,096.65 |
| GED | Golden Deeps | 25% | 18% | 67% | 82% | 0.02 | $20,792,868.23 |
| KAU | Kaiser Reef | 24% | 0% | 5% | -33% | 0.21 | $27,188,849.94 |
| MEK | Meeka Gold Limited | 22% | 30% | 33% | -19% | 0.06 | $52,461,960.11 |
| CPM | Coopermetalslimited | 22% | 27% | 200% | 0% | 0.525 | $13,780,200.00 |
| OBM | Ora Banda Mining | 21% | -11% | -41% | -80% | 0.04 | $50,837,530.21 |
| TLM | Talisman Mining | 21% | 3% | 0% | -22% | 0.175 | $32,854,411.98 |
| AWJ | Auric Mining | 20% | 1% | -33% | -46% | 0.091 | $5,046,242.13 |
| FFX | Firefinch | 18% | 2% | 63% | 163% | 1.05 | $1,133,993,492.16 |
| EM2 | Eagle Mountain | 18% | 0% | -32% | -61% | 0.395 | $105,675,589.91 |
| CTO | Citigold Corp | 17% | -13% | -30% | -42% | 0.007 | $19,835,613.64 |
| XAM | Xanadu Mines | 17% | -18% | 4% | -54% | 0.028 | $40,955,546.24 |
| RDT | Red Dirt Metals | 16% | 4% | -17% | 290% | 0.585 | $174,877,424.58 |
| MGV | Musgrave Minerals | 16% | -13% | -12% | -33% | 0.295 | $158,466,019.96 |
| MEU | Marmota Limited | 16% | 31% | 52% | 52% | 0.067 | $68,605,692.12 |
| MI6 | Minerals260Limited | 15% | 7% | -25% | 0% | 0.485 | $96,800,000.00 |
| XTC | Xantippe Res | 15% | -18% | 188% | 475% | 0.0115 | $92,196,682.79 |
| BGD | Bartongoldholdings | 14% | 0% | 17% | 0% | 0.24 | $20,601,599.04 |
| OGC | OceanaGold Corp. | 14% | -1% | 25% | 22% | 3.36 | $229,210,362.02 |
| ZAG | Zuleika Gold | 14% | 22% | 83% | -6% | 0.0365 | $18,775,822.50 |
| ADN | Andromeda Metals | 13% | 10% | -35% | -45% | 0.11 | $325,944,685.40 |
| EMU | EMU NL | 13% | -15% | -23% | -63% | 0.017 | $9,896,660.71 |
| RED | Red 5 Limited | 13% | -1% | 51% | 140% | 0.4075 | $942,544,260.80 |
| PGD | Peregrine Gold | 13% | 3% | 33% | 51% | 0.52 | $18,951,901.16 |
| LYN | Lycaonresources | 13% | 2% | 4% | 0% | 0.44 | $12,985,500.00 |
| MOH | Moho Resources | 12% | -38% | -38% | -54% | 0.037 | $5,075,019.07 |
| GCY | Gascoyne Res | 12% | 5% | -11% | -53% | 0.29 | $121,388,354.25 |
| GCY | Gascoyne Res | 12% | 5% | -11% | -53% | 0.29 | $121,388,354.25 |
| A8G | Australasian Metals | 11% | -20% | -20% | 123% | 0.39 | $16,056,492.66 |
| KRM | Kingsrose Mining | 11% | -15% | -10% | 25% | 0.069 | $48,914,223.74 |
| GSR | Greenstone Resources | 10% | 66% | 83% | 152% | 0.053 | $46,739,138.14 |
| DRE | Dreadnought Resources | 10% | -2% | 0% | 72% | 0.043 | $122,063,392.69 |
| IVR | Investigator Res | 10% | -11% | -27% | -40% | 0.055 | $71,944,937.48 |
| GML | Gateway Mining | 10% | -8% | -27% | -54% | 0.011 | $22,601,063.67 |
| TTM | Titan Minerals | 10% | -12% | -12% | -30% | 0.08 | $112,777,642.64 |
| GMD | Genesis Minerals | 9% | -2% | -2% | 123% | 1.465 | $373,273,165.04 |
| PRU | Perseus Mining | 9% | 2% | 14% | 38% | 1.91 | $2,589,555,488.27 |
| MKG | Mako Gold | 9% | -5% | -20% | -10% | 0.084 | $32,108,294.57 |
| GMN | Gold Mountain | 9% | -14% | -67% | -85% | 0.006 | $7,158,895.02 |
| SPQ | Superior Resources | 9% | -12% | 112% | 227% | 0.036 | $59,542,714.63 |
| CHN | Chalice Mining | 9% | -4% | -31% | -26% | 6.235 | $2,183,394,365.10 |
| M2R | Miramar | 9% | -34% | -38% | -38% | 0.125 | $8,306,030.85 |
| VMC | Venus Metals Cor | 9% | -3% | 6% | 3% | 0.19 | $24,927,982.70 |
| RVR | Red River Resources | 9% | -21% | 0% | -14% | 0.19 | $98,508,252.72 |
| MEI | Meteoric Resources | 8% | -13% | -24% | -78% | 0.013 | $19,841,865.82 |
| PAK | Pacific American Hld | 8% | -24% | -24% | -30% | 0.013 | $6,212,406.23 |
| MM8 | Medallion Metals. | 8% | -5% | 24% | -10% | 0.26 | $24,919,319.16 |
| STN | Saturn Metals | 8% | 0% | -22% | -7% | 0.4 | $51,959,670.80 |
| GSM | Golden State Mining | 8% | -13% | -30% | -50% | 0.068 | $6,747,952.38 |
| AWV | Anova Metals | 8% | 8% | -30% | -30% | 0.014 | $20,973,318.80 |
| MEG | Megado | 8% | -15% | 40% | -13% | 0.14 | $5,811,587.73 |
| LRL | Labyrinth Resources | 8% | -33% | -20% | -44% | 0.028 | $25,764,319.27 |
| TSO | Tesoro Gold | 7% | -3% | -6% | -53% | 0.075 | $50,132,683.20 |
| EVN | Evolution Mining | 7% | -9% | -9% | -30% | 3.75 | $6,892,108,888.08 |
| SLZ | Sultan Resources | 7% | 0% | 3% | -44% | 0.155 | $12,909,080.30 |
| CAI | Calidus Resources | 7% | -8% | 43% | 112% | 0.88 | $362,067,307.20 |
| AAU | Antilles Gold | 6% | 5% | -12% | -4% | 0.066 | $23,678,132.39 |
| CHZ | Chesser Resources | 6% | -13% | -26% | -33% | 0.1 | $53,831,326.12 |
| RMX | Red Mount Min | 6% | -6% | -15% | -6% | 0.0085 | $14,781,274.72 |
| S2R | S2 Resources | 6% | 9% | -19% | 13% | 0.175 | $65,929,348.18 |
| ARV | Artemis Resources | 6% | -45% | -58% | -41% | 0.036 | $54,144,908.38 |
| DGO | DGO Gold Limited | 6% | -14% | -2% | -19% | 2.89 | $248,322,471.92 |
| CAZ | Cazaly Resources | 5% | -3% | -20% | -26% | 0.039 | $14,462,049.93 |
| AL8 | Alderan Resource | 5% | -17% | -41% | -66% | 0.02 | $7,660,189.44 |
| CLA | Celsius Resource | 5% | -9% | -23% | -51% | 0.02 | $24,429,315.36 |
| SFR | Sandfire Resources | 5% | 4% | -11% | -15% | 5.45 | $2,226,201,678.99 |
| YRL | Yandal Resources | 5% | -18% | -45% | -67% | 0.21 | $24,379,226.13 |
| GSN | Great Southern | 5% | -29% | -33% | -24% | 0.042 | $21,294,683.44 |
| ZNC | Zenith Minerals | 5% | -6% | 59% | 30% | 0.3825 | $132,403,099.68 |
| PRX | Prodigy Gold NL | 5% | -4% | -37% | -62% | 0.022 | $13,400,434.94 |
| DTR | Dateline Resources | 5% | -12% | 28% | 38% | 0.11 | $48,736,644.00 |
| RRL | Regis Resources | 5% | -3% | 4% | -25% | 2 | $1,517,100,358.98 |
| BTR | Brightstar Resources | 5% | -23% | -54% | -34% | 0.023 | $14,877,799.99 |
| BYH | Bryah Resources | 4% | -25% | -8% | -41% | 0.047 | $10,631,737.23 |
| HRN | Horizon Gold | 4% | -14% | -9% | -30% | 0.36 | $38,409,125.76 |
| BRB | Breaker Res NL | 4% | -6% | -30% | 30% | 0.24 | $73,314,209.03 |
| BGL | Bellevue Gold | 4% | -8% | 6% | -11% | 0.855 | $892,188,529.49 |
| GBZ | GBM Rsources | 4% | -11% | -11% | -27% | 0.098 | $49,155,275.80 |
| WRM | White Rock Min | 4% | -35% | -58% | -78% | 0.13 | $22,576,988.72 |
| SNG | Siren Gold | 4% | 3% | 4% | 30% | 0.39 | $33,775,969.20 |
| LM8 | Lunnonmetalslimited | 4% | -11% | 166% | 0% | 0.93 | $102,184,798.11 |
| KCN | Kingsgate Consolid. | 4% | 4% | 4% | 73% | 1.555 | $337,513,690.83 |
| MRR | Minrex Resources | 4% | -19% | 185% | 148% | 0.057 | $53,461,921.98 |
| DEG | De Grey Mining | 4% | -12% | -15% | -33% | 1.0725 | $1,507,462,571.75 |
| CWX | Carawine Resources | 4% | -31% | -29% | -43% | 0.145 | $20,675,152.05 |
| AAR | Astral Resources NL | 4% | -8% | -3% | -6% | 0.087 | $51,867,593.79 |
| AGC | AGC | 3% | -4% | -11% | -41% | 0.089 | $6,027,728.28 |
| ALK | Alkane Resources | 3% | 0% | 27% | 22% | 1.045 | $622,384,673.90 |
| GTR | Gti Resources | 3% | -21% | -31% | -19% | 0.0165 | $21,915,813.94 |
| WAF | West African Res | 3% | -3% | -6% | 13% | 1.2575 | $1,296,707,773.61 |
| TIE | Tietto Minerals | 3% | -15% | -1% | 14% | 0.4225 | $402,777,145.68 |
| SLR | Silver Lake Resource | 3% | -25% | -10% | -24% | 1.5375 | $1,432,460,184.54 |
| WGX | Westgold Resources. | 3% | -11% | -32% | -39% | 1.3775 | $665,262,113.23 |
| PNR | Pantoro Limited | 3% | -7% | -12% | 18% | 0.2825 | $425,255,868.99 |
| ASR | Asra Minerals | 3% | 27% | 65% | -12% | 0.038 | $50,919,081.16 |
| STK | Strickland Metals | 3% | 10% | 3% | 204% | 0.076 | $94,800,623.00 |
| SKY | SKY Metals | 3% | -16% | -7% | -53% | 0.08 | $30,142,677.60 |
| BNZ | Benzmining | 3% | -11% | -7% | -21% | 0.6 | $30,860,765.64 |
| PDI | Predictive Disc | 3% | 8% | -13% | 133% | 0.2 | $274,973,664.80 |
| EMR | Emerald Res NL | 3% | 3% | 15% | 26% | 1.22 | $705,684,106.05 |
| ADT | Adriatic Metals | 2% | -8% | -7% | -10% | 2.27 | $487,108,896.30 |
| NWM | Norwest Minerals | 2% | -18% | -41% | -54% | 0.046 | $8,307,939.80 |
| ARN | Aldoro Resources | 2% | -18% | -48% | -33% | 0.23 | $21,826,989.58 |
| NSM | Northstaw | 2% | -16% | -23% | -27% | 0.235 | $8,827,940.00 |
| GOR | Gold Road Res | 2% | -16% | -11% | -13% | 1.3175 | $1,175,336,317.61 |
| QML | Qmines Limited | 2% | -14% | -34% | -43% | 0.25 | $16,630,419.75 |
| AUT | Auteco Minerals | 2% | -30% | -31% | -44% | 0.052 | $109,567,014.90 |
| CEL | Challenger Exp | 2% | -17% | -11% | -8% | 0.275 | $271,098,667.26 |
| AUC | Ausgold Limited | 2% | -19% | 21% | 14% | 0.057 | $115,680,048.84 |
| IDA | Indiana Resources | 2% | -17% | -12% | -24% | 0.057 | $25,057,816.80 |
| TBA | Tombola Gold | 2% | 4% | 79% | 18% | 0.059 | $56,359,730.77 |
| NVA | Nova Minerals | 2% | -15% | -53% | -57% | 0.63 | $114,428,450.98 |
| RXL | Rox Resources | 2% | -13% | -11% | -34% | 0.335 | $54,905,807.78 |
| CMM | Capricorn Metals | 1% | -15% | 25% | 95% | 3.62 | $1,363,700,189.11 |
| RMS | Ramelius Resources | 1% | -11% | -20% | -34% | 1.2975 | $1,140,611,418.34 |
| SVL | Silver Mines Limited | 1% | -15% | -11% | -39% | 0.1875 | $245,448,107.17 |
| ARL | Ardea Resources | 1% | -30% | 129% | 150% | 1.17 | $195,198,437.80 |
| TCG | Turaco Gold Limited | 1% | -16% | -30% | -2% | 0.088 | $37,211,350.20 |
| SBM | St Barbara Limited | 1% | -12% | -15% | -37% | 1.2025 | $995,196,416.96 |
| BRV | Big River Gold | 1% | -2% | 48% | -15% | 0.3325 | $72,720,619.95 |
| SSR | SSR Mining Inc. | 1% | -7% | 9% | 15% | 27.7 | $541,811,871.72 |
| NST | Northern Star | 1% | -14% | -10% | -25% | 8.755 | $10,253,110,753.60 |
| NPM | Newpeak Metals | 0% | 0% | 0% | -50% | 0.001 | $8,862,850.03 |
| NMR | Native Mineral Res | 0% | -21% | -36% | -35% | 0.17 | $7,501,834.80 |
| AQX | Alice Queen | 0% | -38% | -50% | -64% | 0.005 | $8,497,573.38 |
| KSN | Kingston Resources | 0% | -18% | -25% | -39% | 0.135 | $53,660,027.07 |
| AMI | Aurelia Metals | 0% | -23% | -16% | -18% | 0.345 | $420,599,195.38 |
| PNX | PNX Metals Limited | 0% | 0% | -20% | -43% | 0.005 | $22,220,289.04 |
| TMX | Terrain Minerals | 0% | -9% | 11% | 0% | 0.01 | $7,607,610.09 |
| FAU | First Au | 0% | -7% | 18% | -28% | 0.013 | $10,645,842.34 |
| IPT | Impact Minerals | 0% | -13% | -19% | -29% | 0.011 | $25,190,308.24 |
| PUA | Peak Minerals | 0% | -13% | -2% | -13% | 0.014 | $15,620,561.27 |
| SMS | Starmineralslimited | 0% | 5% | 20% | 0% | 0.21 | $5,512,500.00 |
| RND | Rand Mining | 0% | -4% | 3% | 1% | 1.5 | $85,313,941.50 |
| AM7 | Arcadia Minerals | 0% | -25% | 5% | 0% | 0.22 | $8,048,275.00 |
| KAL | Kalgoorliegoldmining | 0% | -21% | -28% | 0% | 0.115 | $8,511,065.50 |
| SIH | Sihayo Gold Limited | 0% | 17% | -61% | -71% | 0.0035 | $14,741,845.65 |
| TRY | Troy Resources | 0% | 0% | 0% | -20% | 0.037 | $31,631,563.33 |
| KGM | Kalnorth Gold | 0% | 0% | 0% | 0% | 0.013 | $11,625,120.78 |
| CGN | Crater Gold Min | 0% | 0% | 0% | -11% | 0.017 | $21,063,473.65 |
| GUL | Gullewa Limited | 0% | -9% | -8% | -15% | 0.074 | $14,087,609.40 |
| CY5 | Cygnus Gold Limited | 0% | -15% | -19% | -3% | 0.145 | $17,107,870.68 |
| G50 | Gold50Limited | 0% | -13% | -24% | 0% | 0.21 | $11,763,780.21 |
| ADV | Ardiden | 0% | -20% | 0% | 20% | 0.012 | $29,351,688.92 |
| AGS | Alliance Resources | 0% | 0% | 5% | 2% | 0.175 | $40,953,448.03 |
| DDD | 3D Resources Limited | 0% | 0% | -25% | -40% | 0.003 | $14,636,552.32 |
| BCN | Beacon Minerals | 0% | -6% | 3% | -11% | 0.032 | $120,162,070.41 |
| MAU | Magnetic Resources | 0% | -3% | -10% | -2% | 1.4 | $312,958,232.51 |
| WWI | West Wits Mining | 0% | -10% | -21% | -67% | 0.027 | $44,117,579.06 |
| PF1 | Pathfinder Resources | 0% | 0% | 69% | 54% | 0.5 | $26,560,505.00 |
| FML | Focus Minerals | 0% | -17% | -36% | -34% | 0.19 | $53,013,349.33 |
| RDN | Raiden Resources | 0% | -31% | -52% | -54% | 0.011 | $15,550,193.54 |
| SFM | Santa Fe Minerals | 0% | -23% | -13% | 10% | 0.1 | $7,281,878.90 |
| X64 | Ten Sixty Four | 0% | -10% | -2% | -11% | 0.765 | $173,246,788.76 |
| HAW | Hawthorn Resources | 0% | -30% | 22% | 135% | 0.115 | $38,354,295.50 |
| TMZ | Thomson Res | 0% | -31% | -57% | -80% | 0.029 | $19,182,673.52 |
| WMC | Wiluna Mining Corp | 0% | -28% | -48% | -50% | 0.48251 | $101,961,574.11 |
| CDR | Codrus Minerals | 0% | -1% | -36% | 0% | 0.09 | $3,600,000.00 |
| BAT | Battery Minerals | 0% | -16% | -47% | -58% | 0.008 | $18,779,716.57 |
| POL | Polymetals Resources | 0% | 4% | -13% | 0% | 0.13 | $5,207,353.58 |
| HRZ | Horizon | 0% | 8% | -4% | 8% | 0.135 | $73,836,776.00 |
| LCY | Legacy Iron Ore | 0% | -4% | 4% | 71% | 0.024 | $153,763,828.78 |
| SBR | Sabre Resources | 0% | -17% | 0% | 0% | 0.005 | $13,945,824.27 |
| TG1 | Techgen Metals | 0% | 4% | -28% | -36% | 0.14 | $6,531,324.90 |
| A1G | African Gold . | 0% | -18% | -32% | -40% | 0.14 | $16,717,445.92 |
| OAU | Ora Gold Limited | 0% | -29% | -25% | -47% | 0.012 | $10,806,901.26 |
| GNM | Great Northern | 0% | 0% | -29% | -71% | 0.005 | $8,545,254.88 |
| DEX | Duke Exploration | 0% | -27% | -50% | -72% | 0.11 | $11,727,449.76 |
| DLC | Delecta Limited | 0% | 0% | -8% | 83% | 0.011 | $13,253,995.76 |
| ENR | Encounter Resources | 0% | -16% | -4% | -19% | 0.135 | $42,824,271.51 |
| ANL | Amani Gold | 0% | -25% | 50% | -25% | 0.0015 | $34,940,161.69 |
| AGG | AngloGold Ashanti | 0% | -12% | -11% | -26% | 4.95 | $441,578,436.75 |
| NCM | Newcrest Mining | -1% | -10% | 2% | -14% | 24.8 | $22,006,556,806.08 |
| AXE | Archer Materials | -1% | -17% | -40% | -7% | 0.725 | $177,225,053.01 |
| ERM | Emmerson Resources | -1% | -18% | 19% | 21% | 0.094 | $52,836,849.44 |
| ANX | Anax Metals | -1% | -20% | -7% | -16% | 0.084 | $36,038,534.40 |
| AME | Alto Metals Limited | -1% | -8% | -21% | -8% | 0.083 | $43,827,113.50 |
| KZR | Kalamazoo Resources | -1% | -18% | 0% | -23% | 0.34 | $51,906,988.71 |
| PGO | Pacgold | -2% | -14% | 39% | 0% | 0.6 | $32,977,089.00 |
| AZS | Azure Minerals | -2% | -16% | -21% | 6% | 0.28 | $83,898,644.67 |
| HAV | Havilah Resources | -2% | 46% | 42% | 6% | 0.27 | $85,196,858.18 |
| OKR | Okapi Resources | -2% | -26% | -46% | 14% | 0.25 | $26,942,009.79 |
| GBR | Greatbould Resources | -2% | -8% | -25% | -22% | 0.097 | $40,921,600.78 |
| MKR | Manuka Resources. | -2% | -20% | -38% | -39% | 0.225 | $24,813,123.72 |
| PNT | Panthermetals | -2% | -8% | 0% | 0% | 0.22 | $6,300,000.00 |
| VAN | Vango Mining | -2% | -22% | -27% | -39% | 0.043 | $54,177,318.18 |
| MVL | Marvel Gold Limited | -3% | -13% | -45% | -25% | 0.039 | $27,468,455.43 |
| CST | Castile Resources | -3% | 9% | -5% | -35% | 0.175 | $34,949,271.18 |
| MRZ | Mont Royal Resources | -3% | -11% | 0% | -10% | 0.32 | $21,786,684.08 |
| ASO | Aston Minerals | -3% | -7% | 22% | -18% | 0.14 | $153,239,158.52 |
| FG1 | Flynngold | -3% | -10% | -26% | 0% | 0.14 | $8,968,547.00 |
| TAM | Tanami Gold NL | -4% | -8% | -20% | -25% | 0.055 | $62,280,143.44 |
| ALY | Alchemy Resource | -4% | -16% | 108% | 62% | 0.027 | $25,732,999.54 |
| TBR | Tribune Res | -4% | -14% | -18% | -19% | 4.04 | $211,971,031.08 |
| NML | Navarre Minerals | -4% | -9% | 10% | -25% | 0.079 | $109,173,772.16 |
| KAI | Kairos Minerals | -4% | -10% | -7% | -24% | 0.026 | $54,938,617.75 |
| HCH | Hot Chili | -4% | -29% | -44% | -36% | 1.145 | $140,465,103.12 |
| ICL | Iceni Gold | -4% | -27% | -47% | -43% | 0.12 | $15,383,571.36 |
| GRL | Godolphin Resources | -4% | -18% | -21% | -32% | 0.115 | $9,673,862.79 |
| E2M | E2 Metals | -4% | -22% | -51% | -50% | 0.1725 | $33,852,494.91 |
| SMI | Santana Minerals | -4% | 22% | 200% | 683% | 0.9 | $114,068,067.68 |
| BC8 | Black Cat Syndicate | -4% | -23% | -27% | -42% | 0.425 | $75,191,962.20 |
| WCN | White Cliff Min | -5% | -25% | 17% | 31% | 0.021 | $13,072,067.24 |
| NAE | New Age Exploration | -5% | -19% | -5% | -38% | 0.0105 | $14,358,989.10 |
| TAR | Taruga Minerals | -5% | 5% | -52% | -78% | 0.021 | $11,560,964.80 |
| PNM | Pacific Nickel Mines | -5% | -35% | -21% | 35% | 0.0715 | $19,260,585.78 |
| BMR | Ballymore Resources | -5% | 8% | -9% | 0% | 0.2 | $15,063,006.61 |
| MZZ | Matador Mining | -5% | -22% | -46% | -57% | 0.19 | $42,416,303.48 |
| KTA | Krakatoa Resources | -5% | -35% | 32% | 36% | 0.075 | $26,542,663.61 |
| GIB | Gibb River Diamonds | -5% | -16% | -35% | -29% | 0.052 | $11,633,019.48 |
| NES | Nelson Resources. | -6% | -29% | -48% | -72% | 0.017 | $5,591,646.12 |
| SVY | Stavely Minerals | -6% | -12% | -36% | -47% | 0.33 | $84,812,471.90 |
| RSG | Resolute Mining | -6% | -14% | -22% | -51% | 0.2875 | $320,140,140.80 |
| G88 | Golden Mile Res | -6% | -26% | -2% | -18% | 0.049 | $9,575,432.86 |
| NAG | Nagambie Resources | -6% | 0% | -41% | -31% | 0.048 | $24,631,015.58 |
| ICG | Inca Minerals | -6% | -19% | -25% | -47% | 0.079 | $39,006,354.09 |
| CYL | Catalyst Metals | -6% | -16% | -29% | -25% | 1.55 | $152,606,951.90 |
| DCN | Dacian Gold | -6% | -26% | -13% | -39% | 0.1875 | $206,164,641.97 |
| LEX | Lefroy Exploration | -7% | -15% | -21% | -75% | 0.28 | $39,386,160.36 |
| CBY | Canterbury Resources | -7% | -7% | -38% | -42% | 0.056 | $6,899,117.68 |
| FEG | Far East Gold | -7% | -13% | 0% | 0% | 0.35 | $42,713,023.50 |
| HXG | Hexagon Energy | -7% | -39% | -69% | -71% | 0.027 | $13,848,729.33 |
| SAU | Southern Gold | -7% | -17% | -38% | -47% | 0.04 | $8,746,479.00 |
| DCX | Discovex Res | -7% | -19% | 30% | -7% | 0.0065 | $17,980,648.53 |
| MTH | Mithril Resources | -7% | -19% | -62% | -57% | 0.0065 | $20,441,631.29 |
| HMG | Hamelingoldlimited | -7% | -19% | -19% | 0% | 0.13 | $14,850,000.00 |
| THR | Thor Mining PLC | -7% | -19% | -7% | -19% | 0.013 | $13,753,238.41 |
| MDI | Middle Island Res | -7% | -13% | 30% | 18% | 0.13 | $16,526,459.97 |
| MAT | Matsa Resources | -7% | -24% | -4% | -34% | 0.052 | $19,024,594.86 |
| CDT | Castle Minerals | -8% | -26% | 28% | 118% | 0.037 | $35,981,747.42 |
| GWR | GWR Group | -8% | -25% | 12% | -50% | 0.12 | $38,545,998.60 |
| BNR | Bulletin Res | -8% | -25% | 117% | 144% | 0.165 | $46,414,576.00 |
| MBK | Metal Bank | -8% | -21% | -39% | -48% | 0.0055 | $13,039,090.80 |
| MXR | Maximus Resources | -9% | -23% | 2% | -20% | 0.064 | $20,981,780.69 |
| MHC | Manhattan Corp | -9% | -29% | 0% | -29% | 0.01 | $16,789,065.62 |
| KNB | Koonenberrygold | -9% | -10% | -40% | 0% | 0.09 | $6,728,317.92 |
| LCL | Los Cerros Limited | -9% | -37% | -55% | -65% | 0.059 | $38,388,282.45 |
| OZM | Ozaurum Resources | -9% | 26% | 34% | 15% | 0.195 | $10,298,880.00 |
| VRC | Volt Resources | -10% | -24% | -32% | -53% | 0.019 | $60,925,661.76 |
| GMR | Golden Rim Resources | -10% | -7% | -29% | -57% | 0.064 | $20,404,370.74 |
| PKO | Peako Limited | -10% | -5% | -22% | -54% | 0.018 | $5,552,173.82 |
| M24 | Mamba Exploration | -10% | -32% | -53% | -60% | 0.099 | $4,217,500.30 |
| AQI | Alicanto Min | -10% | -28% | -47% | -38% | 0.071 | $27,243,666.81 |
| VKA | Viking Mines | -11% | -27% | -56% | -72% | 0.008 | $8,202,067.45 |
| SI6 | SI6 Metals Limited | -11% | -20% | -20% | -30% | 0.008 | $12,853,295.87 |
| RDS | Redstone Resources | -11% | -27% | -43% | -50% | 0.008 | $5,157,826.77 |
| DTM | Dart Mining NL | -11% | -8% | -26% | -48% | 0.07 | $9,468,211.20 |
| PRS | Prospech Limited | -13% | -25% | -43% | -71% | 0.042 | $2,737,602.21 |
| RGL | Riversgold | -13% | -35% | 132% | 8% | 0.042 | $24,857,905.09 |
| NXM | Nexus Minerals | -13% | -14% | -44% | 209% | 0.275 | $78,212,393.37 |
| KWR | Kingwest Resources | -13% | -25% | -44% | 50% | 0.135 | $34,016,223.50 |
| CXU | Cauldron Energy | -13% | -13% | -52% | -68% | 0.013 | $6,960,346.60 |
| HMX | Hammer Metals | -14% | -33% | 36% | -40% | 0.06 | $43,194,715.02 |
| TRM | Truscott Mining Corp | -14% | 0% | 60% | 30% | 0.048 | $7,293,194.11 |
| AYM | Australia United Min | -14% | 0% | -40% | -33% | 0.006 | $11,055,464.91 |
| AAJ | Aruma Resources | -16% | -31% | -6% | 5% | 0.066 | $10,987,305.21 |
| MCT | Metalicity Limited | -17% | -35% | -42% | -63% | 0.005 | $13,027,988.20 |
| BMO | Bastion Minerals | -18% | -28% | -42% | -28% | 0.14 | $10,630,096.40 |
| LNY | Laneway Res | -20% | -20% | -30% | -7% | 0.004 | $31,510,082.05 |
| AVW | Avira Resources | -20% | -33% | -33% | -33% | 0.004 | $8,475,160.00 |
| REZ | Resourc & En Grp | -21% | -25% | -30% | 18% | 0.033 | $15,493,979.46 |
| RML | Resolution Minerals | -21% | -27% | -41% | -56% | 0.011 | $8,204,582.47 |
| MLS | Metals Australia | -23% | -43% | 113% | 113% | 0.085 | $38,715,217.69 |
| TSC | Twenty Seven Co. | -25% | -25% | -25% | -25% | 0.003 | $7,982,441.72 |
SMALL CAP STANDOUTS
+1Mozpa miner B2Gold will acquire neighbouring 668,000oz Mali gold explorer OKU for an implied 17.25c per share.
That’s a 127% premium to OKU’s last closing price, and premium to any closing share price over the past 12 months.
The implied consideration breaks down into 0.0206 B2Gold shares and A$0.0525 cash per Oklo share.
While long term shareholders would be taking a haircut on the deal, post-coup Mali is a fairly risky jurisdiction for a junior to be operating in. The OKU board – which unanimously recommends the transaction – says the deal is “mutually beneficial”.
“The B2Gold proposal was welcomed by the Oklo directors and comes at an opportune time for Oklo shareholders to crystallise value and de-risk their investment in the company,” OKU Simon Taylor says.
“Whilst the Oklo team continues to see significant potential in the Dandoko Project and the region generally, Dandoko is at an inflection point and this transaction removes the risks associated with project development, future capital raisings and other risks faced by a junior gold explorer in a foreign jurisdiction.
“Considering B2Gold’s compelling offer along with the risks involved in Oklo pursuing a ‘go it alone’ strategy, the board has resolved that the opportunity to combine with a well-funded, substantial multi-asset gold producer represents a highly attractive outcome for Oklo shareholders.”
Gold explorer BEZ mooned last week on no news, before being placed in a trading halt by the ASX police.
In response to a Price and Volume Query, BEZ maintains that the results on ongoing drilling have not been leaked.
“All computers at the Bau office are password locked to prevent unauthorised access,” it says as part of a very detailed response.
“Only the QA/QC geologist and geologists working on the specific cores have access to the computer system, and all staff and consultants are subject to confidentiality agreements.”
BEZ’s substantial 3.3Moz ‘Bau’ gold project in Malaysia also includes an additional 4.9Moz – 9.3Moz exploration target.
Eight holes have now been successfully completed at the ‘Jugan’ prospect with assays for seven holes reported to date and a further 11 holes pending release.
These were anticipated to be received progressively from the end of last week, BEZ says, but are now overdue because of lab backlogs.
Drilling has now moved to the 644,000oz ‘Bekajang’ prospect to grow that resource.
Related Topics

Related Stories


UNLOCK INSIGHTS
Discover the untold stories of emerging ASX stocks.
Daily news and expert analysis, it's free to subscribe.
By proceeding, you confirm you understand that we handle personal information in accordance with our Privacy Policy.


