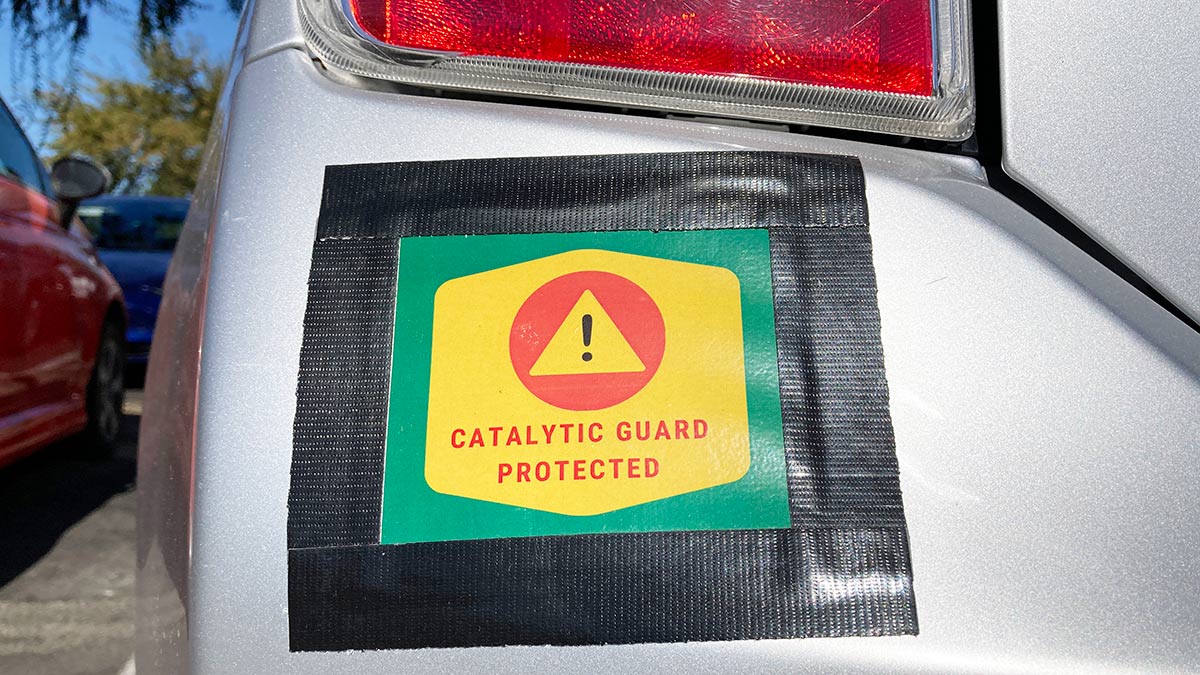
Gold Digger: Lock up your catalytic convertor, PGM demand is about to go through the roof
iStock / Getty Images Plus/ Michael Vi
Platinum group metals (PGMs) — platinum, palladium, rhodium, iridium, ruthenium and osmium — are highly valued for their wide range of industrial, medical, and electronic applications.
The biggest demand sector for PGMs is ‘auto catalysts’ in car exhausts which reduce polluting emissions in ICE and hybrid vehicles.
These auto catalysts, or catalytic convertors, account for 40% and 80% of annual platinum and palladium production, respectively.
Last year, the theft of catalytic converters from car exhausts escalated as the price of platinum group metals (PGMs) hit record highs.
Stolen converters were selling for between $US50 and $US1,600 on the black market. It was getting so bad some car owners were taking matters into their own hands.
Platinum currently sells for $US1,035/oz, which is chump change next to palladium ($US1,982) and rhodium ($US15,650/oz).
These prices are well down on all-time highs hit mid 2021, as the global semiconductor shortage forced car makers slash more than 11 million light vehicles from production plans when comparing Q4 2021 to Q4 2020.
In September, German chemicals firm Heraeus said the loss of 7mn light vehicles equates to “a reduction in demand of almost 1mn oz palladium and over 100,000oz of rhodium”.
Auto catalyst demand to hit record highs in 2022
In 2022, Metals Focus expects Total PGM demand to grow 11%, breaching 12.8Moz. That’s a record high.
“This is 1.2Moz more than 2021 and 200koz higher than pre-pandemic levels, despite expectations that vehicle numbers will still be lower than in 2019,” it says.
This demand growth will be driven by two key factors: a 12.2% year-on-year growth in car production, and tighter emissions legislation in major markets.
Tighter emissions standards = more PGMs in your catalytic convertor. Or something like that.
Turning to the individual metals, platinum will lead the charge with demand growing 20% in 2022.
“With platinum still trading at a meaningful discount to palladium, we will continue to see the deployment of tri-metal catalyst technology, which contains an increased share of platinum,” Metals Focus says.
“Platinum demand in China will also be supported by tightening emissions legislation for heavy duty and offroad vehicles.”
Palladium demand is expected to increase by almost 650koz or 8% y/y in 2022.
Rhodium autocatalyst demand will be returning to all-time highs in 2022. The longer-term outlook is also rosy.
“… the metal is unparalleled at NOx abatement,” Metals Focus says.
“As NOx emission limits across emerging markets continue to converge to European and US standards, higher rhodium loadings are needed, and this is also expected to contribute to demand growth for this metal.”
Gold breaches $US1,840/oz
Gold miners went wild this week as prices hit US$1842/oz on Thursday, the highest level in two months.
In fact, the entire precious metals complex made big gains:
Precious Metals:
Gold +1.5%
Silver +3%
Platinum +5%
Palladium +6% pic.twitter.com/zxjNBg1nH3
— Peter ⚒ Spina | Gold & Silver Maximalist (@goldseek) January 19, 2022
Gold is slowly getting its groove back as Treasury yields continue to edge lower from recent highs, says OANDA senior market analyst Edward Moya.
“A big wild card for gold is what will happen with Russia-Ukraine tensions…the risks are growing and a small-scale attack could happen,” he says.
“Geopolitical risks and surging global inflation should keep on providing gold underlying support going forward.
“Gold’s next upside target includes the $1880 level, followed by the psychological $1,900 level.”
Winners & Losers
Here’s how ASX-listed precious metals stocks are performing:
Scroll or swipe to reveal table. Click headings to sort. Best viewed on a laptop.
| CODE | COMPANY | 1 WEEK RETURN % | 1 MONTH RETURN % | 6 MONTH RETURN % | 1 YEAR RETURN % | PRICE | MARKET CAP |
|---|---|---|---|---|---|---|---|
| ZAG | Zuleika Gold | 110% | 110% | 40% | -14% | 0.042 | $17,223,921.67 |
| BNR | Bulletin Res | 63% | 120% | 142% | 79% | 0.145 | $40,245,848.67 |
| LM8 | Lunnonmetals | 61% | 123% | 98% | 0% | 0.86 | $72,387,147.42 |
| RXL | Rox Resources | 37% | 37% | 19% | -18% | 0.48 | $79,591,845.07 |
| TNR | Torian Resources | 36% | 50% | 15% | 7% | 0.03 | $37,061,431.16 |
| ADV | Ardiden | 35% | 59% | 119% | -42% | 0.0175 | $41,198,371.76 |
| M24 | Mamba Exploration | 33% | 30% | 26% | 0% | 0.24 | $9,438,000.72 |
| ANL | Amani Gold | 33% | 33% | 100% | 33% | 0.002 | $45,751,128.21 |
| MHC | Manhattan Corp | 28% | 23% | 23% | -43% | 0.016 | $22,894,180.40 |
| CLA | Celsius Resource | 28% | 68% | 3% | -37% | 0.032 | $36,889,232.84 |
| TMZ | Thomson Res | 27% | 35% | -30% | -26% | 0.081 | $47,197,670.94 |
| A1G | African Gold | 26% | 26% | 33% | 21% | 0.24 | $27,349,375.44 |
| ASO | Aston Minerals | 26% | 38% | 4% | 272% | 0.145 | $147,900,601.50 |
| AVW | Avira Resources | 25% | 0% | 0% | -38% | 0.005 | $8,593,950.00 |
| ARL | Ardea Resources | 25% | 34% | 41% | 44% | 0.635 | $92,322,095.64 |
| ZNC | Zenith Minerals | 24% | 67% | 44% | 200% | 0.36 | $128,926,558.13 |
| SI6 | SI6 Metals | 22% | 22% | -15% | -52% | 0.011 | $15,709,583.84 |
| SBR | Sabre Resources | 22% | 22% | 38% | -31% | 0.0055 | $8,639,068.25 |
| SAU | Southern Gold | 20% | 12% | -3% | -40% | 0.066 | $14,079,697.90 |
| MRR | Minrex Resources | 20% | 91% | 272% | 168% | 0.067 | $51,208,059.72 |
| NML | Navarre Minerals | 19% | 29% | 3% | -52% | 0.093 | $128,279,182.29 |
| PAK | Pacific American Hld | 19% | 19% | 13% | -22% | 0.019 | $9,079,670.64 |
| G88 | Golden Mile Res | 18% | 4% | -2% | 6% | 0.053 | $10,035,063.02 |
| BTR | Brightstar Resources | 17% | 56% | 150% | 6% | 0.07 | $35,545,956.49 |
| EMU | EMU NL | 16% | 22% | -24% | -54% | 0.022 | $11,546,104.16 |
| DEG | De Grey Mining | 15% | 25% | 18% | 44% | 1.38 | $2,025,249,876.00 |
| RMX | Red Mount Min | 15% | 28% | 28% | -12% | 0.0115 | $17,573,499.62 |
| XTC | Xantippe Res | 15% | 130% | 475% | 475% | 0.0115 | $67,840,029.83 |
| CDT | Castle Minerals | 15% | 100% | 229% | 360% | 0.046 | $41,972,475.34 |
| BMO | Bastion Minerals | 15% | -15% | 15% | 0% | 0.195 | $14,611,205.70 |
| LEX | Lefroy Exploration | 15% | 20% | -48% | 58% | 0.355 | $53,973,627.16 |
| BMR | Ballymore Resources | 14% | -7% | 0% | 0% | 0.2 | $14,695,616.20 |
| VKA | Viking Mines | 14% | -6% | -11% | -58% | 0.016 | $17,429,393.33 |
| WWI | West Wits Mining | 14% | 11% | -50% | -38% | 0.041 | $79,043,995.82 |
| LRL | Labyrinth Resources | 14% | 14% | 3% | 0% | 0.041 | $36,086,789.76 |
| SRN | Surefire Rescs NL | 14% | 25% | -11% | -48% | 0.0125 | $14,356,035.32 |
| WCN | White Cliff Min | 14% | 47% | 79% | -32% | 0.025 | $14,829,909.98 |
| AUT | Auteco Minerals | 13% | 21% | -32% | -26% | 0.085 | $151,936,104.24 |
| FG1 | Flynngold | 13% | 16% | 6% | 0% | 0.18 | $12,052,849.50 |
| RML | Resolution Minerals | 13% | 20% | -28% | -50% | 0.018 | $10,830,048.88 |
| KTA | Krakatoa Resources | 12% | 22% | 10% | -21% | 0.055 | $17,682,595.02 |
| NES | Nelson Resources. | 12% | 23% | -19% | -53% | 0.037 | $6,411,642.44 |
| A8G | Australasian Metals | 12% | 23% | 364% | 0% | 0.65 | $26,914,230.98 |
| SVL | Silver Mines | 12% | 18% | 2% | 4% | 0.235 | $310,039,714.32 |
| IPT | Impact Minerals | 12% | 12% | 12% | -3% | 0.0145 | $28,333,128.87 |
| MKR | Manuka Resources. | 11% | 10% | 31% | -11% | 0.34 | $35,014,416.74 |
| ANX | Anax Metals | 11% | 20% | 42% | 104% | 0.098 | $34,221,323.14 |
| AQX | Alice Queen | 11% | 0% | -23% | -68% | 0.01 | $13,702,230.10 |
| AWV | Anova Metals | 11% | 11% | 11% | -26% | 0.02 | $28,661,884.00 |
| VMC | Venus Metals Cor | 11% | 21% | 5% | -2% | 0.2 | $30,215,736.60 |
| PF1 | Pathfinder Resources | 11% | 38% | 27% | 27% | 0.4 | $20,185,983.80 |
| DGO | DGO Gold | 11% | 10% | -12% | 1% | 2.94 | $250,431,336.00 |
| AAJ | Aruma Resources | 11% | 33% | 58% | 3% | 0.093 | $14,485,572.85 |
| AL8 | Alderan Resource | 11% | -6% | -38% | -74% | 0.031 | $12,341,416.32 |
| RGL | Riversgold | 11% | 31% | -45% | -60% | 0.021 | $7,676,801.72 |
| GSM | Golden State Mining | 10% | 29% | -27% | -35% | 0.11 | $10,385,998.13 |
| GBR | Greatbould Resources | 10% | 22% | 94% | 245% | 0.165 | $60,730,087.53 |
| SPQ | Superior Resources | 10% | 167% | 273% | 180% | 0.056 | $90,208,243.09 |
| DEX | Duke Exploration | 10% | -8% | -48% | -46% | 0.17 | $15,335,895.84 |
| PNM | Pacific Nickel Mines | 10% | 40% | 121% | 117% | 0.115 | $31,156,816.49 |
| AWJ | Auric Mining | 9% | 14% | -17% | 0% | 0.12 | $6,447,976.06 |
| WGX | Westgold Resources. | 9% | 5% | 11% | -15% | 2.05 | $859,502,255.32 |
| TCG | Turaco Gold | 9% | 4% | 39% | 79% | 0.125 | $56,488,430.98 |
| GSN | Great Southern | 9% | 7% | 3% | -22% | 0.063 | $34,071,493.50 |
| M2R | Miramar | 9% | -14% | 6% | -34% | 0.19 | $8,966,703.60 |
| GBZ | GBM Rsources | 8% | 13% | -7% | -7% | 0.13 | $66,405,209.91 |
| THR | Thor Mining PLC | 8% | -7% | -13% | -35% | 0.013 | $11,897,043.15 |
| NAG | Nagambie Resources | 8% | 2% | -28% | 44% | 0.065 | $31,495,737.80 |
| ALY | Alchemy Resource | 8% | 18% | -5% | -26% | 0.013 | $12,380,483.57 |
| RMS | Ramelius Resources | 8% | 2% | -8% | -1% | 1.58 | $1,344,446,918.95 |
| HMX | Hammer Metals | 8% | 38% | -25% | -27% | 0.066 | $57,864,618.23 |
| HRZ | Horizon | 8% | 4% | 17% | 17% | 0.135 | $75,256,714.00 |
| CAI | Calidus Resources | 8% | 38% | 73% | 73% | 0.82 | $340,225,261.90 |
| KAU | Kaiser Reef | 8% | 20% | -18% | -48% | 0.21 | $26,932,557.08 |
| BBX | BBX Minerals | 7% | 14% | -24% | -51% | 0.1825 | $82,803,865.50 |
| PRS | Prospech | 7% | -2% | -54% | -71% | 0.06 | $3,910,860.30 |
| MZZ | Matador Mining | 7% | 15% | -6% | 21% | 0.375 | $78,832,160.17 |
| KNB | Koonenberrygold | 7% | -14% | 0% | 0% | 0.155 | $11,488,015.34 |
| MAT | Matsa Resources | 7% | 9% | -14% | -37% | 0.063 | $21,896,231.82 |
| MEU | Marmota | 7% | 14% | -4% | -2% | 0.049 | $51,944,309.75 |
| NST | Northern Star | 6% | 5% | -4% | -27% | 9.77 | $11,331,666,966.27 |
| IVR | Investigator Res | 6% | 8% | 0% | -15% | 0.069 | $92,956,262.49 |
| CWX | Carawine Resources | 6% | 0% | -17% | -30% | 0.175 | $23,858,510.73 |
| HAW | Hawthorn Resources | 6% | 25% | 128% | 0% | 0.105 | $31,683,983.24 |
| NWM | Norwest Minerals | 6% | 11% | -10% | -20% | 0.071 | $13,184,332.83 |
| CY5 | Cygnus Gold | 6% | 6% | 29% | 0% | 0.18 | $20,953,432.98 |
| MEG | Megado | 6% | -10% | -25% | -51% | 0.09 | $3,745,245.43 |
| MEI | Meteoric Resources | 6% | 12% | -62% | -73% | 0.019 | $28,999,650.05 |
| SLR | Silver Lake Resource | 5% | 10% | 4% | 9% | 1.85 | $1,633,683,284.78 |
| CST | Castile Resources | 5% | -3% | 3% | -11% | 0.195 | $39,942,024.20 |
| CMM | Capricorn Metals | 5% | 14% | 100% | 115% | 3.52 | $1,321,990,395.81 |
| BYH | Bryah Resources | 5% | 23% | 5% | -13% | 0.059 | $13,120,016.15 |
| BGD | Bartongoldholdings | 5% | 11% | 11% | 0% | 0.21 | $19,743,199.08 |
| RVR | Red River Resources | 5% | 14% | 2% | -22% | 0.21 | $106,285,220.04 |
| RRL | Regis Resources | 5% | 14% | -19% | -41% | 2.1 | $1,585,030,225.80 |
| TTM | Titan Minerals | 5% | 15% | -8% | -4% | 0.11 | $162,117,861.30 |
| ADN | Andromeda Metals | 5% | 25% | 50% | -18% | 0.225 | $608,513,126.27 |
| MXR | Maximus Resources | 4% | 4% | 1% | -44% | 0.073 | $24,478,725.35 |
| GOR | Gold Road Res | 4% | 1% | 15% | 25% | 1.5325 | $1,331,696,053.16 |
| SKY | SKY Metals | 4% | 25% | 26% | -34% | 0.125 | $52,749,685.80 |
| KCN | Kingsgate Consolid. | 4% | 20% | 172% | 126% | 2.26 | $506,823,837.37 |
| SNG | Siren Gold | 4% | 0% | 19% | -57% | 0.285 | $24,909,777.29 |
| KAI | Kairos Minerals | 4% | 12% | 0% | -6% | 0.029 | $58,862,804.73 |
| AGS | Alliance Resources | 3% | 0% | -6% | -17% | 0.15 | $31,202,570.10 |
| XAM | Xanadu Mines | 3% | 7% | -14% | -17% | 0.03 | $40,435,128.00 |
| TRN | Torrens Mining | 3% | -18% | -30% | -34% | 0.155 | $11,494,714.77 |
| BCN | Beacon Minerals | 3% | 0% | -6% | 1% | 0.033 | $122,103,009.73 |
| TLM | Talisman Mining | 3% | 10% | -6% | 77% | 0.17 | $34,731,806.95 |
| KZR | Kalamazoo Resources | 3% | 3% | 1% | -37% | 0.375 | $53,721,918.38 |
| TSO | Tesoro Resources | 3% | 3% | -52% | -72% | 0.08 | $47,685,061.30 |
| SLZ | Sultan Resources | 3% | 21% | 11% | -5% | 0.205 | $14,254,549.75 |
| SMS | Starminerals | 2% | 2% | 0% | 0% | 0.21 | $5,512,500.00 |
| LYN | Lycaonresources | 2% | 23% | 0% | 0% | 0.43 | $11,880,000.00 |
| KLA | Kirkland Lake Gold | 2% | 4% | 7% | 7% | 58 | $58,700,000.00 |
| DTM | Dart Mining NL | 2% | 12% | -31% | -50% | 0.093 | $11,577,656.49 |
| MML | Medusa Mining | 2% | 4% | -20% | -6% | 0.73 | $153,887,662.74 |
| BRV | Big River Gold | 2% | 21% | -38% | -29% | 0.255 | $55,957,825.26 |
| ADT | Adriatic Metals | 2% | 7% | 8% | 26% | 2.64 | $565,785,507.60 |
| AM7 | Arcadia Minerals | 2% | 41% | 67% | 0% | 0.275 | $10,340,227.50 |
| RED | Red 5 | 2% | 0% | 63% | 15% | 0.285 | $695,126,392.34 |
| OZM | Ozaurum Resources | 2% | 14% | 10% | 0% | 0.1425 | $8,153,280.00 |
| OBM | Ora Banda Mining | 2% | -6% | -59% | -82% | 0.061 | $63,324,592.83 |
| EVN | Evolution Mining | 2% | 3% | -3% | -13% | 4.075 | $7,606,981,884.45 |
| MOH | Moho Resources | 2% | 7% | -3% | -27% | 0.064 | $8,049,625.73 |
| IDA | Indiana Resources | 2% | 3% | -6% | -9% | 0.064 | $27,836,605.44 |
| KSN | Kingston Resources | 2% | 5% | -21% | -35% | 0.1625 | $60,639,774.69 |
| NCM | Newcrest Mining | 1% | 4% | -4% | -7% | 25.04 | $20,898,831,269.05 |
| DTR | Dateline Resources | 1% | -8% | -26% | 4% | 0.078 | $38,100,062.69 |
| SBM | St Barbara | 1% | 1% | -27% | -40% | 1.3875 | $1,007,528,409.58 |
| DCN | Dacian Gold | 1% | 26% | -25% | -59% | 0.2075 | $227,866,183.23 |
| AMI | Aurelia Metals | 1% | 6% | -1% | 3% | 0.45 | $581,416,534.79 |
| BDC | Bardoc Gold | 1% | 1% | 20% | -10% | 0.475 | $139,547,497.44 |
| KRM | Kingsrose Mining | 1% | 20% | 73% | 126% | 0.095 | $74,648,651.80 |
| AGC | AGC | 1% | 0% | -36% | -52% | 0.099 | $6,637,273.83 |
| AGC | AGC | 1% | 0% | -36% | -52% | 0.099 | $6,637,273.83 |
| BGL | Bellevue Gold | 1% | 0% | -12% | -22% | 0.8375 | $886,919,445.66 |
| RSG | Resolute Mining | 1% | -8% | -43% | -50% | 0.3525 | $397,415,347.20 |
| FFX | Firefinch | 0% | 10% | 88% | 295% | 0.75 | $930,727,598.00 |
| DCX | Discovex Res | 0% | 120% | 83% | 10% | 0.011 | $28,255,304.84 |
| TMX | Terrain Minerals | 0% | 0% | 0% | -20% | 0.008 | $5,886,088.07 |
| FAU | First Au | 0% | 33% | 0% | -33% | 0.012 | $10,190,842.34 |
| PUA | Peak Minerals | 0% | 30% | -6% | -38% | 0.015 | $15,620,539.80 |
| AAU | Antilles Gold | 0% | 6% | -5% | -8% | 0.076 | $23,408,382.00 |
| DRE | Drednought Resources | 0% | 14% | -7% | 74% | 0.04 | $119,161,709.14 |
| MLS | Metals Australia | 0% | 33% | 0% | -20% | 0.002 | $10,477,114.72 |
| WRM | White Rock Min | 0% | -2% | -51% | -58% | 0.235 | $35,682,581.89 |
| MCT | Metalicity | 0% | 0% | -25% | -50% | 0.009 | $22,503,846.33 |
| CTO | Citigold Corp | 0% | 0% | -25% | -31% | 0.009 | $22,669,272.73 |
| GRL | Godolphin Resources | 0% | -3% | -20% | -43% | 0.14 | $11,775,591.94 |
| TRY | Troy Resources | 0% | 0% | -10% | -59% | 0.037 | $31,631,563.33 |
| KGM | Kalnorth Gold | 0% | 0% | 0% | 0% | 0.013 | $11,625,120.78 |
| CGN | Crater Gold Min | 0% | 0% | 0% | -19% | 0.017 | $20,867,429.74 |
| MGV | Musgrave Minerals | 0% | -3% | -7% | -13% | 0.33 | $177,267,073.17 |
| NAE | New Age Exploration | 0% | 60% | 23% | 14% | 0.016 | $24,410,281.47 |
| EMR | Emerald Res NL | 0% | 7% | 28% | 40% | 1.14 | $613,048,003.98 |
| GMN | Gold Mountain | 0% | 0% | -44% | -66% | 0.014 | $14,982,088.38 |
| FML | Focus Minerals | 0% | 8% | 8% | -28% | 0.28 | $53,910,826.68 |
| GSR | Greenstone Resources | 0% | 7% | 38% | 16% | 0.029 | $23,405,281.98 |
| ARV | Artemis Resources | 0% | 8% | 34% | -47% | 0.071 | $92,869,826.17 |
| AUC | Ausgold | 0% | 1% | 18% | 4% | 0.047 | $77,494,777.97 |
| KWR | Kingwest Resources | 0% | 21% | 153% | 17% | 0.205 | $51,024,335.25 |
| NSM | Northstaw | 0% | 0% | -16% | -34% | 0.295 | $11,837,465.00 |
| MDI | Middle Island Res | 0% | 49% | 17% | -56% | 0.14 | $17,750,642.19 |
| BAT | Battery Minerals | 0% | 18% | -24% | -46% | 0.013 | $30,517,039.42 |
| POL | Polymetals Resources | 0% | -16% | 0% | 0% | 0.135 | $5,582,644.90 |
| OKU | Oklo Resources | 0% | -12% | -8% | -47% | 0.115 | $58,017,095.09 |
| GML | Gateway Mining | 0% | 0% | -22% | -56% | 0.014 | $31,641,489.14 |
| MBK | Metal Bank | 0% | 8% | -24% | -51% | 0.0065 | $18,254,727.12 |
| PUR | Pursuit Minerals | 0% | -4% | -53% | -25% | 0.027 | $27,420,926.63 |
| OAU | Ora Gold | 0% | 20% | 6% | -14% | 0.018 | $18,666,465.81 |
| TRM | Truscott Mining Corp | 0% | 5% | 6% | 89% | 0.034 | $5,166,012.50 |
| AZS | Azure Minerals | 0% | 28% | 76% | -14% | 0.43 | $146,045,788.87 |
| ENR | Encounter Resources | 0% | -6% | 4% | 4% | 0.155 | $47,522,523.90 |
| AYM | Australia United Min | 0% | 7% | 0% | 0% | 0.008 | $14,740,619.88 |
| SSR | SSR Mining Inc. | 0% | -4% | 13% | 4% | 23.78 | $501,949,010.84 |
| YRL | Yandal Resources | -1% | 1% | -27% | -10% | 0.3825 | $44,114,790.14 |
| RND | Rand Mining | -1% | 0% | -3% | -24% | 1.45 | $83,038,903.06 |
| BNZ | Benzmining | -1% | -6% | -23% | -53% | 0.64 | $32,392,015.74 |
| WAF | West African Res | -1% | 6% | 22% | 41% | 1.335 | $1,378,044,690.75 |
| HRN | Horizon Gold | -1% | 9% | 10% | -5% | 0.435 | $46,411,026.96 |
| ALK | Alkane Resources | -1% | -7% | -25% | 4% | 0.865 | $530,069,243.80 |
| S2R | S2 Resources | -1% | 25% | 57% | 6% | 0.2125 | $78,402,468.10 |
| STN | Saturn Metals | -1% | 1% | -15% | -34% | 0.395 | $52,096,996.04 |
| WMC | Wiluna Mining Corp | -1% | 13% | 17% | -16% | 1.145 | $253,577,934.00 |
| ARN | Aldoro Resources | -1% | -5% | -5% | 62% | 0.365 | $34,433,856.77 |
| HCH | Hot Chili | -1% | 3% | 0% | -13% | 1.745 | $202,831,945.79 |
| SFR | Sandfire Resources | -1% | 13% | 18% | 43% | 6.88 | $3,021,566,551.41 |
| CYL | Catalyst Metals | -1% | -6% | -4% | -10% | 1.8875 | $188,050,430.93 |
| TBR | Tribune Res | -1% | -1% | -1% | -20% | 4.75 | $251,846,769.60 |
| PRU | Perseus Mining | -2% | -2% | 1% | 25% | 1.53 | $1,935,879,974.90 |
| CEL | Challenger Exp | -2% | 11% | 5% | 4% | 0.295 | $288,938,858.61 |
| BRB | Breaker Res NL | -2% | -10% | 63% | 30% | 0.26 | $86,347,846.19 |
| G50 | Gold50 | -2% | 0% | 0% | 0% | 0.25 | $14,004,500.25 |
| TIE | Tietto Minerals | -2% | 24% | 38% | 11% | 0.49 | $357,812,074.00 |
| SFM | Santa Fe Minerals | -2% | 83% | 168% | 150% | 0.22 | $16,020,133.58 |
| LCY | Legacy Iron Ore | -2% | -7% | 34% | -39% | 0.0215 | $147,357,002.58 |
| MAU | Magnetic Resources | -2% | 0% | -6% | 10% | 1.42 | $322,492,802.31 |
| GIB | Gibb River Diamonds | -2% | -10% | 33% | 3% | 0.08 | $16,920,755.60 |
| BC8 | Black Cat Syndicate | -2% | 21% | 7% | -14% | 0.6 | $87,300,842.82 |
| AGG | AngloGold Ashanti | -3% | 0% | 4% | -7% | 5.51 | $509,376,338.15 |
| PRX | Prodigy Gold NL | -3% | -13% | -18% | -27% | 0.033 | $19,809,338.60 |
| HMG | Hamelingold | -3% | 7% | 0% | 0% | 0.155 | $17,050,000.00 |
| HMG | Hamelingold | -3% | 7% | 0% | 0% | 0.155 | $17,050,000.00 |
| TAM | Tanami Gold NL | -3% | -5% | -15% | -31% | 0.061 | $72,856,016.85 |
| QML | Qmines | -3% | -6% | -12% | 0% | 0.3 | $18,624,286.91 |
| KAL | Kalgoorliegoldmining | -3% | 4% | 0% | 0% | 0.145 | $10,503,017.00 |
| MTH | Mithril Resources | -3% | -9% | -28% | -31% | 0.0145 | $36,123,262.57 |
| TG1 | Techgen Metals | -3% | -6% | -29% | 0% | 0.145 | $6,313,614.07 |
| NVA | Nova Minerals | -4% | 6% | 3% | -38% | 1.085 | $201,826,559.20 |
| CXU | Cauldron Energy | -4% | 4% | -19% | -49% | 0.026 | $12,773,634.38 |
| SVY | Stavely Minerals | -4% | 0% | 25% | -34% | 0.5 | $131,785,533.26 |
| MM8 | Medallion Metals. | -4% | 16% | 4% | 0% | 0.25 | $26,939,454.35 |
| AAR | Anglo Australian | -4% | 32% | 46% | -18% | 0.115 | $65,579,716.29 |
| CHZ | Chesser Resources | -4% | 5% | 5% | -48% | 0.115 | $54,036,776.61 |
| NMR | Native Mineral Res | -4% | 2% | -4% | -39% | 0.225 | $9,523,037.53 |
| AQI | Alicanto Min | -4% | -8% | -35% | -12% | 0.11 | $45,925,634.04 |
| TAR | Taruga Minerals | -4% | 26% | -6% | -4% | 0.044 | $24,066,820.28 |
| BEZ | Besragoldinc | -4% | 5% | 0% | 0% | 0.11 | $24,058,994.40 |
| EM2 | Eagle Mountain | -5% | 26% | -21% | 35% | 0.63 | $144,649,627.92 |
| CBY | Canterbury Resources | -5% | 1% | -16% | -30% | 0.084 | $10,348,676.52 |
| MVL | Marvel Gold | -5% | -6% | 13% | 13% | 0.06 | $36,976,766.90 |
| PKO | Peako | -5% | -9% | -41% | -39% | 0.02 | $6,169,082.02 |
| HXG | Hexagon Energy | -5% | 8% | -1% | -27% | 0.071 | $33,451,037.03 |
| CHN | Chalice Mining | -6% | -3% | 31% | 87% | 8.19 | $3,120,216,836.46 |
| REZ | Resourc & En Grp | -6% | 20% | 94% | 22% | 0.06 | $28,988,735.76 |
| CAZ | Cazaly Resources | -6% | 0% | -14% | 0% | 0.044 | $16,999,910.28 |
| MKG | Mako Gold | -7% | -2% | 9% | -15% | 0.098 | $37,077,435.39 |
| E2M | E2 Metals | -7% | -16% | -10% | -56% | 0.27 | $40,627,227.51 |
| PDI | Predictive Disc | -7% | 11% | 96% | 347% | 0.255 | $334,505,752.00 |
| GMR | Golden Rim Resources | -7% | -4% | 4% | -24% | 0.125 | $30,745,584.75 |
| CDR | Codrus Minerals | -7% | -4% | -32% | 0% | 0.125 | $5,000,000.00 |
| ICG | Inca Minerals | -8% | -5% | -1% | 11% | 0.097 | $48,121,164.80 |
| VAN | Vango Mining | -8% | -19% | -30% | -36% | 0.048 | $60,477,006.34 |
| GNM | Great Northern | -8% | -8% | -45% | -57% | 0.006 | $11,108,831.34 |
| AME | Alto Metals | -8% | -7% | 1% | -5% | 0.092 | $51,219,638.66 |
| CPM | Coopermetals | -8% | 70% | 0% | 0% | 0.28 | $7,970,900.00 |
| GED | Golden Deeps | -8% | 0% | 0% | -8% | 0.011 | $9,310,217.28 |
| DLC | Delecta | -8% | 10% | 83% | 57% | 0.011 | $13,253,995.76 |
| STK | Strickland Metals | -8% | 0% | 35% | 85% | 0.065 | $80,625,688.48 |
| MRZ | Mont Royal Resources | -9% | 3% | 50% | 38% | 0.36 | $21,292,622.12 |
| MTC | Metalstech | -9% | 7% | 69% | 80% | 0.3 | $49,999,377.00 |
| RDN | Raiden Resources | -9% | 0% | -23% | -23% | 0.02 | $30,257,200.69 |
| LCL | Los Cerros | -9% | 7% | -28% | 2% | 0.1225 | $79,761,419.38 |
| NXM | Nexus Minerals | -9% | -25% | 305% | 221% | 0.385 | $119,501,747.89 |
| RDT | Red Dirt Metals | -9% | 19% | 393% | 165% | 0.715 | $195,098,456.63 |
| SIH | Sihayo Gold | -11% | 14% | 0% | -58% | 0.008 | $29,483,691.30 |
| TSC | Twenty Seven Co. | -11% | 0% | 0% | -43% | 0.004 | $13,304,069.53 |
| GUL | Gullewa | -11% | -9% | -15% | -22% | 0.07 | $13,326,117.00 |
| GTR | Gti Resources | -12% | -4% | 8% | -17% | 0.023 | $28,219,530.70 |
| TBA | Tombola Gold | -12% | 5% | -29% | -52% | 0.029 | $21,771,730.50 |
| ERM | Emmerson Resources | -13% | 4% | 97% | 92% | 0.14 | $74,735,773.35 |
| PGD | Peregrine Gold | -13% | 48% | 42% | 0% | 0.63 | $20,999,246.88 |
| RDS | Redstone Resources | -13% | 17% | 17% | 8% | 0.014 | $10,065,986.88 |
| OKR | Okapi Resources | -13% | -9% | 5% | 41% | 0.31 | $38,294,794.66 |
| VRC | Volt Resources | -13% | -13% | -33% | 24% | 0.0235 | $69,583,206.03 |
| KCC | Kincora Copper | -13% | -4% | -46% | 0% | 0.13 | $10,600,822.26 |
| LNY | Laneway Res | -14% | 0% | 20% | -25% | 0.006 | $25,698,395.60 |
| DDD | 3D Resources | -14% | 0% | -33% | -19% | 0.003 | $13,581,302.32 |
| AXE | Archer Materials | -14% | 8% | -10% | 54% | 1.165 | $310,696,844.79 |
| PNX | PNX Metals | -15% | -21% | -39% | -21% | 0.0055 | $18,260,967.56 |
| ICL | Iceni Gold | -18% | -18% | -7% | 0% | 0.14 | $18,089,473.99 |
| GWR | GWR Group | -19% | 46% | -54% | -55% | 0.175 | $53,124,679.30 |
| PNR | Pantoro | -19% | -1% | 62% | 33% | 0.34 | $493,324,544.30 |
| SMI | Santana Minerals | -20% | -14% | 155% | 51% | 0.28 | $41,780,745.72 |
| NPM | Newpeak Metals | -50% | -33% | -50% | -71% | 0.001 | $15,299,500.07 |
| AOP | Apollo Consolidated | -100% | -100% | -100% | -100% | 0 | $177,888,559.90 |
ZULEIKA GOLD (ASX:ZAG)
ZAGs share price exploded this week thanks to a $3m private placement with Yandal Investments, a company owned and controlled by prominent West Australian prospector Mark Creasy.
Creasy is a well-known investor with a knack of picking winners.
His holding in mining company IGO (ASX:IGO) hit the $1 billion mark last week.
ZAG says proceeds from the private placement will be used to underpin the company’s ongoing drilling programs across multiple exploration targets at its gold-rich Kalgoorlie projects.
BULLETIN RESOURCES (ASX:BNR)
Another goldie dipping a leg into the lucrative lithium exploration game, BNR surged before going into trading halt to finalise an announcement in relation to an exploration update.
Either we have a leaky boat or punters have confused BNR with red hot AI stock Brainchip (ASX:BRN), which is our favourite theory.
ROX RESOURCES (ASX:RXL)
After seven months of drilling (~35,000m) RXL has increased its total resource at the ‘Younami’ project (70% RXL, 30% VMC) by a whopping 1.34Moz to 3Moz.
Discovery costs come it at an ultra-low $7/oz – an exceptional result, RXL says.
The bulk of the new gold is from the high grade ‘Deeps’ target, which now has resource of 2.195Moz grading 6.89g/t.
There are more upgrades to come, the company says, with some drilling from the last few months of 2021 still to be incorporated in the overall resource.
“We took the decision to provide an interim updated resource estimate given the very long assay turnaround times being experienced of up to 14 weeks in some cases,” RXL MD Alex Passmore says.
“Youanmi mine feasibility studies continue with early mine planning results feeding back into targeted infill drilling areas for continued conversion of inferred material into indicated categories.”
“We also continue to work on grass roots exploration activities in areas outside the immediate Youanmi mine area with the intent of making new discoveries in the region.”

Related Stories
UNLOCK INSIGHTS
Discover the untold stories of emerging ASX stocks.
Daily news and expert analysis, it's free to subscribe.
By proceeding, you confirm you understand that we handle personal information in accordance with our Privacy Policy.


